Ministry of Agriculture - DRM - Agriculture Task Force Monthly Meeting Meeting Room - Humanitarian Response
←
→
Page content transcription
If your browser does not render page correctly, please read the page content below
DRM – Agriculture Task Force

      Monthly Meeting

Ministry of Agriculture
       Meeting Room

      24th October 2019
DRM – Agriculture Task Force
Agenda
1. Welcome and Introduction
2. Review of Action Points from the last Minutes of Meeting
3. Monthly updates:
         Weather performance (NMA)
         Information Management: HNO & HRP 2020 (DRM-ATF IMO)
4. Desert Locust update (Ministry of Agriculture)
5. DRM-ATF Livelihood packages for response: working groups (DRM-ATF co-chair)
6. Updates from partners operations and/or response (DRM-ATF partners)
7. AOB
DRM – Agriculture Task Force
Minutes of Meeting from 2nd September 2019
Action Points:
Request for 5Ws monthly data from partners using the updated data collection tool (activities
implemented in the previous month and new planned activities if any). .
IMO requested Yimer from NMA the data for Rangeland by woreda in order to feed the
indicator for HNO
Partners to provide inputs and comments for indicators
IMO requested HEA data to Ato Mekonnen – Director for Livestock
The chair, Ato Mekonnen, requested partner to share best practices and lessons learned to
reduce the response average time for livestock interventions related to drought.
DRM – Agriculture Task Force

Monthly updates:
Performance weather forecast
National Climate Outlook Forum
             (NCOF)
    Bega (Oct-Jan) 2019/20
Outline
    • Introduction

    • Climatology of Bega season

    • Global Current and projected Atmospheric governing
      systems of Bega season

    • Selected analogue years and its Rainfall performance

    • Bega 2019/20 climate outlook

    • Conclusion
Introduction
• Bega - October to January
• Bega is characterized by dry, sunny, strong wind, early
  morning and night-time cold temperature, that favor for frost
  occurrence
• Second rainy season for south and southeastern Ethiopia
• October rain has the highest share particularly, over south
  and southeastern regions.
• After October, much of northern half of the country remains
  under dry weather. Hence, rain that falls after this month is
  considered as “UNSEASONAL RAIN”
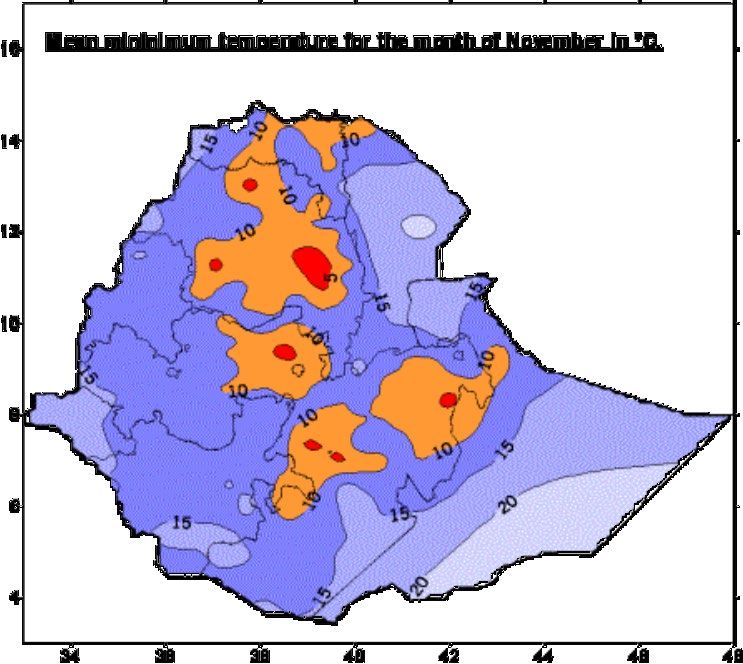
October    November

December    January
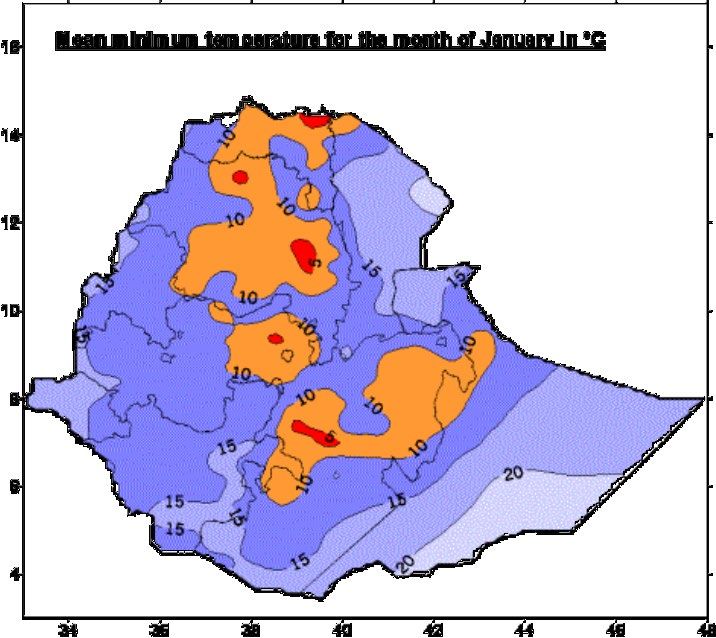
Areas
affect by
  frost
Global governing systems of Bega season
• The Saharan high pressure

• The Siberian high pressure

• The northern Atlantic Ocean and the Mediterranean sea

• High pressure cell over northern Indian Ocean and the
  adjacent Arabian sea

• The ENSO phenomena

• The IOD anomaly

• Tropical cyclones/disturbances that may develop over
  southern Indian ocean
Current Global and regional systems (oC)
Projected Global and regional systems
Current and projected Global meteorological systems ENSO-neutral conditions are present ITCZ is above the mean position Madian Julian Oscillation is in zone 1, favoring wet Positive Indian ocean dipole for ONDJ is present/expected Enso-Neutral have a probability of more than 60% in ONDJ Average to Below Average Sahara and Arabian/ Siberian High Pressure is expected
Analysis
Positive IOD

                          Enso-Neutral
The Best Analogue Years for Bega 2019/2020
is 2001/02 and 2012/13
Selected analogue years based on Niño 3.4 SST trend
2
1990-91 1992-93 1993-94 2001-02 2019-20 2012-13
1.5
1
0.5
0
Jan feb Mar Apr May Jun Jul Aug Sep Oct Nov Dec Jan Feb Mar Apr May Jun Jul Aug Sep Oct Nov Dec
-0.5
-1
-1.5Percent of normal for the Bega 2001/02 2012/13 Above Normal Normal Below Normal
Inclussives Synoptic and small scale meteorological features Stast. And Dyn. Model Global and regional pre- Seasonal indicators Analogue years performance Locally and Globally model and tools simulated seasonal forecast Consensus probabilistic forecast
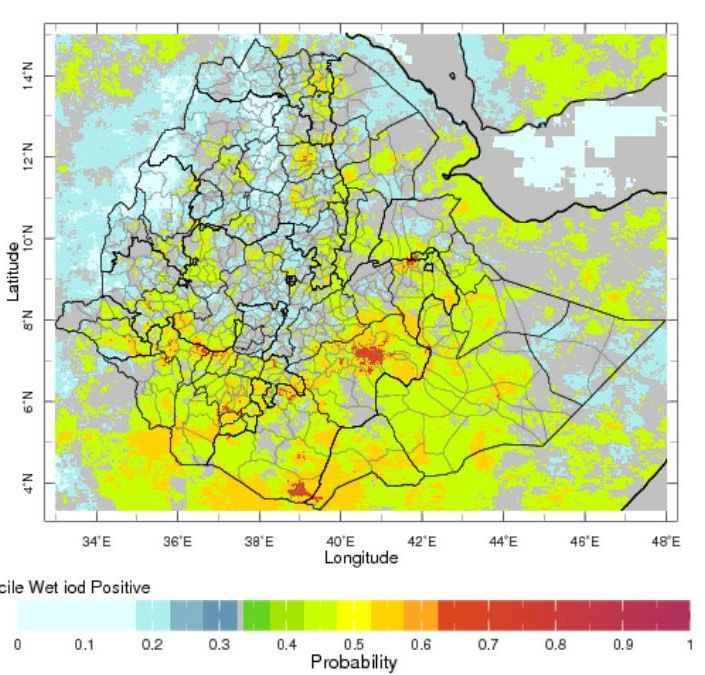
Probabilistic forecast for Bega 2019/20 climate
Conclusion Bega 2019/2020 Season Delayed Southward advances of rain-producing systems are expected to herald the beginning of second rainy season for the Southern and South-eastern lowlands. Dominantly, above normal rainfall is expected to prevail across the South and South-Eastern regions, where Bega is the second rainfall season Above Normal tending to Normal rainfall activity is anticipated across North-Western, central and Eastern Ethiopia Similarly, Below-Normal rainfall Tending to Normal is expected over most of the North-Eastern parts of the country.
A Bega season with seldom unseasonal wet conditions
will prevail over Northeastern and Northern parts of
the country.
The occurrence/prevalence of frost across frost prone
highlands of North, North-east, East and south of the
country is less likely.
Overall, Moderately wet Bega season is expected to
prevail over Ethiopia as compared to climatologically dry
Bega.
WWW.ethiomet.gov.etConclusion and Recommendation The indicated good moisture status, Rainfall Anomaly, SPI and increase in vegetation cover and Rangeland index based on WRSI on the selected analogue years particularly on the month of October and November expected to favor Bega agricultural activities. the situation confirmed by seasonal probabilistic forecast in view of the prevailing and projected climate scenarios relatively wet Bega season is anticipated to dominate much of the country in ONDJ 2019/20 The expected Normal to Above normal rainfall over southern and southeastern Ethiopia where Bega is their second rainy season would have positive impact on regenerating pasture and the availability of drinking water and crop performance of agro pastoral areas as well. Therefore, proper input should be utilized to take advantage of the relatively better condition. The expected Above Normal tending to Normal rainfall activity is anticipated across most of Meher crop producing area expected to favor the existing Meher crops where not yet fully matured and late sown pulses and oil seeds using residual moisture obtained during October over highlands.
Cont …
The expected occasional Unseasonal rain to prevail over Northern half Meher
producing areas of the country over seasonally dry sectors in areas where crops
are ready to harvest of the country would have negative impact on harvest and
post harvest activities. Thus, harvest and post harvest activities should be
undertaken on time in order to avoid unnecessary harvest and post harvest
loses.
The extended rainfall during October could be positive for lately sowing crops
to the northern, north western, eastern and the central parts of the country. In
addition to this the extended wet condition would favour flood affected areas
where replanting of the crops has been going on recently.

However, the extended rainfall was negatively affected fully matured crops in
some pocket areas especially lowland parts to the western and western half of
the country.

Moreover, The expected unseasonable rainfall would favor the occurrence of
crop pests and disease. Therefore, farmers are advised properly and regularly
visit their farm fields for monitoring pest and diseases for proper precaution
should be undertaken ahead of time to minimize loses.

The occurrence of Moist air and cloud coverage will expect the anticipated less
likely occurrence of frost over frost prone areas would create favorable
condition for the normal growth and development of plants in the area.
DRM – Agriculture Task Force

Monthly updates:
Information Management
Summary

 1   IM Products
 2   HNO-HRP 2020
 3   AoB

                    24
1 IM Products
January – September 2019 HRP Response
HH Emergency Seed
REGIONS Over all Households HH Animal Health HH Animal Feed &Tools Restocking
Afar 61,187 59,922 6,540 2,242
Amhara 5,227 4,067 1,900 1,160
Ben_Gumuz 6,978 6,978
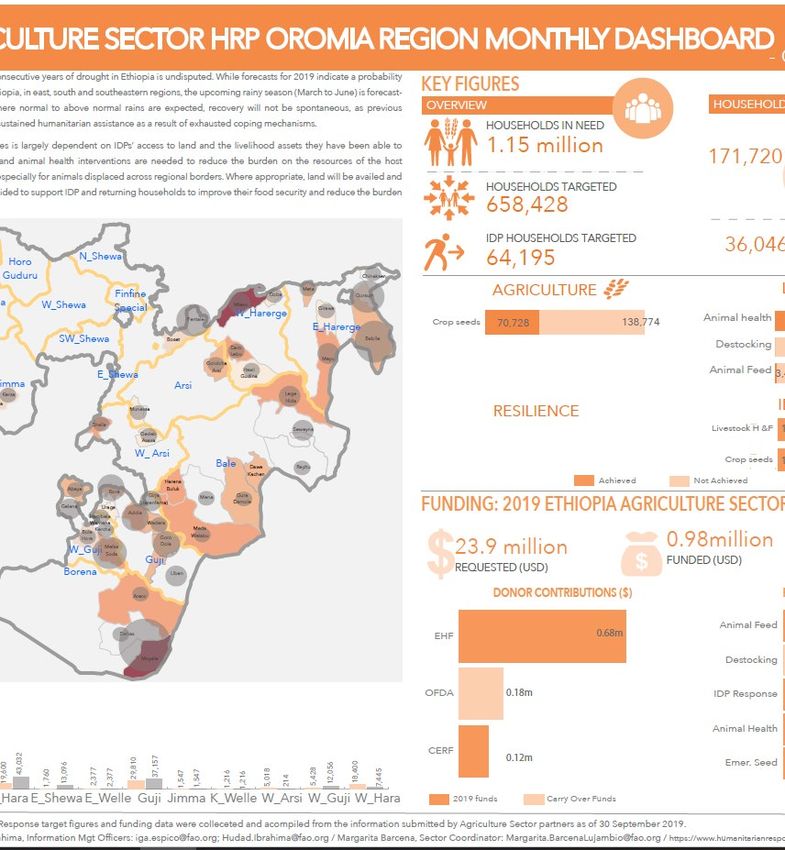
Oromia 171,720 112,004 3,860 70,728 4,110
SNNPR 19,343 IM PRODUCTS
230 19,113
Somali 99,404 95,512 3,892 850
Total 363,859 271,735 12,300 104,113 4,960IM PRODUCTS
2   HNO-HRP 2020
    Humanitarian Programme Cycle

                                   27
Total Population
Affected Humanitarian Needs
Overview (HNO)
In need
Targeted
Humanitarian Response Plan
(HRP)
Reached
Humanitarian Response
MonitoringAffected population groups for data collection and analysis
Affected population
By cause Conflict Climatic shocks Disease
outbreak
s
By status Refugees IDPs IDPs IDPs IDP IDP IDP Other Other Other IDPs IDPs Other Refugees Other
Returnees Returnees Returnees affected affected affected affected affected
population population population population population
Conflict- Conflict Conflict Conflict IDP IDP IDP Conflict- Other Food Drought- Flood- Flood Drought- Population
induced IDPs in IDPs in IDPs living returnees returnees returnees affected population insecure induced induced affected induced living in
refugees sites, in sites, within living in living who went population living in population IDPs IDPs non- refugees areas
the last 2 before the host sites within back to hosting conflict- displaced affected
years last 2 communiti host their IDPs affected population by disease
(2018- years (< es communiti homes areas outbreaks
2019) 2018) es
Cross-cutting vulnerable groups (including people with disabilities, children, women, etc.)Affected population
Conflict Climate Disease outbreak
Other affected Other affected Other affected
IDPs IDP Returnees IDPs
population population population
Affected by
Drought IDPs Flood IDPs disease
outbreaks
Living within
Living in sites host
communities
Other, living in
Hosting IDPs or Drought affected/
conflict affected
returnees Food insecure or Flood affected
areas
malnourished
Who went back
Who went back
to their kebele
to their homes
of originTotal Population
Total Population Affected Population
Disease
Flood Steps
outbreaks
affected
1. Identify shocks /
increased vulnerability
Drought Hosting of population in last 12
/ Food IDPs / months
Insecure returnees
2. Estimate population for
Other each shock, by woreda
conflict 3. Take maximum number
affected of shock-affected in
each woreda
4. Sum all woreda
maximumsAffected Population
Affected Population People in Need
Food insecure
Step 2
- Distribute affected
1 2 3 4 5 population on needs
severity scale (1-5) by
indicatorHumanitarian Consequences
Humanitarian consequences are the effects of stresses and shocks on the lives and
livelihoods of affected people, and their resilience to future negative events.
1 2 3
Critical problems related Critical problems related
Critical problems related
to physical & mental to resilience and recovery
to Living standards
wellbeing
4 Critical problems related to protection
Humanitarian Consequences
Urgent
Less urgentASSUMPTIONS
• Majority of people facing physical and mental well-being
problems also face living standards problems
• Prioritization process attributes greater criticality to
populations exceeding emergency thresholds of physical and
mental well-being problems
• To support joint response analysis a clear distinction between
groups and consequence is required Living
• PiN is not a standalone process; it needs Standards
to be in line with the severity of needs
analysis
Physical &
• Total PiN = WB + LS mental well
being
• Acute PiN = WB Severity 3 and
aboveSeverity of Need indicators, Physical and Mental Wellbeing
Indicator Source IDPs Returnees General
Population
Proportion of SAM admissions over total ENCU x
U5 population
Cholera incidence WHO/EPHI x
Case Fatality (CFR) for cholera WHO/EPHI x
Measles incidence WHO/EPHI x
Number of general violence incidents ACLED, x
(intercommunal, organized crimes, Humanitarian
military action, etc.) Access Incidents
database
% HH with % of separated and DTM, VAS x x
unaccompanied children
% of women, girls and boys that don’t DTM x
feel safeSeverity of Need: Physical and Mental Wellbeing
Region 1 2 3 4 5 Tot.
Addis Ababa 9 1 10
Afar 1 33 1 35
Amhara 144 39 183
Benishangul Gumz 20 20
Dire Dawa 13 13
Gambela 10 5 15
Harari 3 6 9
Oromia 219 101 15 335
SNNP 133 79 212
Somali 1 76 22 99
Tigray 19 33 52
Grand Total 559 386 38 0 0 983Problems related to Living Standards
• Housing damage, HLP rights and reconciliation
• Children out of school
• Negative food consumption behaviour(Borderline to poor)
• Reduced dietary diversity and food frequency (Drastic reduction in the food groups
of the HHs)
• Livelihood Coping strategy Index (Extreme)
• Reduced coping strategy index
• Household Hunger Scale
• Inadequate shelter conditions
• Lack of availability of, and access to, basic goods and services
• Reduced access to and quality of water
• Inadequate sanitary conditionsSeverity of Need indicators, Living Standards
Indicator Source IDPs Returnees General
pop.
% of HHs/population reporting damaged/occupied/destroyed shelter VAS, DRMO, x
NDRMC
% of pre-primary / primary / secondary school aged children attending DTM x
school
% of returnees have access to official documentation (eg Land Certificate) VAS x
and evidence of their HLP rights prior to displacement
% of HHs/population reporting their living outside or in an open space (no DTM, VAS x x
shelter/ house)
% of HH with barriers accessing health facilities DTM x
% of HHs/people having access to a functional sanitation facility (latrine) DTM, VAS x x
% of HHs/people having access to an improved water source DTM, VAS x x
% of HHs/people having access to a sufficient quantity of water for DTM, VAS x x
drinking, cooking, bathing, washing or other domestic use (25l/person/day)
% of households without sufficient and appropriate non food items DTM x
Food consumption score FSNMS x
Reduced coping startegy FSNMS x
Household Hunger Scale FSNMS x
Household Dietary Diversity score FSNMS xSeverity of Need: Living Standards
Region 1 2 3 4 5 Tot.
Addis Ababa 9 1 10
Afar 1 3 25 6 35
Amhara 94 63 25 1 183
Benishangul Gumz 17 3 20
Dire Dawa 11 2 13
Gambela 8 4 3 15
Harari 2 6 1 9
Oromia 167 82 56 29 1 335
SNNP 55 91 66 212
Somali 6 44 49 99
Tigray 3 30 19 52
Grand Total 356 288 251 87 1 983Overall Severity of Need
Region 1 2 3 4 5 Tot.
Addis Ababa 9 1 10
Afar 1 33 1 35
Amhara 144 39 183
Benishangul Gumz 20 20
Dire Dawa 13 13
Gambela 10 5 15
Harari 3 6 9
Oromia 219 101 15 335
SNNP 133 79 212
Somali 1 76 22 99
Tigray 19 33 52
Grand Total 559 386 38 0 0 983Prioritizing groups, locations and need factors for inclusion in HRP
Example
HNO HRP
Critical problems related to living standards
3.1 Lack of access to/availability of food
Lack of access to income opportunities and/or
3.2
means of self-sustenance
3.3 Lack of access to basic services (health care, Livelihood support for X # of hosts and X # returnees
water, sanitation, education) Access to basic services X # of IDPs
3.4
Lack of access to markets
Prioritized groups / targeted
sub-groups Prioritized
POPULATION PiN
GROUPS IDPs in Camp 150,000 locations
IDPs in Camp 316,377 - Female-headed HH
- Unaccompanied children
- IDPs in informal sites
IDPs Non - 985,562
Camp IDPs Non-Camp 650,000
Non-Displaced 118,906 Non-Displaced 50,000
Returnees 2,492,781 Returnees 1,200,000GEOGRAPHICAL SCOPE
Region 1 2 3 4 5 Tot.
Addis Ababa 9 1 10
Afar 1 3 25 6 35
Amhara 94 63 25 1 183
Benishangul Gumz 17 3 20
Dire Dawa 11 2 13
Gambela 8 4 3 15
Harari 2 6 1 9
Oromia 167 82 56 29 1 335
SNNP 55 91 66 212
Somali 6 44 49 99
Tigray 3 30 19 52
Grand Total 356 288 251 87 1 983Prioritizing groups, locations and need factors
for inclusion in HRP
1. Use IPC data for the locations covered the analysis.
2. DTM and Village Surveys for the displaced population
3. Other Sources of Data ???? Crop and animal disease1. How Significant the response in 2019 to the food insecure households
January
2. Partners Physical – September 2019 HRP Response
Presence
HH Emergency Seed
REGIONS Over all Households HH Animal Health HH Animal Feed &Tools Restocking
Afar 61,187 59,922 6,540 2,242
Amhara 5,227 4,067 1,900 1,160
Ben_Gumuz 6,978 6,978
Oromia 171,720 112,004 3,860 70,728 4,110
SNNPR 19,343 230 19,113
Somali 99,404 95,512 3,892 850
Total 363,859 271,735 12,300 104,113 4,960DRM – Agriculture Task Force Presentation: Desert Locust update Annex 2
DRM – Agriculture Task Force

Presentation:
DRM-ATF Livelihood packages for
response: working groups
Livelihood packages – Working groups
• Date: Nov 5th (TBC)
• Venue: FAO at 1.30 pm – 4.30 pm
• Partner product – operational document
• Livestock, Crop, Livelihood and Emergency technical experts
• 6-7 experts
You can also read