Internal migration in ASIA: a cross-national comparison - ADRI Shanghai University October 2019
←
→
Page content transcription
If your browser does not render page correctly, please read the page content below
Internal migration in ASIA:
 a cross-national comparison

Emeritus Professor Martin Bell ADRI
Dr Aude Bernard Shanghai University
Dr Elin Charles-Edwards October 2019
Professor Yu Zhu
Aims

This presentation:
▪ To provide a progress report on the IMAGE-Asia
 project

IMAGE-Asia:
▪ Develop a comprehensive understanding of the way
 in which internal migration varies between the
 countries of Asia
▪ Build capacity in the analysis of internal migration
 data and migration dynamics among Asia-based
 researchers
Project Structure

❑ Builds on the Global IMAGE project funded by the
 Australian Research Council, 2011-2015
❑ Project Inception, ADRI Forum, Shanghai June 2017
❑ Framework paper – ADRI WP October 2017;
 published in Asian Population Studies, 15(2), 2019
❑ Two day workshop funded by ADRI, invited scholars,
 from 20 countries, Shanghai, July 2018
❑ Refinement, revision, rewriting and updating country-
 specific contributions
❑ Preparation of an edited volume, to be published by
 Springer, mid-2020
The Global IMAGE Project – Key Features
An international collaborative program which developed a robust
framework for comparing internal migration between countries.
 Data Inventory Outcomes
▪ Identified types of migration ▪ Multinational data repository
 data and who collects what on GITHUB
 ▪ Bespoke analytical software
 Data Repository
 (IMAGE Studio) on GITHUB
▪ Assembled global collection
 ▪ Papers on methods and
 of internal migration datasets
 metrics
 Migration metrics ▪ Papers comparing countries
▪ Developed suite of robust on key aspects of migration
 migration indicators ▪ Regional papers – Latin
 America, Europe, Asia
 Analytical methods
▪ Resolved key methodological Links and references at:
 issues – eg MAUP https://imageproject.com.au
Why IMAGE-Asia ??
❑ Global IMAGE project deliberately quantitative – delivered rigorous
 metrics on migration to match eg TFR, LE, and enable creation of
 national league tables.
❑ Sought explanation via associations with other national indicators, eg
 GDP, HDI.
❑ But scale and pattern of migration is also shaped by national and
 local contexts
❑ Nuanced explanation calls for subtle blending of robust metrics with
 understanding of contextual forces
❑ IMAGE-Asia attempts this by embedding IMAGE migration metrics in
 bespoke analyses written by selected country experts but using a
 clearly structured format.
❑ Country experts bring to bear local knowledge but also include local
 datasets – eg surveys - to supplement analysis and aid interpretation.
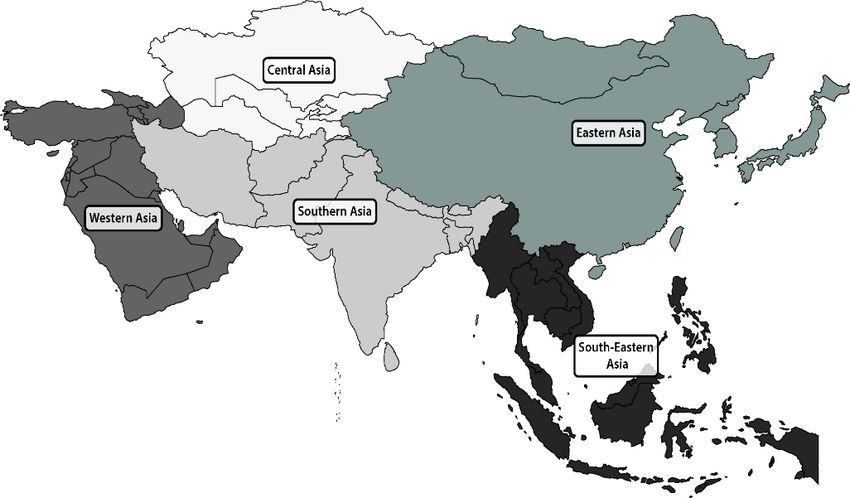
The IMAGE-Asia Community
❑ 47 UN member states spanning 160 degrees of longitude and embracing
 multiple languages, cultures, histories, political systems and levels of
 development.
❑ Not all collect migration data; several war-torn; some lack professional
 contacts; some un-responsive
❑ 18 countries attended 2018 Shanghai workshop; 15 delivered chapters.

 Armenia (??) Kazakhstan ??
 Bhutan Mongolia ?
 Cambodia Myanmar
 China Nepal ??
 India South Korea
 Iran Sri Lanka ?
 Israel Thailand
 Japan
Three Dimensions of Migration

The IMAGE Project identified five dimensions of migration:
Intensity, Distance, Selectivity, Impact, Connectivity.
IMAGE–Asia focuses on three of these, each of which
provides a unique perspective on population mobility:
▪ Overall migration intensity – the level or rate of movement
 – the propensity to move
▪ The age profile of migration, especially the age at which
 migration peaks
▪ The spatial impact of migration - its effect in redistributing
 population and changing the pattern of human settlement
Measuring Migration Intensity
▪ ‘Intensity’ encompasses both ‘rates’ and ‘probabilities’

▪ CMI – Crude migration intensity: = 100 × where

 ▪ M = number of migrants or migrations in an interval
 ▪ P = population at risk (start of interval for transitions)
▪ Can calculate for any spatial scale –
 ▪ But result depends on spatial scale and observation interval
▪ Only comparable figure is ALL changes of address,
 irrespective of distance moved – ACMI (Aggregate CMI)
▪ Few countries collect this directly so we use a method
 devised by Courgeau et al. (1973/2012) to estimate it for
 other countries
Estimating the ACMI for Iran 2006-11

 Estimated ACMI 11.3%
Courgeau, Bell and
Muhidin (2012)
demonstrated a linear
relationship between
 63079 cities/villages 7.41%
CMI and log of average
number of households
per zone
 326 Shahrestans 4.16%

IMAGE Studio provides
 31 Ostans 2.66%
a framework to generate
additional observations 5 Regions 1.63%
for different levels of
scale and different
spatial patterns
Aggregate Crude Migration Intensities in Asia
Five year intensities

 Fiver year intensities
 The ACMI is a measure or
 estimate of ALL changes of
address over a five year period
 and so is directly comparable
 between countries
Measuring Age Composition
Rogers and colleagues (1978, 1983) identified global
regularities in the age profile of migration that appear to hold
irrespective of spatial scale
Migration peaks among young adults, falls at older ages and
among teenagers, and rises again among children,
sometimes with a peak in retirement and/or a rise in old age.

Later research
revealed marked
variations in the age
and intensity at the
peak
Global Variations in the Age Profile of Migration

 Explained by
 differences in
 the timing of
 the transition
 to adulthood:
 • Education
 • Partnership
 • First job
 • Fertility

 Bernard, A., Bell, M., & Charles-Edwards, E. (2014). Life-Course Transitions and the Age Profile of Internal Migration. Population and
 Development Review, 40(2), 231-239.
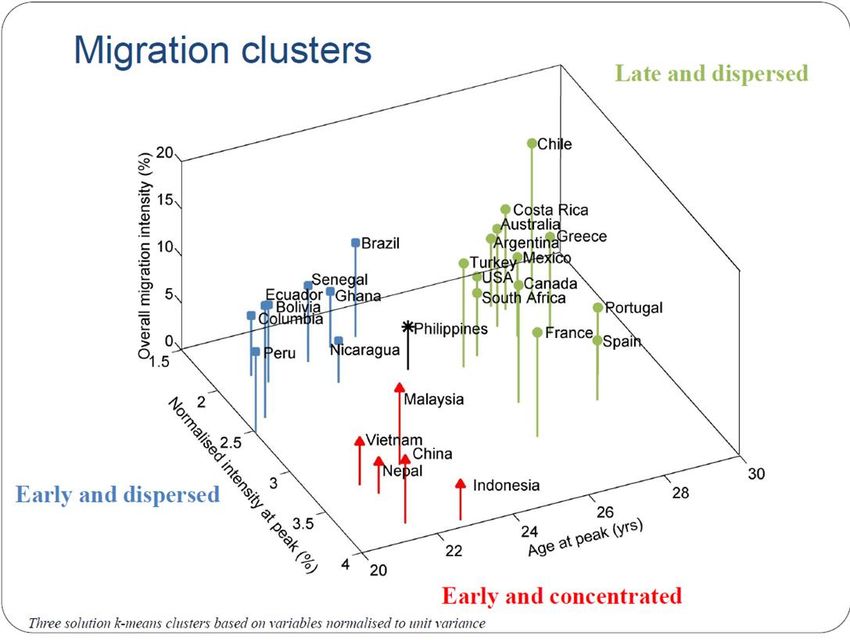
Variations in Migration Age Profile in Asia
Measuring the Spatial Impact of Migration
Index of Net Migration Impact (INMI) (Rees et al 2016)

❑ Measures the net impact of migration in redistributing
 population between regions.
❑ Based on the Aggregate Net Nigration Rate (ANMR) which
 links the CMI (migration intensity) with the MEI (migration
 effectiveness index) ANMR = CMI × MEI
❑ INMI generalises this equation so that it measures
 redistribution at all spatial levels and is therefore
 comparable across countries
Comparing Redistribution across Countries

 Index of Net
 Migration Impact
 ▪ Compares countries on
 extent of redistribution
 ▪ Scaled to average of all
 Asian countries as
 reference category so that
 Index of 1.0 is average for
 all countries

 Rees, P., Bell, M, Kupiszewski, M. and Kupiszewska,
 D. Ueffing, P., Bernard, A., Charles-Edwards, E, and
 Stillwell, J., [2016]: The Impact of Internal Migration on
 Population Redistribution: An International Comparison,
 Population, Space and Place, 23(6):1-22. DOI:
 10.1002/psp.2036
Spatial Impact Depends on Intensity and Effectiveness

 Index of Net
 Migration Impact
 ▪ compares countries on
 extent of redistribution
 ▪ Index of r=1.0 is average
 for all countries
 ▪ Shows relative
 contributions of intensity
 and redistribution

 Rees, P., Bell, M, Kupiszewski, M. and
 Kupiszewska, D. Ueffing, P., Bernard, A., Charles-
 Edwards, E, and Stillwell, J., [2016]: The Impact of
 Internal Migration on Population Redistribution: An
 International Comparison, Population, Space and
 Place, DOI: 10.1002/psp.2036

CRICOS Provider No 00025B
Beyond the Simple Rural-Urban Dichotomy

 • Few countries collect
 useable data on rural
 urban migration
 • We use population
 density as a proxy for
 urbanisation
 • Plot net migration rate
 against density for each
 region

 • Slope of regression line
 indicates direction and
 strength of redistribution
Linking Population Redistribution to Development

 Phases in population redistribution
 1 - Early urbanization
 2 - Mature urbanization
 3 - Late urbanization
 4 - Counter-urbanization
 5 - After the transitions:
 (a) Re-urbanization
 (b) De-urbanization
 (c) Dynamic equilibrium

 Rees, P., Bell, M, Kupiszewski, M. and Kupiszewska, D. Ueffing, P., Bernard, A., Charles-Edwards, E, and Stillwell, J., [2016]: The Impact of
 Internal Migration on Population Redistribution: An International Comparison, Population, Space and Place, DOI: 10.1002/psp.2036
Commonalities and Differences
Common Theoretical Frameworks (all countries):
❑ Economic development; Urban transition; Transition to adulthood

Forces shaping migration in some countries, some times
❑ Sporadic events - natural disasters, military conflict, political upheaval
❑ Interactions with other forms of mobility – circulation, international
 migration
❑ Gender roles; ethnic composition
❑ Strength of particular reasons for migration – eg military service,
 marriage, education, displacement
❑ Government policy instruments, controls and constraints
❑ Cultural norms and expectations
❑ Historical inertia
Common Chapter Structure
The editors devised a common structure for each substantive
chapter to facilitate comparability:

1. Introduction (300-500)
2. Internal Migration Data (500-700)
3. The Spatial Framework (500-700)
4. Prior Research (500-700)
5. How Much Movement? - Migration Intensity (700-900)
6. Who Moves? – The Characteristics of Migrants (700-900).
7. Where Do They Move? - Spatial Patterns (1000-1200).
8. Understanding Internal Migration (800-1000)
9. Impacts and Implications (500-700)
10. Conclusions (500)

In addition, each chapter utilises a series of common graphics and tables.
Publication
Format of the book
• Chapter 1: Introduction
• Chapter 2: Conceptual Framework – (3)
• Chapter 3: Methods of Analysis
• Chapter 4-18: Country chapters
• Chapter 19: Conclusions

Publication
• Springer Nature – mid 2020
• Approx 400 pages
• Hardcopy, POD and E-copy
• All colour
• Copies to all authors
• Individual chapters can be purchased
IMAGE Project Resources 1
 Electronic Resources
IMAGE Project main webpage : https://imageproject.com.au/framework/
IMAGE Studio software and datasets : https://github.com/IMAGE-Project

USER Guides
Bell, M., Bernard, A., Ueffing, P. & Charles-Edwards, E. [2014]: The IMAGE Repository: A User Guide, Working Paper
2014/01, Queensland Centre for Population Research, The University of Queensland
https://imageprojectcomau.files.wordpress.com/2017/03/imagerepossitoryuserguide.pdf
Bell, M., Bernard, A., Charles-Edwards, E., Kupiszewska, D., Kupiszewski, M., Stillwell, J., Zhu, Y., Ueffing, P. & Booth, A.
(2015) The IMAGE Inventory: A user guide, Working Paper 2015/01, Queensland Centre for Population Research,
University of Queensland, Brisbane. https://imageprojectcomau.files.wordpress.com/2017/03/imageinventoryuserguide.pdf
Daras, K. [2014]: IMAGE Studio 1.4.2 User Manual, School of Geography, University of Leeds
https://imageprojectcomau.files.wordpress.com/2018/11/image_studio_1_4_2_user_manual.pdf

Technical Papers
Bernard, A., & Bell, M. (2015). Smoothing internal migration age profiles for comparative research. Demographic
Research, 32(33), 915-948.
Courgeau, D., Muhidin, S. & Bell, M. [2012]: Estimating changes of residence for cross-national comparison, Population-
E, 67(4): 631-652, DOI 10.3917/pope.1204.0631. Also published as Estimer les changements de résidence pour
permettre les comparaisons internationales, Population-F, 67(4): 747-770, DOI : 10317/popu.1204.0747
Stillwell, J., Daras, K., Bell, M. & Lomax, N. (2014), The IMAGE Studio: a tool for internal migration analysis and modelling,
Applied Spatial Analysis and Policy, 7(1), 1-23
Stillwell, J., Daras, K. & Bell, M. [2018]: Spatial aggregation methods for investigating the MAUP effects in migration
analysis, Applied Spatial Analysis and Policy, https://doi.org/10.1007/s12061-018-9274-6
IMAGE Project Resources 2
Thematic Papers
Bell, M., Blake, M., Boyle, P., Duke-Williams, O., Rees, P., Stillwell, J. & Hugo, G. [2002]: Cross-national comparison of
internal migration: issues and measures, Journal of the Royal Statistical Society A, 165(3): 435-464
Bell, M, and Charles-Edwards, E. [2013]: Cross-national comparisons of internal migration: an update of global patterns
and trends, Technical paper 2013/1, Population Division, United Nations Department of Economic and Social Affairs, New
York. http://www.un.org/en/development/desa/population/publications/pdf/technical/TP2013-1.pdf
Bell, M., Charles-Edwards, E., Kupiszewska, D., Kupiszewski, M., Stillwell, J., & Zhu, Y. [2014]: Internal migration data
around the world: assessing contemporary practice. Population, Space and Place, 21(1), 1-17.
Bernard, A., Bell, M., & Charles-Edwards, E. [2014]: Life-course transitions and the age profile of internal migration,
Population and Development Review. 40(2): 231-239.
Bernard, A, Bell, M & Charles-Edwards, E [2014]: Improved measures for the cross-national comparison of age profiles of
internal migration, Population Studies, 68(2): 179-195
Bell, M, & Charles-Edwards, E. [2014]: Measuring Internal Migration around the Globe: A Comparative Analysis, KNOMAD
Working Paper 3/2014, The World Bank
http://www.knomad.org/docs/internal_migration/KNOMAD%20Working%20Paper%203_BellCharles-Edwards_12-19-
2014.pdf
Bell, M, Charles-Edwards, E, Ueffing, P., Stillwell, J., Kupiszewski, M. & Kupiszewska, D. [2015]: Internal migration and
development: comparing migration intensities around the world, Population and Development Review, 41(1), 33-58
Rees, P., Bell, M, Kupiszewski, M. and Kupiszewska, D. Ueffing, P., Bernard, A., Charles-Edwards, E, & Stillwell, J.,
[2016]: The impact of internal migration on population redistribution: an international comparison, Population, Space and
Place, DOI: 10.1002/psp.2036
Stillwell, J., Bell, M., Ueffing, P., Daras, K., Charles-Edwards, E., Kupiszewski, M. & Kupiszewska, D. [2016]: Internal
migration around the world: comparing distance travelled and its frictional effect, Environment and Planning, A. DOI:
10.1177/0308518X16643963
IMAGE Project Resources 3
Thematic Papers (continued)

Bernard, A., Bell, M. & Charles-Edwards, E. [2016]: Internal migration age patterns and the transition to adulthood:
Australia and Great Britain compared, Journal of Population Research, 33(2): 123-146. DOI 10.1007/s12546-016-9157-0
Stillwell, J., Bell, M. & Shuttleworth, I. [2017]: Studying internal migration in a cross-national context, pp. 56-75 in
Champion, A, Cooke, T. & Shuttleworth, I. (eds.) Internal Migration in the Developed World. Are We Becoming Less
Mobile, Routledge.

Regional Analyses
Charles-Edwards, E., Muhidin, S., Bell, M. & Zhu, Y. [2016]: Regional perspectives: migration in Asia, pp. 269-284 in
Michael White (ed) International Handbook of Migration and Population Distribution, Springer. DOI 10.1007/978-94-017-
7282-2
Charles-Edwards, E., Bell, M., Bernard, A. & Zhu, Y. [2017]: Internal migration in the countries of Asia: levels, ages and
spatial impacts, Working Paper 1/2017, Asian Demographic Research Institute, Shanghai University
Bernard, A., Rowe, F., Bell, M., Ueffing, P. & Charles-Edwards, E. [2017]: Comparing internal migration across the
countries of Latin America: A multidimensional approach, PLoS ONE 12(3): e0173895.
https://doi.org/10.1371/journal.pone.0173895
Charles-Edwards, E., Bell, M., Bernard, A. & Zhu, Y. [2019]: Internal migration in the countries of Asia: levels, ages and
spatial impacts, Asian Population Studies, 15(2): 150-171, DOI: 10.1080/17441730.2019.1619256
You can also read