Russian economy and financial sector: beyond crisis but under sanctions. What to expect? Analytical Credit Rating Agency (ACRA) - Natalia ...
←
→
Page content transcription
If your browser does not render page correctly, please read the page content below
9 April 2018, Berlin

Russian economy and financial sector: beyond crisis but under
               sanctions. What to expect?
          Analytical Credit Rating Agency (ACRA)

                                                   Natalia Porokhova
                                                      Kirill Lukashuk

                                            http://www.acra-ratings.com/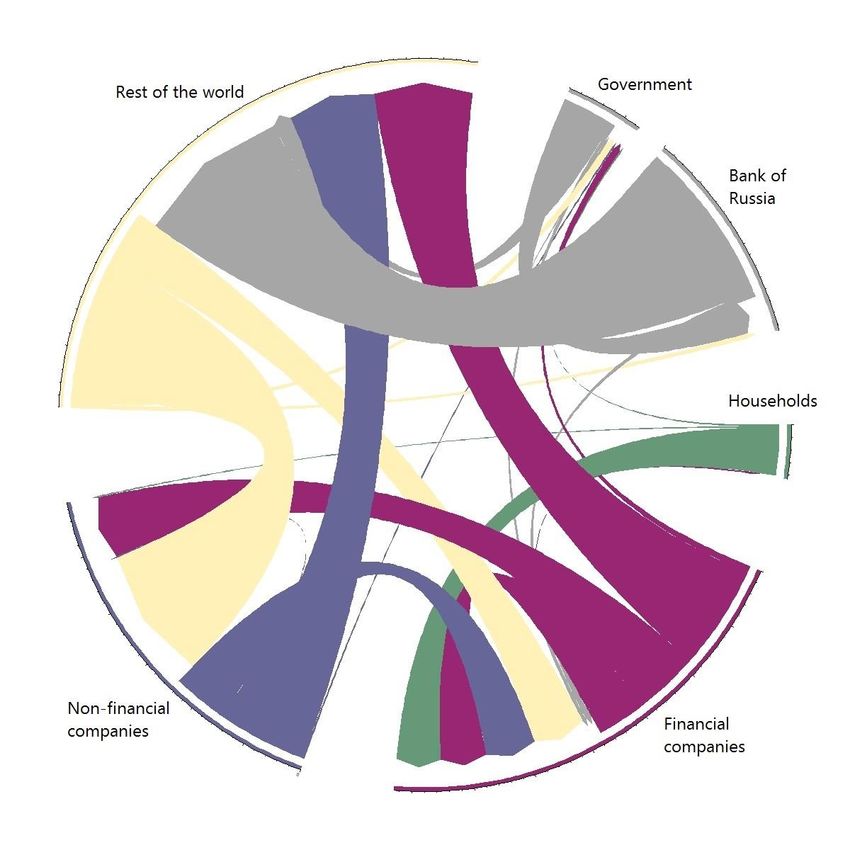
ACRA at a Glance
The Analytical Credit Rating Agency (Joint-Stock Company) was founded on November 20, 2015
Authorized capital of more than RUB 3 billion (more than USD 50mln)
27 shareholders – Russia’s largest companies and financial institutions – holding a 3.7% stake each
ACRA’s activities fully comply with the requirements of Federal Law N 222-FZ
August 25, 2016 ACRA became the first CRA included in the register of the Central Bank of Russia
ACRA’s clients are:
1. Financial institutions (banks, non-bank financial institutions, insurance companies)
2. Corporate entities
3. Regional and municipal authorities of the Russian Federation
National credit ratings scale includes ratings from AAA (RU) to D (RU)
Regular macroeconomic analysis and coverage of 20 sectors by designated analytical teams
1 http://www.acra-ratings.com/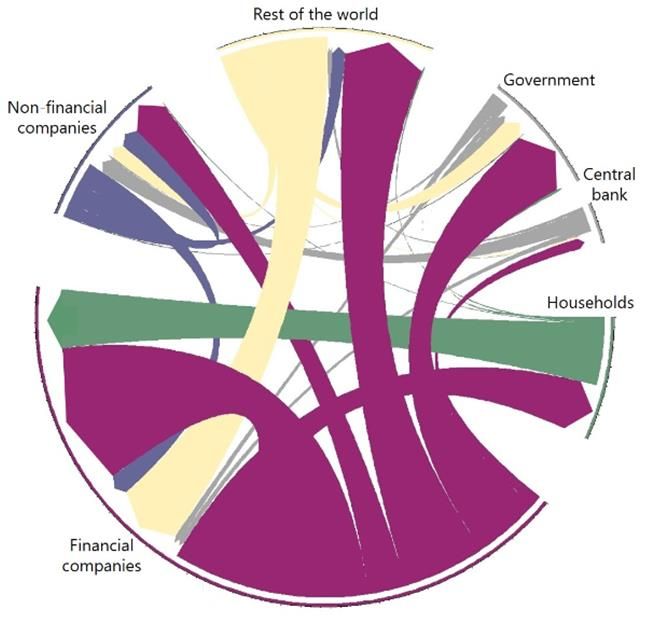
Share of banks with ACRA ratings is more than 80%

         Share of issuers with ACRA ratings on Russian bond market as at February 2, 2018*

                                   80%
                                                           72%

            49%

                                                                                          31%

    Financial institutions         Banks                  Regions                    Corporates

                                                                        *By volume of issues      Source: ACRA

2
                                                                           http://www.acra-ratings.com/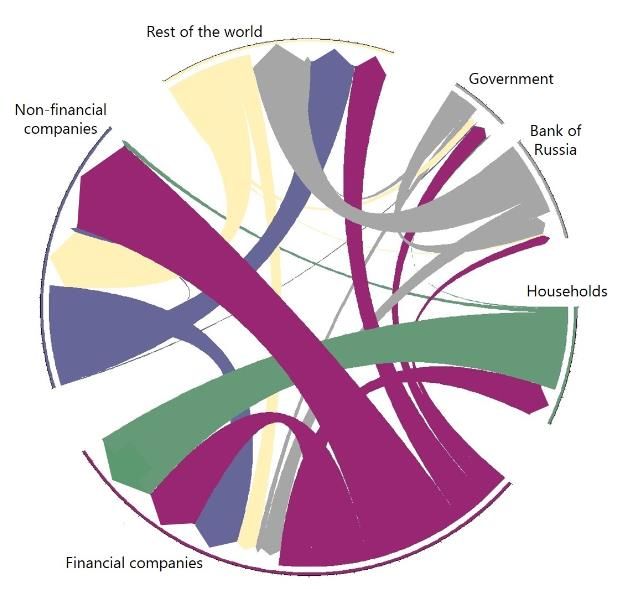
ACRA Shareholders

3                       http://www.acra-ratings.com/

Board of Directors (1)

                       ACRA’s Board of Directors and top management have
                        extensive global experience in the rating industry

          KARL JOHANSSON – CHAIRMAN OF THE BOARD OF DIRECTORS (USA)

          From 1995 to 2000, Mr. Johansson was a Managing Partner of Ernst & Young CIS, after that he was a Regional Partner for Eastern
          Europe countries, including CIS (Vienna, Austria). From 2006 to 2014, he worked as Managing partner of Ernst & Young CIS in
          Moscow. While in Russia, he was a coordinator of the Foreign Investment Advisory Council (FIAC) under the Government of the
          Russian Federation.

          THOMAS MISSONG – MEMBER OF THE BOARD OF DIRECTORS (AUSTRIA)

          Has more than 16 years of experience in the field of financial markets, 10 of which in rating advisory activities. Since 2010, he
          serves as the President of the European Association of Credit Rating Agencies EACRA (Paris, France). He is a Managing Director at
          RATINGPLATFORM, a company providing research on rating agencies.

4                                                                                                     http://www.acra-ratings.com/
Board of Directors (2)

         ANOUAR HASSOUNE – MEMBER OF THE BOARD OF DIRECTORS (LUXEMBURG)

         Has more than 15 years of experience in the field of financial markets, including 12 years in international rating agencies, namely,
         Moody's and Standard and Poor’s. From 2012 to 2015, he worked for The Bank of Tokyo-Mitsubishi UFJ as the head of research
         and strategy for the Middle East and Africa. At present, he is a co-founder, co-owner and a Managing Director of West Africa
         Rating Agency, as well as a Managing Partner of Euris Group.

         EKATERINA TROFIMOVA – MEMBER OF THE BOARD OF DIRECTORS,
         CHIEF EXECUTIVE OFFICER (RUSSIA)

         From 2000 to 2011, Ms. Trofimova worked as a financial analyst, Director and Head of Russia and CIS Financial Institutions Rating
         Group at Standard & Poor’s (Paris, France). In 2011 she joined Gazprombank and from 2012 to 2015 was a member of the Bank’s
         Management Board and supervised the Rating Advisory Center.

         VINCENT TRUGLIA – MEMBER OF THE BOARD OF DIRECTORS (USA)

         Has more than 40 years of experience in the field of financial markets, including 15 years at Moody’s, 11 of which as a Managing
         Director of the sovereign risk analytical team. As an independent consultant, he participated in strategy development for the non-
         profit rating agency INCRA.

5                                                                                                      http://www.acra-ratings.com/
ACRA Key Principles

    Good faith and high standards of rating   • Qualified personnel with professional experience in the rating industry

                   activities                 • Code of Ethics and Professional Conduct is strictly adhered

Independence and prevention of conflicts      • Transparent and diversified ownership structure

              of interest                     • Internal controls identifying and eliminating any conflicts of interest

Timely disclosure of information on ACRA’s    • Mandatory release of draft rating methodologies on ACRA’s website

                 activities                   • Annual publication of the transparency report of ACRA’s activities

                                              • Strict compliance monitoring at all stages of rating process
     Protection of confidential information
                                              • Modern IT systems, data protection and rating process support

                                              • All ACRA’s policies are publicly available on the official website
Transparency of rating methodologies and
           the rating process                 • Market participants involvement in rating methodologies discussion.

6                                                                                                               http://www.acra-ratings.com/
ACRA Methodology Key Advantages

• Ensuring comparability of all assessments

• Accounting for Russian sectoral and regional specifics, as well as corporate governance peculiarities

• Ensuring transparency of assessment algorithms while retaining the ability to account for expert opinions

• Multiple-stage validation of all methodologies and rating models

• Accounting for forecast data in the course of creditworthiness assessment

• Employment of risk accumulation technology, i.e. pinpointing ‘anchor’ rating assessment factors

• Synergy between research departments and accounting for relevant expertise of contiguous business units in the course
    of rating assessment (banking, regional and macroeconomics groups)

7                                                                                           http://www.acra-ratings.com/
International and National Scales

        International       National
            scale            scale      • The international rating scale compares creditworthiness of all
                                          borrowers around the world
              AAA            AAA(RU)       • The country ceiling caps an issuer’s rating at the sovereign level,
              AA+            AA+(RU)
              AA             AA(RU)          which results in strong rating compression in countries where the
              AA-            AA-(RU)         sovereign rating is not the highest, i.e. borrowers of different
                             A+(RU)
                A+
                             A(RU)           quality are assigned the same ratings
                A
                             A-(RU)
                A-           BBB+(RU)   • The national rating scale compares creditworthiness of individual
                BBB+         BBB(RU)
                BBB          BBB-(RU)
                                          borrowers in a country with that of the national government
Country ceiling
                BBB-         BB+(RU)
                BB+          BB(RU)        • Regulators around the globe are switching to national scale
                BB           BB-(RU)         ratings
                BB-          B+(RU)
                B+           B(RU)
                B            B-(RU)
                B-           CCC(RU)
                             CC(RU)
                CCC
                             C(RU)
                CC           SD(RU)
                C            D(RU)
                SD                                                 http://www.acra-
                D
                                                                          ratings.ru/

    8                                                                              http://www.acra-ratings.com/
ACRA Methodological Toolbox: Design and Contents
Methodologies Principles
General approaches: Each and every ACRA methodology…
Key concepts of ACRA
Bonds ratings ….is developed by the methodology team in close cooperation with the analytical
General principles of forecasting team
ACRA Financial Stress Index …undergoes multiple validation and testing procedures
Financial institutions:
Banks and bank groups Testing samples:
Leasing companies
FI: 110 banks / 30 defaults / 3 years
Insurance companies
Microfinance organizations Corporates: 135 companies / 11 defaults / 4 years
Asset management companies Public finance: 85 regional governments / 5 years
Support assessment:
Government-related entities Validation and testing:
Group support and relationships
Foreign shareholder support G-spread and duration test
Public finance: Coefficient correlations test
Regional and municipal authorities
Prediction power assessment
Non-financial institutions: ACRA is fully equipped with methodologies for assigning ratings to a
Corporate rated entities wide range of rated entities and instruments within the financial,
Structured finance corporate or public sectors.
9 http://www.acra-ratings.com/Commercial research
ACRA’s team comprises well-known economists and industry analysts who communicate with financial and real economy sector
companies as well as federal and regional authorities in practical contexts on a daily basis
Proprietary models and databases covering economies of countries and regions, budgets, and corporate finance
ACRA regularly publishes Russian economic outlook and industry forecasts as well as relevant topical research. These publications can
be found at: https://www.acra-ratings.ru/research
Macroeconomic and industry indicators forecast are in compliance with the proprietary methodology published on ACRA’s website
Fundamental research Industry forecasts Economic models
Assessing and forecasting effects on Forecasting industry indicators for: Excel models achieving client’s goals
the economy, regions, industries and • Issues to automate and visualize various
companies from changes in: • Credit quality economic scenarios
• Public policy (including fiscal and • Investment activities
tax, monetary, foreign economic
policy, etc.) For more details regarding this service
• Commodity and financial markets please contact Natalia Porokhova, Head of
• Ruble FX rate, prices, and interest Research and Forecasting Group,
rates natalia.porokhova@acra-ratings.ru
+7 495 139 04 90
10 http://www.acra-ratings.ru/Rating Model Validation
What we offer:
Calculation of quantitative efficiency metrics with respect to PD, LGD, EAD models of corporate borrowers, ALM models, IFRS9
provisioning models as well as marketing and collection models
For more information, please contact
Qualitative validation of models Olesya Shekholtseva, Project Manager
olesya.shekholtseva@acra-ratings.ru
Preparation of validation reports for potential submission to the Bank of Russia
+7 495 139 04 80 , ext. 127
Readiness assessment when preparing IRB models for submission to the Bank of Russia
Benefits for the client:
There would be no need for the client to create a separate division with highly-paid specialists who are underemployed most of the time
The client could avoid a conflict of interests that arises when validation and development are performed by the same division
Professional approach based on global best practices and experience in validating ACRA’s internal models and methodologies
ACRA’s specialists of Analytical Services Development Group are highly competent in validation of various model types (IRB, ICAAP,
IFRS9, ALM, etc.)
A opportunity to identify any bottlenecks in client’s models and determine areas for development
11 http://www.acra-ratings.ru/ACRA Trainings on Credit Analysis
Forthcoming trainings ACRA sees its mission in developing best practices
that provide the Russian financial market with basis
Fundamentals of credit analysis of regional and municipal authorities
for sustainable performance
(April 12-13)
Rating modelling fundamentals ACRA’s expertise is unique in terms of its
(April 23-24) competences and profound understanding of credit
risk
NEW! Forecasting in credit analysis. Course 1: macroeconomic and industry forecasting
fundamentals ACRA trainings are aimed at enhancing
(May 14-15) qualifications of financial market participants and
building up efficiency of managerial and investment
NEW! Change management hosted and presented by Ekaterina Trofimova, ACRA CEO
decision making
(May 21)
Fundamentals of credit analysis of insurance companies
(May 24-25)
Corporate credit analysis fundamentals
(May 29-30)
NEW! Advanced analysis of structured finance deals
(May 31 – June 1)
The art of presentation in credit analysis hosted and presented by Ekaterina Trofimova, ACRA CEO
(June 21-22)
Fundamentals of structured finance deals analysis For more information and enrollment,
(July 2-3) please contact
Fundamentals of asset management companies reliability analysis and credit analysis of non-
state pension funds
Artem Mayorov, Manager
(September 6-7) artem.mayorov@acra-ratings.ru
NEW! Forecasting in credit analysis. Course 2: practical aspects of economic modeling +7 495 139 04 80, ext. 147
(September 10-11)
Fundamentals of sovereign risk credit analysis
(Autumn, 2018)
12 http://www.acra-ratings.com/ACRA’s International activities
Cross-border projects:
Supranational methodology
Trade counterparties assessment
ACRA
International
International investors outreach: EAEU presence:
Insider’s view Central Banks dialog
Media events Analytical coverage
13 http://www.acra-ratings.com/Cooperation with a Chinese rating agency Golden Credit
On November 2 2017 ACRA signed the Memorandum of Understanding with a Chinese rating agency
Golden Credit Rating International (http://www.dfratings.com/)
Golden Credit rating agency
is among top five credit rating agencies in China
possesses a complete range of licenses required to
provide rating services
key shareholder is the state managing company China
Orient Asset Management established by the
Ministry of Finance of the PRC
Prospects for cooperation of ACRA and Golden Credit
o conduct joint analytical work For more information, please contact
o develop technological and informational cooperation Maria Mukhina, Operational director
o pursue mutual acknowledgement by Chinese and maria.mukhina@acra-ratings.ru
Russian investors and regulators +7 495 139 04 80, доб. 107
14 http://www.acra-ratings.ru/New economic environment: prospects for
development and key risks of Russian economy
Analytical Credit Rating Agency (ACRA)
http://www.acra-ratings.com/Russia: Absence of Usual Growth Conditions Offset by Impetus For Change
Key trends in Russian economy that can contribute to future economic growth and development:
1. Population ageing – constrains economic growth but gives additional stimuli for some industries.
2. Switching to low inflation mode – higher predictability for business and cheaper loans, but government and
businesses should seek new forms of flexibility.
3. Government expenditures decline – government role squeeze and inequality growth, more space for private activities
4. Turn to East – increase in share of Asian countries in exports, imports, FDI and external debt.
5. Sanctions – financial sanctions are absorbed, but sanctions against oil & gas companies will limit crude oil production
growth in 2020s.
Indicator 2015 2016 2017 2018 2019 2020 2021 2022
Real GDP (%, y-o-y) -2.5 -0.2 1.5 1.6 1.5 1.5 1.5 1.7
Inflation (%, Dec/Dec) 13.2 5.4 2.5 4.1 4.1 4 3.9 3.8
Urals oil price, USD/bbl 51.3 42.3 53.5 58 59.2 60.3 61.6 62.8
USD/RUB (12-month average) 61.3 67.2 58.3 58.3 58.8 59.7 60.5 60.2
Unemployment, % 5.6 5.5 5.2 5.2 5.3 5.4 5.4 5.4
References: ACRA macroeconomic forecast, Federal State
16 http://www.acra-ratings.com/
Statistics Service, Federal Treasury, Bank of RussiaLimitations for Further Extensive Growth of Russian Economy
Labor force Imports of goods
78 1,6
Imports of goods value index (2008=1)
77 1,4
Investment-oriented imports
76
1,2
75
1,0
74
0,8
73
0,6
72
0,4
71
0,2
70
69 0,0
2019
2000
2001
2002
2003
2004
2005
2006
2007
2008
2009
2010
2011
2012
2013
2014
2015
2016
2017
2018
2020
17 Source: Federal State Statistics Service, ACRA http://www.acra-ratings.com/Russia’s Potential Economic Growth is close to +1.5%
Total factor
productivity Working time
(a one-off)
-0.4
+0.3
+0.9 Labor force
Fixed capital
+1.5 +1.8
+0.8
Natural
resources
+0.2
18 Source: ACRA estimates http://www.acra-ratings.com/Economy is Close to it’s Potential GDP Growth Rate
12 11
Capacity underutilization (%, lhs)
10 10 Modest prospects of cyclical growth
Unemployment rate (%, rhs)
A relatively high level of labor, resources and
8 9 capacity utilization.
6 8 Low possibility of extensive expansion
Adverse demography: the employed
4 7 numbers to decline by 2-4% in 5 years
(accounting for offsetting effects of elderly
employment and expected migration).
2 6
Expensive investment-oriented imports
0 5 (due to RUB depreciation) is a source of
difficulties for capital-intensive industries.
-2 4
19 Source: Federal State Statistics Service, ACRA http://www.acra-ratings.com/Monetary policy approaching “neutral state” …
18
16
14
12 Bank of Russia deposit
rate (1 day) %
10
8 X
Projected level for SR rates ‘in equilibrium’
6 ?
4
Inflation target
2 Inflation, % Y-o-Y
0
2012 2013 2014 2015 2016 2017 2018 2019 2020 2021
20 Source: ACRA, Bank of Russia http://www.acra-ratings.com/… but the neutral rate itself could fall
CBR’s public method of neutral interest rate estimation
14 14
12 12
transition
10 10
Russia’s country risk
8 8
6 6
Global neutral rate
4 4
Target inflation (after monetary
2
policy transition) 2
0 0
2001-2003 2004-2006 2007-2009 2010-2014 2015-2017 2018 2019-2022*
21 Source: ACRA, Bank of Russia http://www.acra-ratings.ru/Inflation fell to historic lows, but its volatility may still be high
Inflation decomposition by factors and forecast for 2018-2021
Tariffs and
16% regulated prices
Monetary inflation
14% and expectations
Food market
conditions
12% Ruble Exchange rate
10% Inflation target
8%
6%
Inflation target is 4%. Monetary
policy has been tough since 2015.
4%
The CBR key rate is above inflation by
2% 5%.
Inflation rate is still vulnerable to
0% potentials shocks. 2/3 of consumer
basket is subject to FX and food
-2% prices volatility, tax and tariff.
2006
2007
2008
2009
2010
2011
2012
2013
2014
2015
2016
2017
2018
2019
2020
2021
22 Source: ACRA estimates http://www.acra-ratings.com/Low Inflation Makes Costs rigid and State and Business Less Flexible during Crisis
Unemployment during the 2008-2009 crisis was lower in countries
with higher inflation
Fixing nominal wage under high
20% inflation means decrease in labor
Greece
costs. Russian business and state
18% Average inflation for 2003-2007 > 7,5% used to freeze nominal contracts in
The difference between the maximum unemployment levels for
Average inflation for 2003-2007 < 7,5%
16%
adverse environment.
Circle diameters are proportional to
Spain inflation
14%
The lower the inflation, the smaller
the benefit in real terms. The most
12% sensitive to low inflation mode will
Latvia
2009-2013 and 2008
be those industries focused on the
10%
Portugal
domestic market where the overall
8% inflation context affects prices the
most. Those industries are
6%
Italy Slovenia infrastructure monopolies (by virtue
4% Ukraine of regulation) and the services
United States
Canada Iran, Islamic Rep. Russian Federation sector.
2% South Africa Belarus
Australia
Indonesia Norway Chile
0% Germany Qatar
Kazakhstan
Azerbaijan
-2%
0% 2% 4% 6% 8% 10% 12% 14% 16% 18%
Source: ACRA estimates
Real GDP growth slowdown in 2009-2013 versus 2008
23 http://www.acra-ratings.com/Russian financial system has absorbed oil price volatility and sanctions
140 6
URALS
ACRA FSI monthly average, rhs
120 5
100
4
80
3
60
2
40
20 1
sanctions
0 0
2008 2009 2010 2011 2012 2013 2014 2015 2016 2017 2018
ACRA FSI measures stress in the financial system of Russia (more about methodology - on the website)
24 Source: ACRA estimates http://www.acra-ratings.com/Federal budget consolidation effectively started in 2017 …
25%
20%
non oil & gas deficit
15%
10%
5%
0%
2000 2001 2002 2003 2004 2005 2006 2007 2008 2009 2010 2011 2012 2013 2014 2015 2016 2017
Non oil & gas revenues, % of GDP Oil & gas revenues, % of GDP Federal budget expenses, % of GDP
25 Source: Ministry of finance, ACRA estimates http://www.acra-ratings.com/… but it still has way to go, bringing more space to private activities
10%
5%
Aim: -0.7% GDP in 2020
0%
-1.5%
-8.0%
-5%
Non oil & gas federal budget balance, % of GDP
-10%
Federal budget balance, % of GDP
-15%
2000
2001
2002
2003
2004
2005
2006
2007
2008
2009
2010
2011
2012
2013
2014
2015
2016
2017
26 Source: Ministry of finance, ACRA estimates http://www.acra-ratings.com/Brief history of Russian fiscal rules
2004-2007 2008 2013-2014 2017-…
Non-oil&gas deficit ≤ Structural deficit ≤ Primary structural
Main feature Structural deficit ≤ 0
4.7% of GDP 1% of GDP deficit ≤ 0
Non-oil&gas + oil&gas Non-oil&gas + oil&gas
Structural Non-oil&gas + oil&gas
(oil price ≤ arbitrary (oil price ≤ average since
part of - (≤ 40 $/barr., 2%-
fixed level, starting with 2008 or 3y moving
revenues indexed every year)
20$/barr.) average if it is lower)
Arbitrary chosen
Lack of expenditure
parameter (base oil
counter-cyclicality Abnormal period used
price) is too easy to
during recession may too determine “normal”
What we change procyclically
lead to the fiscal rule long-run features leads ?
have learned Lack of coordination
easing. It could become to unsustainability of the
with exchange rate
permanent instead of rule
policy may lead to
temporary
the Dutch disease
27 Source: ACRA http://www.acra-ratings.com/Fiscal rule’s hard connection to FX market interventions makes RUB more stable
Balancing interventions
85
Oil market Internal FX market 80 2018 2017
75
70
USDRUB
65
Other internal 60
Other global markets
markets
55
Ministry of finance buys amount of currency, which equals OG tax
revenues exceeding those at 40 $/barr. (assuming USDRUB is the
50
same as at the current oil price).
20 30 40 50 60 70 80
Elasticity of FX to oil price is not 0, because there are other external
Urals, $/barr. yearly average
factors of USDRUB having non-zero correlation with oil price.
28 Source: ACRA http://www.acra-ratings.com/Sector-Specific Investment Stimuli
Stimuli 2015-2016 2017-2018 2019-2021
Domestic market growth — Healthcare, Education, Insurance, IT
Export market growth Gas production and transportation, chemical industry, transport infrastructure
Agriculture, Food, + Textiles, Electrical appliances and electronics,
Import substitution Household chemicals, Tradable services, Construction materials,
Tourism Pharmaceuticals
Cost cutting (price competition) Retail, Logistics, Financial sector, IT
Maintenance CAPEX Infrastructure (electric power, heat power, roads), repair services
Data storage,
Liabilities to the government Power generation, Oil refining, Railcar industry
oil refining
29 Source: ACRA macroeconomic forecast, Bank of Russia
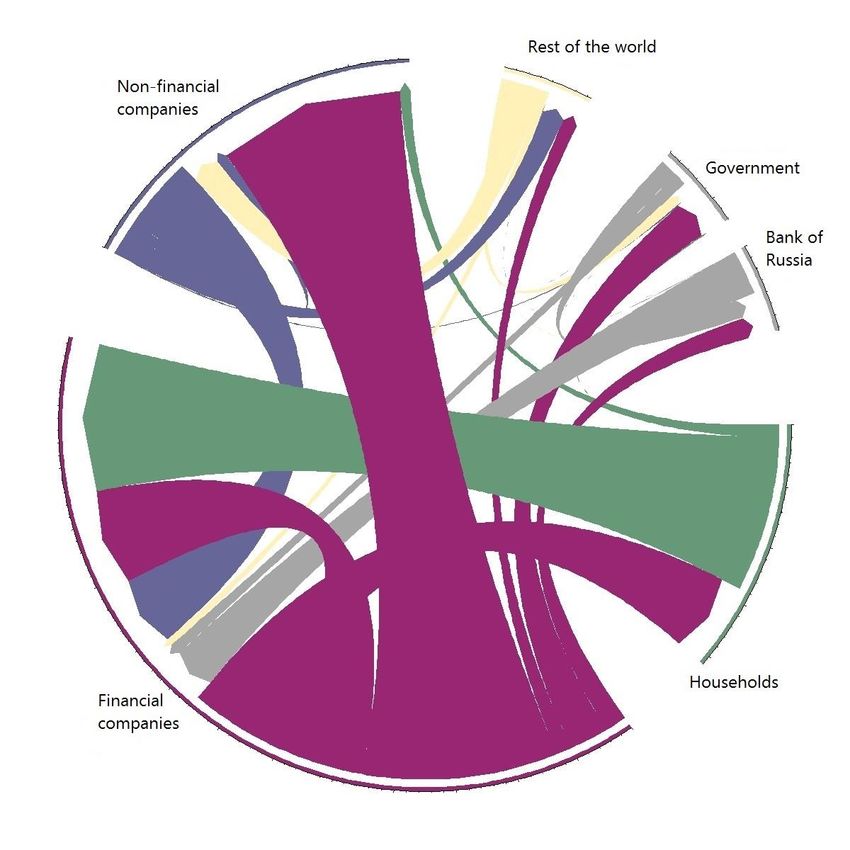
http://www.acra-ratings.com/Russian Government to Transfer Pension, Health Insurance to Business
European Union Mutual debts “from who-to-whom”
Russia
as at 1 July 2017
• Debt relations in the form of loan, borrowing, deposit or debt security (stock, not flow).
• Arrows go from lenders to borrowers (from who-to-whom). Arrow thickness is proportionate to the share
Source: ACRA
of a sector’s debt in the aggregate debt of the economy.
30 http://www.acra-ratings.com/Top 7 Integrated O&G Players*: Debt is Not a CAPEX Limiting Factor
Russian Integrated O&G Leverage** CAPEX is peaking, EBITDA margin depressed by elevated taxes
2,5 80% 72,7% 73,8%
70,2%
2,08 2,08 67,1%
70% 63,0%
1,94
2,0
1,76 60%
1,60
50%
1,5
1,27 1,27
1,13 40%
1,09
26,6%
1,0 0,88 30% 24,2% 24,4%
22,0% 21,1%
20%
10,6% 12,1%
0,5 7,4%
10% 2,4%
-3,0%
0%
0,0 2013 2014 2015 2016 9M 2017 TTM
2013 2014 2015 2016 9M 2017 TTM -10%
Total Debt/EBITDA Net Debt/EBITDA CAPEX/EBITDA FCF/Sales EBITDA/Sales
• O&G players’ leverage remains at a comfortable level and does not affect their CAPEX programs.
• The 2014 debt increase in RUB terms was purely a result of the RUB devaluation.
• Sanctions had not caused changes in investment schedules.
* Gazprom, Rosneft, LUKOIL, Surgutneftegaz, Tatneft, Russneft, NOVATEK
** Leverage calculated without data for Surgutneftegaz
Source: ACRA estimates
31 http://www.acra-ratings.com/Sanctions Threaten to Constraint Russian Oil Production in 2020s
New large field commissioning, Russia’s oil production forecast, mln tons / year
aggregated peak production, mln tons / year
47 Bownfiels 2014-2015 Greenfields New Greenfields
44,6 576,5
570,6
570 561,7
547,5 547,6 547,0
32,65 4,7 51,4 61,7
540 534,1 14,8 40,2
24,3
9,4 21,8
24
29,2
510
31,5 31,5 31,2
29,8
13,25
525 521
480
504
491 490 488 485
0
450
2009-2010 2011-2013 2014-2015 2016-2017 2018-2019 2020-2021 2015 2016 2017 2018 2019 2020 2021
After the 2011–2013 hiatus, commissioning of new greenfields ensures growth potential through 2019-2020.
However, these greenfields are the last large conventional oil deposits in the Russian mainland. New incentives will be
required after 2020 for boosting production in both mature and new high production cost fields.
32 Source: ACRA estimates http://www.acra-ratings.com/New Greenfields: Rosneft and Gazpromneft to lead
New large fields commissioning timetable
Bashneft NOVATEK
Field Company Launch year Peak production, mt/y
3% 3%
Northern Chaivo Rosneft 2014-2015 1,6
Labaganskoye Rosneft 2014-2015 1,3 Surgutneftegaz
Srednebotuobinskoye Rosneft 2014-2015 5,0 4%
Imilor LUKOIL 2014-2015 5,0
Prirazlomnoye Gazprom neft 2014-2015 5,0
Novoport Gazprom neft 2014-2015 6,5
Trebs and Titov Bashneft & LUKOIL 2014-2015 4,8 LUKOIL
Yarudeyskoye NOVATEK 2014-2015 3,5 14%
Suzun Rosneft 2016 6,0
Naulskoye Rosneft 2016 2,5
Filanovskoye LUKOIL 2016 6,0
Pyakyakhinskoye LUKOIL 2016 3,5
South Talakan Surgutneftegaz 2016 1,5
Spielman Surgutneftegaz 2016 3,0
East Messoyakha Rosneft
Gazprom neft & Rosneft 2016 5,6
Yurubcheno-Tokhomskoye Rosneft 2017 5,0 Gazprom 58%
Russkoye Rosneft 2017 6,5 neft
Kondinskoe Rosneft 2017 5,0 18%
Taas-Yuriakh (phase 2) Rosneft 2018 5,5
Kuyumba Gazprom neft & Rosneft 2018 6,5
Tagul Rosneft 2018 5,0
Lodochnoye Rosneft 2019 2,0
Erginskoe Rosneft 2019 5,0
Sevostyanova, Sanarsky,
Rosneft 2021 10,0
Lisovsky
Chonsky Gazprom neft 2021 3,25 Source: ACRA estimates
33 http://www.acra-ratings.com/Russian Gas Exports turns to Asia
Russia’s natural gas production forecast, bcm / year Russia’s natural gas exports forecast, bcm / year
600 75% 310
290
500 476 471 470 464 457 13,8
451 70%
432 419 419 270 6,9
400 37
250 30
65% 22
22
300 284 230 15
245 261 15
221 220 235 15
210 217 60%
194 210
200 15
15
190 233 236 239
225 230
55% 218 210
100
170 192 196
0 50% 150
2013 2014 2015 2016 2017 2018 2019 2020 2021 2013 2014 2015 2016 2017 2018 2019 2020 2021
Gazprom
Pipeline exports (excl. China) LNG Exports Exports to China
Independent producers
Gazprom share in Russian gas production
After a record increase in gas production in 2017, the growth rate will slow down and the share growth of independent
producers will resume. Gas production in Russia will grow by 15% (+96 bcm) in 2021 compared to 2016.
The growth in exports after 2017 will mainly be ensured by the launch of LNG projects (Yamal LNG and Third Phase
Sakhalin-2), as well as the beginning of exports to China starting in 2020 via the Power of Siberia.
34 Source: ACRA estimates http://www.acra-ratings.com/Russian Power Industry: Incentives for Modernization
Power plants capacity in Russia
Renewables 1/2 of thermal power plants should
0% be phased out or modernized in
Nuclear the next decade
12%
Russian power market is among the
world largest liberalized electricity
Hydro market in the world.
20%
Russian government is designing new
incentives to raise $17 bln of
Thermal
investments in TPP modernization.
68%
Renewable energy support may not be
extended in 2020s. Renewables lose
competition to cheap conventional
resources (gas).
Source: ACRA estimates
35 http://www.acra-ratings.com/Share of Debt Vulnerable to Sanctions Dropped to 13%
Estimated maximum share of debt assets and liabilities
susceptible to stricter financial sanctions The estimated maximum share of debts
25% due from residents and susceptible to
forced repayment is 13.2%. In the
NFCs Government + worst-case scenario, the liquidity
Bank of Russia constraints may affect 22.4% of debt
20%
assets.
Share of liabilities
15% Sector For non-financial companies (NFCs), the
average role of the rest of the world is
important in terms of both share (46%
10% for assets and 35% for liabilities) and
amount
Financial companies
5% But non-financials are more resilient to
01.01.2014
stricter refinancing conditions, as about
01.07.2017
40% of scheduled repayments fall on
0%
the intragroup debt, which is easy to
0% 10% 20% 30% 40% 50% 60% refinance.
Share of assets
36 Source: ACRA estimates http://www.acra-ratings.com/Internal loans are more than a half of foreign currency debt
Mutual debts “from who-to-whom”
RUB as at 1 July 2017
Other currencies
• Debt relations in the form of loan, borrowing, deposit or debt security (stock, not flow).
• Arrows go from lenders to borrowers (from who-to-whom). Arrow thickness is proportionate to the share
Source: ACRA
of a sector’s debt in the aggregate debt of the economy.
37 http://www.acra-ratings.com/Credit quality has persistent sectoral component
Share of foreign
Bank credit overdue, all currencies currency loans
is higher than Credit risk Industries
Historic NPL
the economy levels
average
Overdue 1. Credit risk is • Utilities
14%
level up Construction materials
way below • Transport infrastructure < 1,9%
Trade average • Telecommunications
12%
Agriculture • Oil & Gas and Chemicals
2. Credit risk is
• Metals 1,9% - 4,6%
below average
10% • Power generation
Food
Services • Defense sector
01.03.2018
8% Construction • Machinery
Wood (1.03.2018 - 19.6% !) • Mining
• Transportation
Machinery 3. Credit risk level • Retail trade
Mining (non-energy) 4,6% - 5,7%
6% is neutral • Agribusiness
Private loans • Packaged food and
Metals beverages
Paper
• Healthcare
4% • IT & Media
Transport and
Chemistry
Other communication
Transport • Real estate
Energy 4. Credit risk is
2% machinery
Processing of raw
Overdue above average
•
•
Paper and forest products
Oilfield services
5,7% – 6,2%
materials Mining (energy) level down
0% 5. Credit risk is • Infrastructure construction
0% 2% 4% 6% 8% 10% 12% way above • Residential construction >6,2%
average • Wholesale trade
01.03.2017
38 Source: ACRA, Bank of Russia http://www.acra-ratings.com/Credit quality pricing in Russia
% 16
Effective YTM of corporate bonds
14
12
10
8
6
4
2
higher than AA-(RU) higher than BBB(RU) higher than B-(RU)
0
01.2016
03.2016
04.2016
05.2016
06.2016
07.2016
08.2016
09.2016
11.2016
12.2016
01.2017
02.2017
03.2017
04.2017
05.2017
06.2017
07.2017
08.2017
09.2017
10.2017
11.2017
12.2017
01.2018
02.2016
10.2016
39 Source: Cbonds http://www.acra-ratings.ru/Russia’s specific economic risks for 2018
Growth lower than Inflation lower than
Sanctions
expected aimed
Sharp growth of
Banking assets
quality, low NIM ? protectionist
measures in global
trade
Non-obvious links
between traditional
OPEC+ agreement US financial markets
markets and
cryptocurrencies etc.
40 Source: ACRA http://www.acra-ratings.com/Russian Financials At A Crossroads
Analytical Credit Rating Agency (ACRA)
Kirill Lukashuk
Senior Director, Head of financial institutions ratings
http://www.acra-ratings.com/Ratings & analytical coverage
Banks & Leasing
Insurers
Funds & AMs
42 http://www.acra-ratings.com/ACRA’s ratings cover 80% of Russian banking system
State-owned banks and FI Private banks Foreign-owned banks
Sberbank AAA(RU) / Stable JSC “ALFA-BANK” AA(RU) / Stable AO Toyota Bank AAA(RU) / Stable
Bank GPB (JSC) AA(RU) / Positive
Vnesheconombank AAA(RU) / Stable Bank RRDB (JSC) AA-(RU) / Stable COMMERZBANK (EURASIJA)
AAA(RU) / Stable
AO
JSC "AHML" AAA(RU) / Stable BANK "ROSSIYA" A+(RU) / Stable Natixis Bank JSC AAA(RU) / Stable
PJSC Sovcombank A(RU) / Stable Credit Agricole CIB AO AAA(RU) / Stable
Bank “National Clearing AAA(RU) / Stable Tinkoff Bank A(RU) / Stable
ING BANK (EURASIA) JSC AAA(RU) / Stable
Centre” (JSC)
JSC Russian Agricultural AA(RU) / Stable CREDIT BANK OF MOSCOW A(RU) / Stable
AO Citibank AAA(RU) / Stable
Bank
RNCB A(RU) / Stable The joint-stock Bank A-(RU) / Stable
JSC Nordea Bank AAA(RU) / Stable
«ROSEVROBANK»
«Bank Otkritie Financial BBB-(RU) / Under revision «Bank «Saint-Petersburg» PJSC A-(RU) / Stable
AO UniCredit Bank AAA(RU) / Stable
Corporation» (PJSC) (positive)
BANK “ROSSIYSKY CAPITAL” BBB+(RU) / Positive Sviaz-Bank BBB+(RU) / Negative
AO Raiffeisenbank AAA(RU) / Stable
(PJSC)
LOCKO-Bank BBB+(RU) / Stable DeltaCredit Bank JSC AAA(RU) / Stable
SDM-Bank PJSC BBB+(RU) / Stable
PJSC ROSBANK AAA(RU) / Stable
Expobank LLC BBB+(RU) / Stable Limited Liability Company
AAA(RU) / Stable
Rusfinance Bank
MCIB Bank LLC BBB(RU) / Stable
JSC «RN Bank» AA(RU) / Stable
CB "Renaissance Credit" (LLC) BBB-(RU) / Stable
Credit Europe Bank Ltd. BBB(RU) / Stable
«AVANGARD» JSB BB+(RU) / Stable
CB "Kuban Credit" Ltd BB+(RU) / Stable
LLC CBED «THE BANK OF KAZAN» BB-(RU) / Stable
43 http://www.acra-ratings.com/Ratings & analytical coverage
Banks & Leasing
Insurers
Funds & AMs
44 http://www.acra-ratings.com/Fragile inputs….
Post-recessionary economic environment suggests growth opportunities to Russian banks…
GDP growth, albeit sluggish (1.5%-2%), will likely continue in 2018
Rebounding private sector consumption will support mortgage/auto/unsecured retail lending
Trade, housing construction and infrastructure sectors will also require new lending
Therefore, banking assets will gradually grow
…But significant problem loans, increasing regulatory pressures and “new normal” in interest rates
prevail
Problem loan levels are at highest levels since 2010 and underprovisioned
ACRA views inflation at around 4% beyond 2017 meaning lower interest rates, shrinking NIM and contained net
income levels in the long term
The CBR insists on higher provisioning charges, introduces additional regulation and continues “to heal” the banking
system
45 http://www.acra-ratings.com/…..major strategic threats
NIM pressure Asset quality Competition
• We expect interest rates • Slowly recovering • Constantly increasing
and inflation to be operational environment power of state-owned and
historically low in next 18- with limited growth state-related banks
36 months potential • Low demand from
• On the back of rates trend • Significant share of corporates due to poor
and ALM structure, we problem loans (15%) performing economy and
assume NIM to drop up to • Low provision coverage strategic uncertainties
100bp (55% system-wide) • Tangible risks of troubled
• Only small number of • Material shift in CBR’s banks privatization
banks are well prepared tolerance towards delaying (5-7 years vs 3 as
and started to actively impairment recognition publicly stated)
invest in fee-related
strategy/products 2-3
years ago
46 http://www.acra-ratings.com/Overall Banking Assets Will Increase
Dynamics of Russian Bank Assets
100% 103% 99%
96% 93% 93% 95%
81%
41% 40% 42% 44%
38% 36% 38%
32%
14% 15% 13% 13% 14% 14% 15% 16%
2013 2014 2015 2016 2017F 2018F 2019F 2020F
Bank assets / GDP Corporate lending / GDP Retail lending / GDP
Despite some recovery in 2017, growth in the banking system assets will be subdued – at around 5%
In 2018–2020, growth in assets will be 5-6% on average, which will support anticipated nominal GDP growth (around 5%
on average)
Nevertheless, the CBR’s tight monetary policy and low-inflationary environment will constrain growth in the banking
assets
47 http://www.acra-ratings.com/Competition dynamics
State-owned banks, market share State-owned banks in TOP-10 banks
75% 95%
70% 90%
70% 90%
65% 63% 85%
82% 82%
61% 81%
60%
60% 80%
55% 75%
2014 2015 2016 2017 2014 2015 2016 2017
2014 2015 2016 2017 2014 2015 2016 2017
The government’s stake in the entire banking system has risen. The above figure has become the highest
among all industries in the Russian market (the government owns 66% of the oil&gas sector).
Competition between government-owned banks for funding sources and borrowers would intensify ever
more, and the reliability factor would become secondary for the competition.
48 http://www.acra-ratings.ru/Competition: State plays the Game
The government’s stake in the entire banking system has risen to 70% by early 2018 vs 63% as at early
2017.
In the TOP 5 there are no private banks, in the TOP 10 there are three (including one foreign sub)
Risks of delaying privatization of failed players and coming of new ones
Active development of the industry-linked state owned banks (Rosselkhozbank, Roskap, PSB, RNCB)
Risks:
• Imperfect management of investments
• Regulatory forbearance
• “directed lending” practices, development of politically important sectors
• State-to-state market model (state corporates - state banks)
• Increased amount of contingent liabilities of the budget and the Bank of Russia in terms of
banking sector support
49 http://www.acra-ratings.ru/Problem Loans Are at a Highest Level Since 2010
12-15%
12
9,5 9,8 Problem loans (ACRA)
10 9,5
8,2 8,3
8 NPL90+ (ACRA)
6,6 6,7 6,7 6,7 6,9
6,2 6 6
5,7
6 Impaired loans (CBR)
4,8 4,5 4,7
4,2
3,8 5,7
4 1+ overdue loans (CBR)
2,5
2
01.01.2009 01.01.2010 01.01.2011 01.01.2012 01.01.2013 01.01.2014 01.01.2015 01.01.2016 01.01.2017 01.07.2017
Problem loan levels in Russian banking system are at around 12–15%
The share of problem loans at the banks’ balance sheets has been growing since 2013
Officially recognized problem loans are highest for the last ten years
Major risks are related to restructured loans and borrowers with weak creditworthiness
50 http://www.acra-ratings.ru/Rated Banks Snapshot
50%
Problem loans vs NPL90+
44%
45%
39%
40%
35% 30%
30%
30%
24%
25% 22%
20%
20% 18% 17%
15% 15% 14%
15% 13%
11% 10% 9%
10% 15% 8%
13% 11% 4%4%
5% 10% 3% 2%1%
8% 8% 8% 8% 7%
0% 5% 6% 6% 4% 4%
2% 2% 4% 4% 2%1% 3% 1%
1% 2% 2% 0%
There are banks (still with a license from CBR), more than a quarter of the assets of which are problem/impaired
The gap between NPLs and problem loans increases with growth problem loans share
Information about the real impairment level in most cases, do not exist in the audited IFRS (Otkritie, B&N – EY)
51 http://www.acra-ratings.ru/Problem loans coverage is not sufficient
Coverage of bad loans by provisions Poor provision coverage of bad loans is
the key risk of creditworthiness decline
A little over half of the bad loans are
provisioned (51.7%)
An one-off recognition of all problem
loans full impairment will lead to a
decrease of capital adequacy levels to
regulatory thresholds
More conservative position of the Bank of
Russia regarding bad loans provisioning
ratio will represent a challenge for credit
institutions in the next 12-18 months
In specific cases it might have an adverse
effect on credit ratings and their outlook
52 http://www.acra-ratings.com/Asset quality indicators: state and private on par
State-owned Privately-owned Subsidiaries of
banks banks foreign banks
Problem loans 11,1% 15,6% 9,5%
NPL90+ 5,5% 6% 6,2%
High-risk industries lending
107,3% 102,8% 30,5%
(% of Tier-1 capital)
Related-party lending
30,7% 27% 1,1%
(% of Tier-1 capital)
Non-core assets
17,8% 10% 0%
(% of Tier-1 capital)
Top-10 borrowers concentration
148,3% 158,6% 174,4%
(% of capital)
53 http://www.acra-ratings.ru/Increasing Risk Appetite Will Contain Capital Adequacy Growth
15% 6,5
13,9%
13,7%
14%
13,3%
6
Problem loan levels will stabilize over the
13%
12,4% 5,5 next 12-18 months, largely thanks to
11,8% 11,7% 11,6%
increasing new lending and improving
12% 11,5% 5
11,6%
11,0%
credit quality of corporate borrowers in
11% 11,4% 4,5 some sectors of economy
10,1%
In case of more aggressive approach to
10% 4
9,20%
9% 3,5 risk appetite, capital adequacy will
stagnate vs. its current level of 11.5%
8% 3
7%
3,2 3,2 3,8 3,6 4,6 4,2 5,3 4,8 6,0 5,3
2,5 Under more “aggressive” scenario, loss
2016 2017 2018 2019 2020
absorption buffer will advance to RUB 5.3
Absorbtion capacity, trln trillion in nominal terms; however, it will
Absorbtion capacity - aggressive scenario, trln
still sustain impairment of assets by 5.9%
Tier-1 (IFRS), %
Tier-1 (IFRS) - aggressive scenario, %
maximum
Н1.2 (CBR), %
54 http://www.acra-ratings.com/NIM Is Recovering, But Will Not Exceed Pre-Crisis Levels
6%
5,6%
5,4%
Significant market volatility in 2014 with further
6% 5,3% decline in loans interest rates outpacing deposits
4,9%
5,0% resulted in weak NIM in 2015
5%
4,6%
4,5% 4,5% NIM growth in 2016 reflected both stabilization of
5%
4,2% loan/deposit interest rates and rebalancing of
interest-earning assets towards higher-income
4% 3,8% instruments
3,6%
4% 3,4%
3,3% 3,3% NIM stabilization (4.5%) is expected in 2017.
3%
Sberbank will continue to outstrip other banks
In 2018, NIM will likely decline to levels posted in
3%
2016
2012 2013 2014 2015 2016 2017 2018 (F)
NIM (IFRS) NIM (IFRS, without Sberbank)
55 http://www.acra-ratings.com/New Normal: Low Inflation, Low Interest Rates, Subdued NIM
20% 17%
Inflation is at historically lowest levels
15% 12,9%
10%
(around 2.5% in October 2017). ACRA
10% 8% 7,25% long-term scenario envisages around 4%,
11,4% 11%
5,5% which is the CBR’s target
5%
6,5%
5,4%
3,2%
4,6% Key rate will be heading towards 7% over
0%
next 12-18 months
2013 2014 2015 2016 2017 (F) 2018 (F)
Inflation CBR Key Rate
20% 18,3%
Retail Deposit Rate (Net Income Will Not Return To The Past
2,0% Following financial crisis, Russian banking
1,7% system net income declined to almost zero
1,5% in 2014-15
1,5%
1,3% 1,2%
Recovery in 2016 was achieved largely
1,0% 1,0% 1,0%
1,0% thanks to Sberbank, while the rest of the
banking system was only marginally
0,5% 0,5% 0,5% profitable
0,5% 0,4%
0,2% Net income will not return to the past. We
0,0% expect rather low profitability metrics with
0,0%
ROA of around 1% in total and around
2012 2013 2014 2015 2016 2017 2018 (F)
0.5% excluding Sberbank
-0,5% -0,4%
Going forward, Russian banks will face
increasing competition for non-interest
-1,0% income sources. Adjustments in operating
ROA ROA without Sberbank expenses will also matter
57 http://www.acra-ratings.com/Regulatory Innovations
Proportional regulatory regime to be introduced since 2018. Small banks are heavily impacted.
The Central Bank will introduce two types of banking licenses:
General license (minimum capital requirement is RUB1 bln). Such banks will have to comply with heightened capital
requirements, Basel III implementation and full-fledged CBR’s supervision.
Basic license (minimum capital requirement is RUB300 mln). Banks with a basic licenses are largely for SME lending in
regions; banned from operations with foreign counterparties (excepting nostro accounts). The CBR exercises simplified
supervision approach.
New legislation on financial rehabilitation of failed banks. The CBR introduces two important financial tools:
“Bail-in” mechanism
The CBR’s Banking Sector Consolidation Fund being responsible for support of troubled banks. The Fund will absorb
toxic assets and recapitalize failed banks (transformation from lending mechanism to equity financing)
ACRA views both instruments positively, albeit their effectiveness to be tested
58 http://www.acra-ratings.com/New mechanism of financial rehabilitation in Russia
Two important financial tools of the CBR
Appropriation Buyout of receivables,
Decision of shares and other
of funds (₽) assets, issuing loans,
BD of CBR
to FBSC allocating deposits
Fund of Banking
“Bail-in”
Sector Consolidation
mechanism (FBSC)
ACRA views both instruments
Shares, loan receivables, other assets
Bank
positively, albeit their of
effectiveness to be tested BSCF Asset Bank
Russia
(CBR) Shares, loan
management
main risks receivables, other company
higher assets (100% subsidiary
further
motivation of
increasing of of CBR)
depositors to
statutory share
allocate funds in
in Russian
state-owned
banking sector
banks After financial rehabilitation shares and assets can be
sold by CBR at public auction
Decrease of competition at the sector New
owner
59 Source: ACRA, Bank of RussiaOtkritie & B&N Bank cases Key implications for investors: size does not matter junior creditors face material risks audited statements is only a well-drawn picture bank goes to default when regulator wants it is not enough to be overliquid to survive 60 http://www.acra-ratings.ru/
Russian leasing market could break the record of 2012-2013
New business volume* dynamics
900 65% 850 70%
770 783 60%
800 741 742
680 50%
700
36% 40%
600 545
30%
500
15% 20%
400
4% 2% 10%
300
0%
200 -13%
-10%
-20%
100 -20%
0 -30%
2011 2012 2013 2014 2015 2016 2017
New leasing volume, RUB bln Growth rate, %
Key market drivers
vehicle lease (+30% of growth in new leasing volume)
aircraft lease (+40%)
rolling stock lease (+70%) Source: ACRA estimates
*volume of new equipment granted by lessors
61 http://www.acra-ratings.ru/Leasing market reform (2018-2021) What’s new for leasing companies: new status for leasing companies – non-credit financial institutions leasing could not be combined with other financial activities capital requirements (min 20 and 50 mln RUB since 2021, depends on lessor’s assets volume) move to IFRS market regulation through self-regulatory organizations new industry standards 62 http://www.acra-ratings.ru/
Ratings & analytical coverage

       Banks & Leasing

       Insurers

     Funds & AMs

63                               http://www.acra-ratings.com/
Insurance market growth rates to outpace GDP in the medium term
Low penetration of insurance services in Russia will provide
GDP, Insurance market growth rates for high growth rates in the sector
25%
22%
21% Annual market growth expected at 11% within the 2017-
20%
2021 horizon
15%
15% Population aging and monetary policy to support rapid
11% 12%
growth of life insurance. In 2016, the segment posted a
10%
8%
9%
8% phenomenal growth of 66% y-o-y, with the main contributor
7% 7%
being investment life insurance fostered in turn by banks’
5% 4%
active involvement in insurance policy sales and by lower
2%
deposit interest rates
0%
2012 2013 2014 2015 2016 2017-2021
Insurance market, total Non Life GDP nominal Car sales growth to push motor premiums up
64 http://www.acra-ratings.ru/OMTPL and investment insurance risks threaten growth stability
At the same time, the insurance market is facing Life Segment
increasing systemic risks that may undermine expected 250
216
growth rates
200
In the short term, the most pronounced risks are
150
connected with the OMTPL crisis. This segment has so far 130
109
failed to curb the loss-making trend for insurers. 100 85
In the next two to three years, the sector might confront 53
50
the risk of policyholders growing disappointed by
investment life insurance. This may well run the booming 0
2012 2013 2014 2015 2016
life insurance segment into a real shock, should Life total premium, RUR bln.
investment insurance policies bring about weak returns.
65 http://www.acra-ratings.ru/Insurance sector’s RoE is among the highest in the Russian economy
Insurers’ return on equity (RoE) before tax was 24% in 2016
27,7
and 28% in 2015, while the economy average was 13% and
24,1
11%.
19,8
High sector returns are supported by growth in life insurance
15,9 and high effective interest rates that generate income from
14,4
investments. Net loss ratio in the non-life segment declined
11,2 10,9
down to 53% from 61% in 2014–2015
On average, major insurers are more profitable than minor
3,3
companies. This boosts M&A transactions, as companies
strive to increase business efficiency by way of consolidation
2013 2014 2015 2016
Insurance sector ROE, % Banking sector ROE, % ACRA expects insurers’ RoE to decline in the upcoming years,
but RoE is expected to be high enough, for the sector to
remain appealing to investors.
66 http://www.acra-ratings.ru/Ratings & analytical coverage
Banks & Leasing
Insurers
Funds & AMs
67 http://www.acra-ratings.com/Asset management companies
The Russian market of collective investments
6 5,71
5,09
5
4,28
4 3,49
3
2,41
2,10
2 1,49
1,05 0,92 0,98 0,89 0,92 0,92 1,04
1 0,76 0,77
0
2014 2015 2016 2017, 2q
Total market NSPF' pension savings NSPF' pension reserves Closed-end mutual investment funds
General trend is the market growth. The growth basis – NSPF’ pension savings
The market volume of closed-end mutual investments funds and NSPF’ pension reserves – stagnation at 1 trillion and
800-900 billion rubles respectively
ACRA sees some potential in open-ended mutual investment funds and individual asset management because of
lower interest rates on banks deposits
Other assets of Russian collective investments market have barely changed in 2 years
68 http://www.acra-ratings.ru/Non-state pension funds (1)
40
Private pension provision participants overall decrease in
34,4
the number
29,8
30 Distrust in Russian Federation’ pension system due to
26,3
frequent legislative changes and weak financial literacy
22,1
Often the low quality of private pension provision assets
20
The use of “administrative leverage”, forcing a person to
engage in private pension provision
10 The insured persons has a trend to increase the number
6,4 5,8 5,3 5,6
The transfer of insured persons funds from Pension Fund of
Russia to NSPF because of the transition from accumulative
0
2014 2015 2016 2017, 2q pension component to individual pension capital
Insured persons number (pens. savings)
Private pension provision participants number (pens. reserves)
Units: millions of people
69 http://www.acra-ratings.ru/Non-state pension funds (2)
The overall growth of the Russian pension system: from 3.9 6
trillion rubles in 2014 to 5.4 trillion rubles in second quarter
5
1,2
of 2017 1,1
1,0
4
The NSPF’ pension savings growth rate is ahead of the same 0,9
of Pension fund of Russia (PFR): an average of 8.6% in NSPF 3
1,7
2,1 2,4
revised -0.6% in PFR 1,1
2
In 2016 there was a significant moment for entire Russian
1 1,9 2,1 2,0 1,8
pension industry – the total volume of NSPF’ pension savings
ahead the PFR’ pensions savings 0
2014 2015 2016 2017, 2q
The NSPF’ pension reserves grow steadily by an average of NSPF' pension reserves
NSPF' pension savings
2.3% in the quarter Pension Fund of Russia's pension savings
Units: trillions of rubles
70 http://www.acra-ratings.ru/Contact Details
Russian website: www.acra-ratings.ru
English website: www.acra-ratings.com
АКРА Рейтинговое агентство
General Contacts: On Cooperation Issues:
info@acra-ratings.ru Managing Director for Business Development
+7 495 139 04 80 Alexey Bogomolov
75, Sadovnicheskaya emb., alexey.bogomolov@acra-ratings.ru
Moscow, 115035, Russia +7 495 139 04 99
Regulatory Affairs & Compliance: Credit Ratings Methodology:
Manager Senior Director
Anastasia Morgunova Kirill Lukashuk
anastasia.morgunova@acra-ratings.ru kirill.lukashuk@acra-ratings.ru
+7 495 139 04 80, ext. 151 +7 495 139 04 82
71 http://www.acra-ratings.com/Disclaimer (С) 2018 Analytical Credit Rating Agency (Joint-Stock Company), ACRA (JSC) 75, Sadovnicheskaya embankment, Moscow, Russia www.acra-ratings.com The Analytical Credit Rating Agency (ACRA) was founded in 2015, with its 27 shareholders representing major Russian corporate and financial institutions and its authorized capital exceeding RUB 3 bln. ACRA’s main objective is to provide the Russian financial market with high-quality rating products. Methodologies and internal documents of ACRA are developed in compliance with the Russian legislation and with regard to global rating industry best practices. The provided information, including, without limitation, credit and non-credit ratings, rating assessment factors, detailed credit analysis results, methodologies, models, forecasts, analytical reviews and materials, as well as other information placed on the ACRA website (further referred to as Information), coupled with the ACRA website software and other applications, are intended for information purposes only. Information must not be modified, reproduced or distributed by any means, in any way or form, either in whole, or in part, in marketing materials, as part of public relations events, in news bulletins, in commercial materials or reports without a prior written consent from, and reference to, ACRA. Any use of Information in violation of these requirements or the law is prohibited. ACRA credit ratings reflect ACRA’s opinion about the ability of a rated entity to meet its financial obligations or about the credit risk of individual financial obligations and instruments of a rated entity at the time of publication of the relevant Information. Non-credit ratings reflect ACRA’s opinion about certain non-credit risks assumed by interested parties interacting with a rated entity. The assigned credit and non-credit ratings reflect all material information pertaining to a rated entity and known by ACRA (including the information received from third parties), the quality and reliability of which ACRA considers appropriate. ACRA shall not be responsible for the accuracy of information provided by clients or relevant third parties. ACRA does not audit or otherwise verify the provided data and shall not be held responsible for their accuracy and completeness. ACRA conducts rating analysis of information provided by customers using its own methodologies, with the texts thereof available on ACRA’s website – www.acra- ratings.com/criteria. The only source that reflects the latest Information, including the one about credit and non-credit ratings assigned by ACRA, is ACRA’s official website – www.acra-ratings.com. Information is provided on an "as is" basis. Information shall be considered by users exclusively as ACRA’s statement of opinion and must not be regarded as advice, recommendation or suggestion to buy, hold or sell securities or other financial instruments of any kind, nor shall it be viewed as an offer or advertisement. Neither ACRA, nor its employees and persons affiliated with ACRA (further referred to as the ACRA Parties) provide any direct or implied guarantee expressed in any form or by any means regarding the accuracy, timeliness, completeness or applicability of Information for making investment and other decisions. ACRA does not act as a fiduciary, auditor, investment or financial advisor. Information must be regarded solely as one of the factors affecting an investment decision or any other business decision made by any person who uses ACRA’s information. It is essential that each of such persons conduct their own research and evaluation of a financial market participant, as well as an issuer and its debt obligations that may be regarded as an object of purchase, sale or possession. Users of Information shall make decisions on their own, involving their own independent advisors, if they deem it necessary. ACRA Parties shall not be responsible for any action taken by users based on Information provided by ACRA. ACRA Parties shall under no circumstances be responsible for any direct, indirect or consequential damages or losses resulting from interpretations, conclusions, recommendations and other actions taken by third parties and directly or indirectly connected with such information. Information provided by ACRA is valid only as of the date of preparation and publication of materials and may be amended by ACRA in the future. ACRA shall not be obliged to update, modify or supplement Information or inform anyone about such actions, unless the latter was recorded separately in a written agreement or is required by the legislation of the Russian Federation. ACRA does not provide advisory services. ACRA may provide additional services, if this does not create a conflict of interest with rating activities. ACRA and its employees take all reasonable measures to protect all confidential and/or material non-public information in their possession from fraud, theft, unlawful use or inadvertent disclosure. ACRA provides protection of confidential information obtained in the course of its business activities as required by the legislation of the Russian Federation. 72 http://www.acra-ratings.com/
You can also read