Strategy & Results Update - Q1FY21 - L&T Finance
←
→
Page content transcription
If your browser does not render page correctly, please read the page content below

Strategy & Results Update – Q1FY21

1
Disclaimer

    The information in this presentation is provided by L&T Finance Holdings Limited (the “Company”) for information purpose only. This presentation or any information therein may not be used, reproduced,
    copied, photocopied, duplicated or otherwise reproduced in any form or by any means; or re-circulated, redistributed, passed on, published in any media, website or otherwise disseminated, to any other
    person, in any form or manner.
    This presentation does not constitute an offer or invitation or inducement to purchase or sale or to subscribe for, any securities of the Company, nor shall it or any part of it or the fact of its distribution form
    the basis of, or be relied on in connection with, any contract or commitment therefor. This presentation is for general information purposes only, without regard to any specific objectives, financial situations
    or informational needs of any particular person.
    No representation, warranty, guarantee or undertaking, express or implied, is or will be made or any assurance given as to, and no reliance should be placed on, the fairness, accuracy, completeness or
    correctness of any information, estimates, projections or opinions contained herein. Potential investors must make their own assessment of the relevance, accuracy and adequacy of the information
    contained in this presentation and must make such independent investigation as they may consider necessary or appropriate for such purpose. The statements contained in this presentation speak only as
    at the date as of which they are made, and the Company expressly disclaims any obligation or undertaking to supplement, amend or disseminate any updates or revisions to any statements contained
    herein to reflect any change in events, conditions or circumstances on which any such statements are based. Neither the Company nor any of its respective affiliates, its board of directors, its management,
    advisers or representatives, or any other persons that may participate in any offering of securities of the Company, shall have any responsibility or liability whatsoever (in negligence or otherwise) for any
    loss howsoever arising from any use of this presentation or its contents or otherwise arising in connection with this presentation.
    The Company may alter, modify or otherwise change in any manner the contents of this presentation, without obligation to notify any person of such revision or changes. Certain statements made in this
    presentation may be “forward looking statements” for purposes of laws and regulations of India and other than India. These statements include descriptions regarding the intent, belief or current
    expectations of the Company or its directors and officers with respect to the results of operations and financial condition, general business plans and strategy, the industry in which the Company operates
    and the general, business, competitive and regulatory environment of the Company. These statements can be recognized by the use of words such as “expects,” “plans,” “will,” “estimates,” “projects,” or
    other words of similar meaning. Such forward-looking statements are not guarantees of future performance and involve risks and uncertainties, and actual results may differ from those in such forward-
    looking statements as a result of various factors and assumptions, including future changes or developments in the Company’s business, its competitive environment, information technology and political,
    economic, legal, regulatory, environmental and social conditions in India, which the Company believes to be reasonable in light of its operating experience in recent years. The Company does not undertake
    to revise any forward-looking statement that may be made from time to time by or on behalf of the Company.
    The distribution of this presentation in certain jurisdictions may be restricted by law and persons in whose possession this presentation comes should inform themselves about, and observe, any such
    restrictions.
    Disclaimer clause of RBI: The Company has a valid certificate of registration dated September 11, 2013 issued by the RBI under section 45 IA of the RBI Act. However, the RBI does not accept any
    responsibility or guarantee about the present position as to the financial soundness of the Company, or for the correctness of any of the statements or representations made or opinions expressed by the
    Company, and for repayment of deposits/ discharge of liabilities by the Company.
    Disclaimer clause of NHB: L&T Housing Finance Limited (“LTHF”), a subsidiary of the Company has a valid certificate of registration dated December 14, 2012 issued by the National Housing Bank (“NHB”)
    under section 29A of the National Housing Bank Act, 1987. However, the NHB does not accept any responsibility or guarantee about the present position as to the financial soundness of LTHF, or for the
    correctness of any of the statements or representations made or opinions expressed by LTHF, and for repayment of liabilities by LTHF.
    The financial figures, information, data and ratios (audited and unaudited) other than consolidated PAT, provided in this presentation are management representation based on internal financial information
    system of the Company. These financial figures are based on restatement of certain line items in the consolidated financial statements of the Company and describe the manner in which the management
    of the Company monitors the financial performance of the Company. There is a possibility that these financial results for the current and previous periods may require adjustments due to changes in
    financial reporting requirements arising from new standards, modifications to the existing standards, guidelines issued by the Ministry of Corporate Affairs and RBI.

    Risk Factors and Disclaimers pertaining to L&T Mutual Fund: Mutual Fund investments are subject to market risks, read all scheme related documents carefully.

2
LTFH 2.0
     Our Commitment

    TO BE A COMPANY WHICH:
      Sustainably delivers top quartile RoE with strengthened risk profile
      Has a clear Right to Win in each of the businesses
       Uses Data Intelligence as a key to unlock RoE
       Has a culture of “Results” not “Reasons”
      Stable and sustainable organisation built on the foundation of “Assurance”
3
Agenda

             A     Q1 in perspective

             B   What worked for LTFH

             C     Q1 P&L explained

4
Q1FY21 Synopsis                                                                                    (1/3)

        Progressive business pickup                 Improved Asset Quality                   Strong Balance Sheet

         Strong recovery in collections                                               Inspite of strong collections recovery
                                                       GS3 reduced from
       especially in Rural. July collection                                           and improved asset quality; prudently
                                                      5.72% to 5.24% YoY
             trend better than June                                                       created additional provisions

      Rural recovery faster than expected
         led by Farm, financed 10,000+                                                 Created additional provisions of Rs
                                                         NS3 reduced from
      tractors in June (19% YoY increase)                                                     577 Cr. in Q1 FY21:
                                                     2.48% to 1.71% YoY (PCR
                                                                                      • Macro prudential       Rs.300 Cr
                                                   increased from 58% to 69%)
         Uptick in IDF disbursement and                                               • Covid 19               Rs 277 Cr
        focus on tranche disbursement in
             project finance portfolio                                                    With this, carrying additional
                                                 Strong focus on collection led to
                                                                                       provisions of Rs. 1,244 Cr (1.39%)
      Disbursements expected to increase       reduction in debtors and GS3 by ~Rs
                                                                                      on standard book - well prepared for
               in Rural portfolio                 1,300 Cr and ~Rs 100 Cr QoQ
                                                                                           any economic uncertainty

                               LTFH strongly positioned and ready to benefit from Rural recovery

5
Q1FY21 Synopsis                                                                                       (2/3)

         April 2020 - Nation wide lockdown coupled with RBI moratorium

        • Disbursement and collection activities at a standstill – complete closure of branches, MCs and point of sales

        • Implemented portfolio action plans and tightened risk management framework

        • Focused on moving collections to digital and electronic modes

        • Shored up structural liquidity to ensure 3-month repayments even with Nil collections

         May 2020 – Graded relaxation with commencement of operation in Green and Orange zones

        • Continuous calibration of on-ground business strategy, amidst frequent changes in lockdown rules

        • Focused on re-connecting with customers & driving collections despite lower manpower

        • Improvement in collection volumes for Rural and Retail housing businesses

        • Re-initiated Farm and Two wheeler disbursements in select geographies with tightened credit norms

        • Continued maintenance of higher than normal structural liquidity

6
Q1FY21 Synopsis                                                                                         (3/3)

          June 2020 – Re-establishing on-ground operations

         • Significant uptick in collection volumes owing to on-field efforts and increased capacity of call centers
            o Drop in retail customers under moratorium in Jun’20 over May’20
            o Sharp reduction in debtors (~Rs. 1,300 Cr QoQ) and GS3 (~Rs 100 Cr) owing to concerted collection efforts

         • Reinitiated retail disbursement with tightened credit norms & continued tranche disbursements in Project finance
            o Maintained leadership in Farm Equipment business, financing over 10,000 tractors (19% YoY increase)

         • Continued to maintain enhanced structural liquidity at Rs 9,082 Cr

         • Created Rs. 300 Cr of macro provisions, in addition to Covid-19 provisions (Rs. 277 Cr) to protect against
           uncertain environment post Moratorium

          Q2FY21 and beyond – Strong recovery seen in Rural India, poised favorably to gain from the same

         • Continued collection momentum in Retail portfolio with ML collections till 15 th July already higher than June nos

         • Disbursements momentum expected to pick up especially in Rural portfolio

         • Raised incremental long term borrowings of ~Rs. 3,200 Cr till 15th July

                               Normalcy returning since Jun’20, especially in Rural India
                          Prudently created additional provisions to safeguard balance sheet
        Strong pickup of collections and disbursements highlight business robustness across lending platforms

7
Q1FY21 in perspective

         Lockdown till Apr / May                                                       Lockdown

         Gradual unlocking in May / June and extension of RBI moratorium till Aug-20   Unlocking

8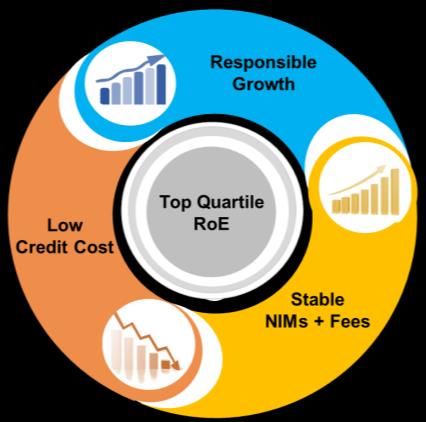
Moratorium – Considerable improvement post opening up                                                                        Lockdown

         Product                   LTFS’ Moratorium Policy 1.0                             LTFS’ Moratorium Policy 2.0

                         • All customers granted moratorium for 3
     Micro Loans
                           installments by default as per MFIN framework
                         • Moratorium for 3 installments by default where • Moratorium grant only upon receiving specific request
     Farm, TW &            no mandate of central clearance exists           (Opt-in)
     Consumer Loan       • For others, grant only upon receiving specific • A month at a time decision on moratorium for retail
                           request (Opt-in) on a month-on-month basis       customers
                         • Similar to Farm; additionally, Opt-out option
     HL & LAP
                           provided for no mandate customers

     Real Estate         • Case by case decision upon receiving specific customer request
     Infrastructure      • In line with Real Estate; additionally, subject to consensus among co-lenders

                                                  Retail Customers under Moratorium
        100%    100%                                                                                   Apr-20   May-20         Jun-20
                                     75%                              70%
                                                                58%                                               53%
                       48%                                                                 51%                           52%
                                                                                                 46%
                                           35%                              33%                                                33%
                                                  18%                                                   19%

                ML                         Farm                       TW                         CL                  HL & LAP

               • For retail customers who have taken moratorium in June, around 4% have made part payments
          • Around 30% of retail customers who were under moratorium in June, have paid July month installment

                  Considerable reduction in retail moratorium book with resumption of on-field collections
9            40% of Project finance accounts under moratorium, largely protected by DSRA / TRA till end of FY21
Enhanced Portfolio Actions                                                                                                         Lockdown

             Work                                                    Incentives
                                                                                                        Customer
          Allocation                                             Roll-out of revised incentives
                                                                 across teams in line with the
                                                                                                       Engagement
                                                                 revised business volumes                                               Monitoring
     Sales and credit teams                                                                       Educating customers on
     augmented collection              Analytics                 Focus on further conversion
                                                                                                  financial impact of moratorium
     teams to increase focus                                     of customer through digital                                       Project Finance: Focus
     on collections            Use of internal & external data                                    Continuous engagement with       on project progress by
                                                                 modes enabled
                               sources to model propensity of                                     developers to monitor project    monitoring labour and
     Allocation of separate    payment – to help in better                                        progress                         material availability
                                                                 Roll-out of customer
     set of accounts to each   direction of field effort
                                                                 cashback schemes to drive
     team – Increased focus                                                                       Leveraging developer             Retail Finance:
                                                                 digital payments
     across various stages of Usage of analytics to use data                                      relationships for Home Loan      Collection trend and
     debtors                  sources       for        better                                     accounts in Construction         pick-up on economic
                              understanding     of    macro-                                      Finance/Approved Project         activity for new
                              economic environment to drive                                       Finance cases                    business ramp-up
                              improvement in collections

10
Unlock - Strategy
Resumption of Further
on-ground Collections tightened credit Sourcing Liquidity
operations measures
Measured business re-start using data analytics based approach on collections and tightening of credit norms while maintaining
competitive strength
111. Resumption of on-ground operations
Opening of branches
• Gradually opening from May. In June, all the branches except those in the containment zone were opened up
• In Farm and Micro Loans, >95% of the branches have opened up as majority of the rural areas fall under the green and
orange zones
• In Two Wheeler, many urban and semi-urban locations are in the red zone, resulting in a relatively lower opening up.
Operating dealership number increased by >100% in June’20 vs May’20, however major markets like Mumbai and Pune
remain largely closed
• In HL/LAP, operations resumed on limited scale basis gradual lifting of lockdown towards end of May
Farm Two Wheeler Micro Loans Housing
Total branches : 179 Total branches : 71 Total MCs: 1422 Total branches: 25
Open branches Open branches Open branches Open branches
96% 99% 98%
79% 96%
74%
36%
32%
0% 0% 0% 0%
Apr'20 May'20 June'20 Apr'20 May'20 June'20 Apr'20 May'20 June'20 Apr'20 May'20 June'20
Focused on employee safety and local administration rules while opening up; 99% of on-field workforce started operating in June
122.1.1 Collections Strategy
Apr May Jun
Digital repayment push Restoring collection rhythm Re-establishing repayment culture
• Increase in bounce rates for retail • Usage of analytics for propensity • Focused on regular collections and
customers due to lockdown modeling and collection prioritization communicating the impact of
• Prioritized collections by digital modes • Targeted on-ground collections in non moratorium to customers
owing to physical inability to undertake containment zones • Enhanced field efforts in non-
field collections
• Enhanced call center capacity and containment zones led to increase
• Digital collections initiated for ML empaneled new vendors to handle collection efficiencies
customers, accounting for 25% of total surge in bounces
• Farm collection efficiency reached pre-
collections
• Re-evaluated collection agencies to Covid levels
• Shutdown of construction at almost all access ability to collect (owing to
Real Estate projects reverse-migration) • Sustained efforts led to reduction of
Rural GS3 by Rs. 100 Cr on QoQ basis,
• Toll collections impacted due to • Resumption of construction activity in primarily in Farm Equipment
lockdown. Post resumption (22nd Apr), Real Estate projects, collections still
collections reached to ~30% levels YoY materially lower • Doubling of escrow collections in Real
Estate compared to Apr & May-20, at
• No material adverse impact on • Improvement of toll-road collections to
~35% of pre-Covid levels
renewable and transmission projects ~60% levels YoY
• Implemented action plans for Project • No material adverse impact on • Improvement in Toll road collections to
finance portfolio to replenish and renewable, annuity road and around 80% levels YoY
maintain tighter grip on TRA / DSRA transmission projects
Significant uptick in Jun’20 collection volumes owing to re-establishment of collection rhythm
Collection momentum has further improved in Jul’20 especially in Rural
132.1.2 Strong improvement in collections m-o-m
Rural
Average daily collection count Farm
2,67,025
• Analytics based prioritization and on-ground collection efforts,
1,20,479 helped achieve CE of pre-covid levels
• Cash flow availability with farmers due to bumper rabi crop
20,902 Two Wheeler
1,304 • Ramp up of call center (~500 new seats) to handle increased
April May June July bounces
• Realignment of sales and collection teams
Monthly touch free collections • Evaluation of multiple agency partners to ensure availability of
manpower
2,09,000
1,30,114 * 1,22,000 Micro Loans
57,000 • Higher focus towards on-ground collection
• Strengthened digital payment framework like UPI, Wallet, NEFT,
Q4FY20 April May June
Direct Website, Payment Gateways
Rural recovery coupled with usage of analytics for collection prioritization leading to much faster recovery
14 *Monthly average in Q42.1.3 Resumed construction activity leading to collection pickup
Housing
Construction resumed for under construction projects Escrow Collections (as % of pre-Covid levels)
86% Pre-Covid collections
81%
73%
33%
14% 15%
6%
Apr May Jun Jul Apr May Jun
• Strong focus on resuming construction by accessing • Collections saw significant dip post lockdown
availability of labour and materials on weekly basis • With opening up of economy and focused effort to
• In 86% of our under construction funded projects, restart projects, collections has reached 33% of pre-
construction has resumed post lock down Covid levels
❖ In the Home Loans segment, cross functional teams undertook customer interaction to augment collection teams
❖ Use of propensity model & centralized calling; on field collection resumed since end of May. Collections made from
~67% of customers as of June end
Focus on construction progress which will lead to higher collections and sales as economy opens up
152.1.4 Steady performance owing to economic pickup
Infrastructure Finance
Industry avg Daily Power Generation (Mn Units)
Renewables
4,000 3,431 3,615 3,425 500
3,324
3,232
2,835 400
• Operational projects have been conferred “Must Run” status
3,000
2,000 356
300 • No material adverse impact in solar and wind generation
328 200
260 255 260
1,000 228 100 • Most Discoms have remitted payments including Andhra
- - Pradesh, which paid its dues till Mar’20
Jan Feb Mar Apr May Jun
• Central projects are being paid on time
Total Energy Renewable
Source: POSOCO
LTFS portfolio Toll Collections (% level YoY)
100% Road
80%
60%
• Annuity projects are receiving timely payments from NHAI
30%
• Toll road has seen improving level of traffic month-on-month
post resumption of economic activity
April May June
Transmission: Operational projects are operating at optimum capacity and there is no impact on revenue generation and collection
Collections were not impacted much as majority of portfolio is operational having a “Must Run” status
162.2 Collections – Strong pickup through concerted collection efforts
Focused Business
Q1FY21 – 4,321
2,513
813 995
Apr-20 May-20 Jun-20
Rural Finance Housing Finance Infrastructure Finance
Q1FY21 – 2,249 Q1FY21 – 1,613
Q1FY21 – 459
1,472 860
284 493 162 116 181 367 386
Apr-20 May-20 June-20 Apr-20 May-20 Jun-20 Apr-20 May-20 Jun-20
❖ Marked improvement in Rural & Infra collections owing to concerted field efforts and gradual unlocking of economy
➢ Consistent increase in collection volumes, currently at 40%-45% of Q1FY20 levels with Jun’20 collections at ~65-70% of
Jun’19, owing to mobilization of field collection efforts
➢ Substantial uptick in July in Rural with daily collection rate of ~2,67,000 accounts and collection of ~ Rs 1,100 Cr till 15 th July
Analytics led collection prioritization and resource allocation
Visible green shoots in Rural with considerable improvement in June collections
July showing even better trend with collection volumes in Micro Loans till 10th July surpassing June collections
17 All figures are in Rs. cr2.3 Substantial reduction in 1+DPD bucket
Debtors (1-90 DPD) GS3
5,572
4,266
5,037
4,939
Q4FY20 Q1FY21 Q4FY20 Q1FY21
❖ Substantial reduction in debtors by Rs. 1,306 Cr (1-90 DPD) on the back of improved collections across businesses
❖ Reduction in GS3 by Rs. 98 Cr led by Rural portfolio through on-ground collection efforts, push on digital collections and
propensity based modeling
❖ Farm business saw substantial improvement in debtors as well as GS3 aided by good monsoon, bumper rabi crop
❖ Significant reduction in debtors pool in retail housing segment with the help of tele-calling and using analytics for customer
prioritization
Continued focus on ‘on-due-date’ collections and emphasis on collections from debtors and GS3 during lockdown has resulted in
reduction in debtors and GS3
18 All figures are in Rs. cr3. Further tightened credit measures
• Reduction of max LTV across products. LTV maintained under 70% for Farm; reduced from 74% to 68% for TW, maintained
under 70% for HL and 55% for LAP
• Measured business re-start based on weekly evaluation of on the on-ground collections results
• Reassessed collateral valuation of all existing loans as well as sanctioned but undisbursed cases
• Farm: Focus on geographies which have transitioned to mechanized mode of working to mitigate labour shortage
Retail • TW: Launch of income proof proposition – further enhancing proportion of better credit income proof borrowers
Finance • ML: Reduction of association norms to 2 for new customer and 3 for repeat customer in Micro Loans. Exposure norms are
revised state wise based on their average outstanding from earlier Rs ~80,000 to Rs ~70,000 of overall indebtness
• CL: Re-initiation of business with tightened credit guardrails
• Retail Housing: Credit policy suitably modified with increased focus on sourcing of low risk profiles / channels
o HL: Primary focus on low risk salaried customers through direct sourcing and stringent assessment of SENP customers
o LAP: Sourcing temporarily kept on hold due to uncertainty prevailing around MSME segment
• Real Estate: Recalibration of guardrails under new market conditions for under construction projects
o Enhanced Risk Guardrails – to limit funding to specific products and select developers
o Reassessment of real estate developers categorization basis revised Group cash flows
Project
• Infrastructure:
Finance
o Construction feasibility assessment from supply chain and labour availability perspective
o Zero inflation assumption for HAM projects to mitigate the gap between the Bank rate & the lending rates
o Re-assessment of traffic for sanctioned undisbursed cases afresh for impact on the underlying traffic drivers
194. Sourcing – Targeted growth
All figures are in Rs. cr
Focused Business
9,608 Q1FY21 – 2,318
492 1,537
289
Q1FY20 Apr-20 May-20 Jun-20
Rural Finance Housing Finance Infrastructure Finance
4,232
3,252 Q1FY21 – 1,089
Q1FY21 – 913 2,123 Q1FY21 – 317
702 742
9 202 99 124 93 181 167
Q1FY20 Apr-20 May-20 June-20 Q1FY20 Apr-20 May-20 Jun-20 Q1FY20 Apr-20 May-20 Jun-20
Apr May Jun
Complete Lockdown Resuming Operations Guarded Market Approach
o Retail Finance: Near to NIL disbursements o Re-initiated Farm and TW business with o Ensure presence across all top
owing to closure of point of sales tightened credit norms based on weekly dealer/OEM’s. Increased share of Preferred
monitoring of repayment behavior analysis OEM’s and Dealers in Farm and TW
o Project Finance: Continued tranche
disbursements to focus on project o Resumed HL disbursements for Salaried o ML and CL business expected to pickup in
completion profiles with stronger credit filters Q2 FY21 in select areas driven by strong
collections performance
Maintained market leadership in Farm with strong traction in tractor sales for Jun’20
20 Disbursements coming to normalcy in June and we are well placed to gain market share as economy (especially Rural) picks up5. Comfortably placed with adequate liquidity
Month end Liquid Assets
11,794
9,348 9,082
8,468
Mar-20 Apr-20 May-20 Jun-20
❖ As of June’20, Rs.16,669 Cr of liquidity is maintained through the following:
➢ Liquid Assets in form of cash, FDs and other liquid investments of Rs. 9,082 Cr; comfortably placed till Sept-20
➢ Undrawn bank lines of Rs. 5,587 Cr and back up line from L&T of Rs. 2,000 Cr
❖ With moratorium announcement, increased liquid assets substantially in April factoring in scenario of Nil collections. With the
pickup in collections from May, quantum of liquid assets has been reduced, yet it continues to remain at elevated levels
❖ Rating Agencies are assessing adequacy of our liquidity every month-end with a 3-month horizon & are comfortable with the same
❖ Maintained additional average quarterly liquid assets of ~Rs 6,600 Cr in Q1FY21 which had a negative carry (~Rs. 84 Cr). This
impact of negative carry will reduce as we get surety on the pickup in economic activity and collections
Comfortably placed with adequate liquidity even after factoring the effect of moratorium and difficult conditions in the debt market
Maintained higher liquidity levels in Q1FY21, negative carry will progressively reduce as we get surety
21 All figures are in Rs. crAgenda
A Q1 in perspective
B What worked for LTFH
C Q1 P&L explained
22What worked for LTFH
ASSURANCE
Prudent ALM and well established liability franchise Highest Credit Rating
Strong Balance Sheet Strengthened risk profile
Building Business Strength
231.1 Prudent ALM
As on 30th June, 2020
Structural Liquidity statement
57,671
Cumulative Inflows (Rs. Cr) Cumulative Outflows (Rs. Cr)
33,803
30,280
24,216
19,471 19,306
15,905
9,281 11,508 11,335
3,580 6,376
39 385
1-7 days 8-14 days 15 days-1 month 1-2 months 2-3 months 3-6 months 6-12 months
Cumulative 12,325
Positive Gap
9,242 11,124 13,095 12,882 14,497 27,391
Cumulative (%) 23609% 2892% 344% 205% 114% 75% 90%
Interest Rate sensitivity statement
1 year Gap Rs. Cr
Re-priceable assets 67,814
Re-priceable liabilities 53,820
Positive 13,994
Maintained positive liquidity gaps for past 3 years, enabling us to tide over recent liquidity crisis
24 All figures are in Rs. Cr1.2 Well established liability franchise (1/2)
Q1FY20 Q1FY21
3% 3% 2%
2%
9%
13%
7%
38% 43%
6%
36%
38%
Bank Loans NCD (ex retail) NCD Retail CP ECB Others
Rs. 92,887 Cr Rs. 94,133 Cr
❖ Focus on diversification over the years enabled stable mix of funding sources
❖ Focus on long term borrowings has led to increase in share of Bank Loans from 38% to 43%; while
reducing CP from 13% to 9% in the past year
Strengthened liability profile with higher proportion of long term borrowing through diversified sources of funding
25 *Others include Preference shares, ICDs etc.1.2 Well established liability franchise (2/2)
Term Loans -
PSL
1%
Incremental Long Term Borrowing (Rs Cr)
Term Loans -
Non PSL
28%
Products Q1FY21
NCD – Private Placement* 2,500
NCD - Term Loans – Non PSL 1,000
Private
Placement
Term Loans – PSL 50
71%
Total 3,550
Rs. 3,550 Cr
❖ Already raised ~Rs 3,200 Cr of long-term borrowing till 15th July’20
❖ Drawn down 1st tranche of USD 50 million of the total USD 100 million ECB from AIIB; which is AIIB’s first loan to a NBFC in
India
Demonstrated ability to raise long-term funding even in the challenging environment
26 PSL- Priority sector on-lending by banks to NBFCs1.3 Weighted average cost on borrowings
8.71% 8.61%
8.58% 8.53% 8.59% 8.54% 8.43% 8.49%
8.50%
8.36%
8.24% 8.16% 8.23% 8.29% 8.33%
Q3 Q4 Q1 Q2 Q3 Q4 Q1 Q2 Q3 Q4 Q1 Q2 Q3 Q4 Q1
FY17 FY17 FY18 FY18 FY18 FY18 FY19 FY19 FY19 FY19 FY20 FY20 FY20 FY20 FY21
Effective liability management is demonstrated through stable WAC despite diversification, reduction in CP and increase in long-term
borrowings
272. AAA Credit Rating for LTFH and all its subsidiaries
Credit Ratings – LTFH and its subsidiaries
• LTFH and all its lending subsidiaries have been assigned / reaffirmed AAA rating from CRISIL, ICRA, CARE
and India Ratings:
➢ CRISIL assigned in October 2019 and reaffirmed in May 2020
Ratings
Update ➢ India Ratings reaffirmed in September 2019 and April 2020
➢ ICRA and CARE reaffirmed in August 2019
• Amalgamation impact: On the proposed merger of L&T Housing Finance and L&T Infrastructure Finance
with L&T Finance, all rating agencies have “Reaffirmed” the ratings in Mar-Apr 20
Key strengths highlighted by Rating Agencies
• Liquidity: Rating Agencies have analysed LTFS cash flow / liquidity position in the light of Covid19, and they have
considered the liquidity position of LTFS as adequate to meet all debt obligations over the next few months
• Diversified businesses, rationalisation of product offerings and strengthened risk profile across businesses
• Strategic importance and strong support to financial services business by the parent, Larsen and Toubro Ltd. (L&T: AAA)
• Experienced management team and prudent management policies
Diversified business presence, improving asset quality, prudent ALM and strategic importance to L&T has led AAA rating being
reaffirmed even in current environment, when the sector has seen multiple downgrades
283.1 Strong Balance sheet
LTFH Consolidated – Asset Quality
58% 59% 69%
10%
5,460
5,037 4,939
7%
5.36%
5.72% 5.24%
2,287
2,078
1,553 4%
2.28%
2.48% 1.71%
1%
Q1FY20 Q4FY20 Q1FY21
GS3 (Rs. Cr) NS3 (Rs. Cr) GS3 (%) NS3 (%) PCR (%)
In addition to above; Macro Prudential provisions, Covid-19 and enhanced provision for stage 1&2 assets at Rs. 1,244 Cr (1.39%)
Focus on strengthening balance sheet by creating additional provisions of 1.39% on standard book, to prepare for any uncertainty
29 GS3 - Gross Stage 3; NS3 - Net Stage 3; PCR – Provision Coverage Ratio3.2 Strong Balance sheet – Additional provisions on Non GS3 book
Particulars (Rs. Cr) Total Lending Business
Loan book size (excluding GS3 book) - (1) 89,363
Provision on stage 1 and Stage 2 assets as per ECL model - (2) 399
Additional provisions - (3+4+5=6) 1,244
Macro Prudential provisions - (3) 650
Covid-19 Provisions @10% on 1-90 DPD book with moratorium - (4) 486
Enhanced ECL provisions on stage 2 assets basis higher LGD assumptions – (5) 108
Additional provisions as % of book – (6/1) 1.39%
Total provisions on book (excluding GS3 provisions) – (2+6=7) 1,644
Total provisions as % of book (excluding GS3) - (7/1) 1.84%
As a prudent measure, created Macro-prudential provisions of Rs 300 Cr in Rural portfolio in Q1FY21; over and above 10% of Covid
provisions to strengthen balance sheet, even though there is strong on-ground recovery in Rural
304.1 Strengthened risk profile: Retail Finance
Rural, HL and LAP
Actions taken to ensure quality portfolio
• Use of data analytics to determine OEM classification, geography selection and dealer penetration
• Centrally controlled parameterized underwriting with focus on ensuring portfolio quality by analyzing tenure, ticket size,
geography & climate patterns
Farm
• Focus on early bucket collection and behavioural scorecard for collection prioritization
• Underwriting based on fully automated Scorecard with self learning algorithm to ensures uniformity of application of rules
• Periodical recalibration of underwriting scorecard based on loan tenure, LTV and credit quality trends in geographies
TW
• Focus on retention of existing good customers with excellent track record of repayments and leverage
• Stringent Underwriting and EWS policy based on overall customer indebtedness, customer behavior and borrower level
Micro Loans • Early warning signals for each borrower by monitoring customer indebtedness , repayment behavior and no. of lenders
• Focus on low risk salaried segment; extensive use of analytics in identification and targeting of desired customer profiles
• Emphasis on direct sourcing through select and reputed developer relationships (CF/APF)
HL / LAP
• Cautious approach on self-employed segment with stringent credit policy
Continue steady improvement in asset quality by focusing on early warning signals, culture of 0 DPD & strong collection architecture
314.2 Strengthened risk profile: Project Finance
Infrastructure and Real Estate
Actions taken to ensure quality portfolio
• Focus on funding to marquee developers with proven track record of project completion and ability to sell
• Gradually increased share of commercial portfolio with focus largely towards Grade A office space
• In residential space, funding mid and affordable projects which are less cyclical
• Financed adequately to ensure project completion; sole lenders in 99% of projects financed by us, to ensure full control on
project execution
Real Estate
• Strong focus on project monitoring at regular interval to ensure project completion as per approved plan, cost and timelines
• Enhanced frequency of portfolio reviews to identify risks well before cash flow stress; leverage on group strengths to identify
and execute corrective actions plans
• Focus on strong corporates and developers backed by global private equity players in Renewables and Road sector
• Focus on projects with strong off-takers / counter-parties
• External risks like PPA, land acquisition, evacuation risk, promoter equity infusion and forex are appropriately mitigated
Infrastructure • Early warning signal (EWS) to identify risks well before cash flow stress; leverage on group strengths to identify and
Finance execute corrective actions plans
• Conservative underwriting by considering cash flow volatility
• Offering appropriate tenor based on project cash flow
Using knowledge repository of L&T ecosystem, to identify strong developers and build our monitoring framework
325.1 Building and protecting strength
Rural Finance
Industry LTFH
• Positive sentiment due to robust Rabi crop, good progress in • Disbursements in Jun’20 were higher than previous year owing
kharif sowing so far to strong rural cash
• Timely onset of monsoon and well distributed rainfall has • Increase in preferred OEM mix which contributed to 73% of the
resulted into above normal water reservoir level total disbursement in Q1FY21
Farm
• OEMs are operating at 70-80% capacity • Continue to build refinance contribution
• Measured re-opening of business based on strategic input from
• Recovery in TW industry expected from positive rural Collection, Sales and Marketing teams
sentiment and preference for personal mobility over shared • Selective sourcing through strict credit policies (LTV reduced to
• Higher price points of TWs and lower disposable income will 68%) while maintaining superior service and TAT proposition
TW augment TW financing penetration • Given that we are the preferred financiers with most of the
OEMs, as the demand increases we will get more traction
• Increased demand for working capital requirements by micro • Prioritized collections in Q1FY21; new business opportunities
enterprises and Kirana shop owners post return to normalcy basis collection trend and repayment behavior
• Reverse migration of workers could provide fresh business • Launch of top up loan for the existing good customers
opportunities for MFIs
Micro Loans • Focus on increasing share of existing good customers
• Consolidation expected in MFI sector; as smaller players are
facing serious liquidity challenges • Restarted operations in almost all MCs across India by Jun’20
With leadership position across products and superior service proposition through TAT, we have been able to restart business with
chosen dealers and OEMs wherever we see good opportunity
335.2 Building and protecting strength
Housing Finance
Industry LTFH
• NBFCs/HFCs loan portfolio reduced significantly due to funding • Home Loan disbursements during the quarter slowed down
constraints, slowdown post Covid and portfolio sales by HFCs significantly on account of lockdown of locations and no walk-
ins at developer sites
• Deferment of buying decision by home buyers on account of
prevailing uncertainty owing to COVID-19 pandemic • Committed disbursements resumed towards end of May on
Home Loan account of partial opening of lockdown
• Demand expected to resume in phased manner and will be
concentrated towards top developers and projects with visible • Sourcing of fresh proposals for the salaried segment resumed
construction progress
towards end of the quarter
• Liquidity position and business activity levels remain adverse for
• Sourcing of SENP profiles restricted; no LAP disbursements
the SME sector due to lockdown
done during this period
• Given the increasing risk perception, industry is expected to be
LAP • Average LTV of portfolio is 53% in Q1FY21
conservative while lending in this segment
• 100% of disbursements were towards existing projects
• Sales and launches were negligible and mostly restricted to Cat
A builders. Consequently inventory levels remained stable • No new sanctions made during the quarter
• Developers using innovative digital marketing tools to increase • Continue to focus on marquee developers with stringent
Real Estate sales in the current environment guardrails
• Short term focus would be on offloading existing inventory • In 86% of the under construction projects, construction has
resumed post lock down
Focus on salaried segment for retail segment and marquee developers for Real Estate with stringent guardrails
345.3 Building and protecting strength
Infrastructure Finance
Industry LTFH
• Continue to focus on our core sectors – roads,
• Liquidity injection of Rs. 90,000 Cr by GoI to Discoms
through PFC and REC. Expected to positively impact renewable and transmission
the liquidity of IPP players • Focus on central offtakers like SECI and selective state
• 4.5 GW Solar capacities allotted during Q1FY21, bids, which are better structured in terms of payment
through e-reverse auction by SECI/ States cycle and grid availability
• 400 MW Bid by SECI (Hybrid) in Q1FY21 pertaining to
• Lending opportunities in TOT bundles in FY21; Internal
Infrastructure Solar, Wind Auction with Storage with lowest tariff of
Finance framework in place for evaluation of opportunities in
Rs. 2.9/kwh
TOT. Process for Govt. approvals for IDF financing of
• Pace of HAM awarding has increased in Q4FY20 with ~
TOT projects is at an advanced stage
582 kms of project award in one quarter alone as
compared to muted awards in 9MFY20. However, no • LTFS to adopt selective approach with respect to HAM
new bidding was observed in Q1FY21 in HAM segment projects
• NHAI planning to raise Rs. ~85,000 Cr by FY25 through • One HAM project achieved PCOD in May before
TOT awards and InVITs
schedule
Market leadership position maintained in identified sectors
355.4 Building and protecting strength
Mutual Funds
• Experienced investment team and superior fund performance has resulted in improvement in market
ranking and higher growth than industry
➢ On a 5-year performance, 6 out of 10 Equity schemes (83% of equity AUM) are in top 1 & 2 quartile
➢ Fixed Income portfolio reasonably insulated in the current market as 97% of the fixed Income AUM is in
high quality funds (non credit risk fund) with investments in highest rated securities of GOI / A1+ / AAA/
Fund Cash and cash equivalents
Performance
➢ Demonstrated Nil markdown in high quality funds and minimal markdowns in credit oriented funds
• Creation of long term stable customer base has contributed to higher AUM growth
➢ Higher proportion of individual customer’s share in AUM – 64% (industry average - 52%)
➢ Increase in investor base from 9.1 lakh to 29 lakh+ live folios since FY16
Operational
Efficiency • Well diversified distribution channel mix: Banks & PCG (36%), National Distributors (27%) and IFAs (37%)
• Consistent improvement in profitability (since FY16) is achieved on the back of the following :
➢ Gain in overall market share from 2.0% to 2.4%
➢ Equity AUM mix rising from 44% to 55% on back of increase in equity market share from 2.6% to 3.3%
➢ Branch rationalization, operational cost renegotiations and higher productivity led to reduction in C/I ratio
Profitability and
its drivers • Equity AUM increased by 19% q-o-q (Rs 28,010 in Q4FY20 vs. Rs. 33,295 in Q1FY21)
Superior fund performance, higher share of equity and rationalized cost has resulted in achieving desired profitability
36Agenda
A Q1 in perspective
B What worked for LTFH
C Q1 P&L explained
37Summary of impact on results
• Lower disbursements in Retail segments
due to lockdown even though there is • Book remained flat due to lower
strong pick-up seen in June disbursements and moratorium impact on
Disbursements • Project Finance – Focused on tranche Book
collections
disbursements
• NIMS impacted because of higher interest
• Fees for the quarter is substantially lower
cost on account of higher liquidity
due to relatively lower disbursements
maintained throughout the quarter Fees
NIMs
• GS3 & standard assets – Rs 318 Cr
• Macro prudential provisions – Rs 300 Cr
• Measures taken to reduce Opex have • Covid-19 provisions – Rs 277 Cr
yielded results • Additionally, utilized capital gain of Rs 225
Opex Credit Cost
Cr from sale of Wealth business to provide
fully for 1 large account in Defocused book
Profitability for the quarter was impacted largely due to negative carry on enhanced liquidity, lower fees and enhanced provision
taken to strengthen the balance sheet against the after effect of the pandemic
38Focused book growth
Lending Businesses Non Lending Businesses
Rural Housing Infrastructure Investment
Finance Finance Finance Management
Q1FY20 Q1FY21
Book AAuM1
21%
6% 4% 2%
Book remained flat due to lower disbursements and moratorium impact on collections
1 Investment Management – AAuM (quarterly average)
39NIMs
Interest Income Interest Cost NIMs
3,287 3,232 3,212
1,918 1,977 1,413
1,819 1,369
1,235
Q1FY20 Q4FY20 Q1FY21 Q1FY20 Q4FY20 Q1FY21 Q1FY20 Q4FY20 Q1FY21
❖ Interest income remained stable across the quarters
❖ Maintained additional liquid assets worth ~Rs. 6,600 Cr throughout the quarter as a prudent measure, leading to an increase in
interest cost of ~Rs.140 Cr
NIMs impacted due to increase in interest cost on account of maintaining additional liquidity for full quarter
40 All figures are in Rs. CrNIMs + Fee & other income
NIMs + Fee & other Income
% of average book
6.76% 6.87%
5.78%
Q1FY20 Q4FY20 Q1FY21
❖ NIMs+Fees impacted due to lower fee income and negative carry (~Rs. 84 Cr) on account of maintaining
additional liquid assets of ~Rs 6,600 Cr in Q1FY21
❖ Impact of negative carry will reduce as we get surety on the pickup in economic activity and collections
* Normalising for one-time impact
41 Actuals without normalization: Q1FY20 – 7.10%Credit cost
Credit Cost Q1FY20 Q2FY20 Q3FY20 Q4FY20 Q1FY21
Credit Cost on focused business 260 414 445 349 231 * Additionally, utilized
capital gain of Rs. 225
Credit Cost on defocused business 310 210 160 89 88* Cr from sale of Wealth
Additional Provisions – Covid-19 - - - 209 277 business to provide fully
for 1 large account
Additional Provisions - Macro prudential /
25 - - 105 300
Enhanced ECL on stage 2 assets
Total Credit Cost 595 624 605 752 896
Credit Cost on focused business (%) 1.16% 1.81% 1.88% 1.48% 0.99%
Provision Coverage Ratio (PCR %) 58% 54% 57% 59% 69%
• Increase in PCR from 59% to 69% QoQ on account of the following:
o Focused book: ECL based increase in PCR on account of 1) reduction in GS3 from early buckets (which contains lower
PCR) and 2) further increase in PCR of remaining GS3 book as ageing increases
o Defocused book: Increase in PCR to 70%; 1 large account fully provided by using gain from sale of wealth business (Rs.
225 Cr)
• Created additional provisions of Rs. 577 Cr. on account of:
o Covid-19 provision of Rs. 277 Cr. in Q1FY21 (5% of 1-90 DPD book with moratorium)
o Macro prudential provisions of Rs. 300 Cr. in Rural portfolio
Further strengthened balance sheet by creating adequate PCR on GS3 book and additional provision on non-GS3 book, despite
seeing good collection traction, to reduce the effect of uncertain economic environment post moratorium
42 All figures are in Rs. CrLTFH Consolidated – Summary financial performance
Performance Summary
Q1FY20 Summary P&L (Rs. Cr ) Q4FY20 Q1FY21 Y-o-Y (%) Addl. P&L charge in Q1FY21
3,287 Interest Income 3,232 3,212 (2%)
1,918 Interest Expense 1,819 1,977 3%
1,369 NIM 1,413 1,235 (10%)
396 Fee & Other Income 291 190 (52%)
1,765 NIM + Fee & other income 1,705 1,426 (19%)
422 Operating Expense 513 418 (1%)
1,342 Earnings before credit cost 1,192 1,007 (25%) Created additional
provision of Rs 577
570 Credit Cost (excl. Covid-19 & Macro Prudential) 543 318 (44%) Cr
25 Credit Cost (for Covid-19 & Macro Prudential) 209 577 -
549 PAT 386 148 (73%)
Impact of Rs. 432 Cr
on PAT
Q1FY20 Particulars (Rs. Cr) Q4FY20 Q1FY21 Y-o-Y(%)
99,904 Book 98,384 98,879 (1%)
13,988 Networth 14,692 14,881 6%
70 Book Value per share (Rs.) 73 74 6%
43LTFH Consolidated – Key ratios
Key Ratios
Q1FY20 Key Ratios Q4FY20 Q1FY21 Addl. P&L charge in Q1FY21
13.22% Yield 13.02% 13.03%
5.51% Net Interest Margin 5.69% 5.01%
1.59% Fee & Other Income 1.17% 0.77%
7.10% NIM + Fee & other income 6.87% 5.78%
1.70% Operating Expenses 2.07% 1.70%
5.40% Earnings before credit cost 4.80% 4.09% Additional
provision created
2.29% Credit Cost (excl. Covid-19 & Macro Prudential) 2.19% 1.29% Rs 577 Cr
0.10% Credit Cost (for Covid-19 & Macro Prudential) 0.84% 2.34%
2.07% Return on Assets 1.46% 0.53%
6.16 Debt / Equity 5.81 5.70
Impact of 432 Cr
15.99% Return on Equity 10.41% 3.94% on PAT, excluding
this RoE would be
15.25%
Particulars Tier I Tier II CRAR
Consolidated CRAR ratio 17.23% 3.95% 21.18%
44LTFH Consolidated – Capital allocation and RoE bridge: Q1FY21
Q1 FY20 Q1 FY21
PAT
Business Segments (₹ Cr)
PAT Net Worth RoE Y-o-Y (%)
PAT Net worth RoE
252 3,962 26.20% Rural Finance 114 4,516 9.91% (55%)
208 3,874 22.07% Housing Finance 23 4,301 2.12% (89%)
156 3,810 16.94% Infrastructure Finance (ex IDF) 18 5,087 1.39% (89%)
74 1,135 27.34% IDF 40 1,307 12.46% (46%)
690 12,781 22.29% Lending Business 195 15,211 5.06% (72%)
66 1,020 - Investment Management 50 1,103 - -
756 13,801 22.63% Focused Business Total 245 16,314 5.95% (68%)
(174) 1,344 - De-focused (56) 794 - -
(33) (1,157) - Others (41) (2,227) - -
549 13,988 15.99% LTFH Consol before exceptional items 148 14,881 3.94% (73%)
- - - Less : Exceptional items * - - - -
549 13,988 15.99% LTFH Consol 148 14,881 3.94% (73%)
Excluding impact of additional provision created on account of Covid19 and Macro Prudential provisions
Q1 FY21 PAT: Rs. 580 Cr I ROE: 15.25%
45 * Benefit from exceptional capital gains of Rs. 225 Cr entirely used to create additional provisions in defocused bookConclusion
Faster than expected recovery in Rural, well poised to gain from the same
▪ Significant pickup in collection volumes owing to on-field efforts, collection momentum continues in
July especially in Rural; ML collections till 15th July’20 have already surpassed June
Progressive ▪ Maintained leadership in Farm in Jun’20, financed over 10,000 tractors (19% YoY increase)
business pickup ▪ Focus on tranche disbursements in Project Finance and pickup in traction for IDF disbursements
▪ Disbursement momentum expected to increase from Q2FY21 especially in Rural business
Improvement in asset quality
• Reduction in GS3 and NS3 from 5.72% and 2.48% in Q1FY20 to 5.24% and 1.71% in Q1FY21
• Increase in PCR from 58% to 69% YoY
Improved Asset
Quality • Reduction in debtors and GS3 by ~Rs 1,300 Cr and ~Rs 100 Cr QoQ
Strong Balance Sheet
• Strengthened balance sheet by creating provisions of Rs. 577 Cr in Q1FY21 (Macro prudential –
Rs. 300 Cr, Covid-19 – Rs. 277 Cr)
• With this, carrying additional provisions of Rs 1,244 Cr (1.39%) on standard book even though
Strong Balance
Sheet
there is strong collections recovery and improvement in asset quality
• With these provisions, we are well prepared for any economic uncertainty post moratorium
LTFH strongly positioned and ready to benefit from Rural recovery
46Appendix 47
Lending Business – Business wise disbursement split

                                                   Disbursement

                  Q1FY20             Segments (Rs. Cr )       Q4FY20       Q1FY21       Y-o-Y (%)
                      874      Farm Equipment                      890         590        (33%)
                    1,090      TW Finance                         1,203        310        (72%)
                    2,268      Micro Loans                        2,216             7    (100%)
                           -   Consumer Loans                      112              6          -
                    4,232      Rural Finance                      4,420        913        (78%)
                      661      Home Loans                          594          66        (90%)
                      188      LAP                                 111              2     (99%)
                    1,275      Real Estate Finance                1,197        248        (81%)
                    2,123      Housing Finance                    1,902        317        (85%)
                    3,252      Infrastructure Finance             1,885        648        (80%)
                           -   Infra Debt Fund (IDF)                   6       441             -
                    3,252      Infrastructure Finance             1,891      1,089        (67%)
                    9,608      Focused Business                   8,213      2,318        (76%)
                           -   De-focused                              -            -          -
                    9,608      Total Disbursement                 8,213      2,318        (76%)

48
Lending Business – Business wise book split
Book
Q1FY20 Segments (Rs. Cr) Q4FY20 Q1FY21 Y-o-Y (%)
7,463 Farm Equipment 8,438 8,403 13%
5,857 TW Finance 6,575 6,386 9%
12,524 Micro Loans 12,495 12,531 0%
- Consumer Loans 154 155 -
25,845 Rural Finance 27,661 27,476 6%
6,615 Home Loans 7,770 7,830 18%
4,217 LAP 3,881 3,908 (7%)
15,201 Real Estate Finance 14,933 15,216 0%
26,033 Housing Finance 26,584 26,954 4%
30,315 Infrastructure Finance 30,113 30,131 (1%)
8,307 Infra Debt Fund (IDF) 8,796 9,146 10%
38,623 Infrastructure Finance 38,909 39,276 2%
90,500 Focused Business 93,154 93,706 4%
9,403 De-focused 5,230 5,173 (45%)
99,904 Total Book* 98,384 98,879 (1%)
49 * Excludes sovereign debtRural Finance – Summary financial performance
Performance Summary
Q1FY20 Summary P&L (Rs. Cr ) Q4FY20 Q1FY21 Y-o-Y (%)
1,195 Interest Income 1,317 1,307 9%
469 Interest Expense 464 509 8%
726 NIM 852 798 10%
109 Fee & Other Income 94 32 (71%)
835 NIM + Fee & other income 946 829 (1%)
258 Operating Expense 302 262 1%
577 Earnings before credit cost 644 568 (2%)
223 Credit Cost (excl. Covid-19 & Macro Prudential) 378 60 (73%)
- Credit Cost (for Covid-19 & Macro Prudential) 57 374 -
252 PAT 175 114 (55%)
Q1FY20 Particulars (Rs. Cr ) Q4FY20 Q1FY21 Y-o-Y(%)
25,845 Book 27,661 27,476 6%
3,962 Networth 4,523 4,516 14%
50Rural Finance – Key ratios
Key Ratios
Q1FY20 Key Ratios Q4FY20 Q1FY21
18.54% Yield 18.97% 18.83%
11.32% Net Interest Margin 12.35% 11.53%
1.70% Fee & Other Income 1.36% 0.46%
13.02% NIM + Fee & other income 13.71% 11.98%
4.02% Operating Expenses 4.38% 3.78%
9.00% Earnings before credit cost 9.33% 8.20%
3.48% Credit Cost (excl. Covid-19 & Macro Prudential) 5.48% 0.87%
- Credit Cost (for Covid-19 & Macro Prudential) 0.83% 5.41%
3.89% Return on Assets 2.46% 1.52%
5.41 Debt / Equity 4.93 4.84
26.20% Return on Equity 15.14% 9.91%
51Rural Finance - Asset quality
Rural - Asset Quality
64% 77% 93%
13%
11%
1,021 9%
871 921
7%
5%
3.42% 3.78% 3.43%
314 3%
233
1.26% 0.89% 1%
0.26% 67
-1%
Q1FY20 Q4FY20 Q1FY21
GS3 (Rs. Cr) NS3 (Rs. Cr) GS3 (%) NS3 (%) PCR (%)
In addition to above; Macro Prudential provisions, Covid-19 and enhanced provision for stage 1&2 assets at Rs. 764 Cr (2.95% of
standard book)
52 GS3 - Gross Stage 3; NS3 - Net Stage 3; PCR – Provision Coverage RatioHousing Finance – Summary financial performance
Performance Summary
Q1FY20 Summary P&L (Rs. Cr ) Q4FY20 Q1FY21 Y-o-Y (%)
828 Interest Income 821 825 (0%)
484 Interest Expense 503 558 15%
344 NIM 317 267 (22%)
62 Fee & Other Income 39 36 (43%)
407 NIM + Fee & other income 357 302 (26%)
59 Operating Expense 85 80 34%
347 Earnings before credit cost 272 223 (36%)
33 Credit Cost (excl Covid-19 & Macro Prudential) 23 25 (23%)
25 Credit Cost (for Covid-19 & Macro Prudential) 133 185 -
208 PAT 102 23 (89%)
Q1FY20 Particulars (Rs. Cr ) Q4FY20 Q1FY21 Y-o-Y(%)
26,033 Book 26,584 26,954 4%
3,874 Networth 4,302 4,301 11%
53Housing Finance – Key ratios
Key Ratios
Q1FY20 Key Ratios Q4FY20 Q1FY21
12.90% Yield 12.29% 12.32%
5.36% Net Interest Margin 4.75% 3.99%
0.97% Fee & Other Income 0.59% 0.53%
6.33% NIM + Fee & other income 5.34% 4.52%
0.92% Operating Expenses 1.27% 1.19%
5.41% Earnings before credit cost 4.07% 3.33%
0.51% Credit Cost (excl Covid-19 & Macro Prudential) 0.35% 0.38%
0.39% Credit Cost (for Covid-19 & Macro Prudential) 1.99% 2.76%
3.01% Return on Assets 1.37% 0.29%
5.84 Debt / Equity 5.59 5.68
22.07% Return on Equity 9.28% 2.12%
54Housing Finance - Asset quality
Housing - Asset Quality
31% 31% 33%
3%
255 259
212
177 174
145
0.97% 0.97%
0.82%
0.68% 0.65%
0.56%
0%
Q1FY20 Q4FY20 Q1FY21
GS3 (Rs. Cr) NS3 (Rs. Cr) GS3 (%) NS3 (%) PCR (%)
In addition to above; Macro Prudential provisions, Covid-19 and enhanced provision for stage 1&2 assets at Rs. 444 Cr (1.68% of
standard book)
55 GS3 - Gross Stage 3; NS3 - Net Stage 3; PCR – Provision Coverage RatioInfrastructure Finance (ex IDF) – Summary financial performance
Performance Summary
Q1FY20 Summary P&L (Rs. Cr ) Q4FY20 Q1FY21 Y-o-Y (%)
781* Interest Income 766 752 (4%)
588 Interest Expense 555 598 2%
194 NIM 210 154 (20%)
106 Fee & Other Income 61 32 (70%)
299 NIM + Fee & other income 271 186 (38%)
45 Operating Expense 51 40 (11%)
254 Earnings before credit cost 220 146 (43%)
4 Credit Cost (excl Covid-19) 54 143 -
- Credit Cost (for Covid-19) 17 17 -
156 PAT 140 18 (89%)
Q1FY20 Particulars (Rs. Cr ) Q4FY20 Q1FY21 Y-o-Y(%)
30,315 Book 30,113 30,131 (1%)
3,810 Networth 5,341 5,087 34%
56 *Includes interest income of Rs. 52 Cr for IL&FS, which was deferred in Q4FY19 and recognized in Q1FY20Infrastructure Finance (ex IDF) – Key ratios
Key Ratios
Q1FY20 Key Ratios Q4FY20 Q1FY21
10.46%* Yield 9.98% 10.02%
2.59% Net Interest Margin 2.74% 2.06%
1.41% Fee & Other Income 0.79% 0.42%
4.00% NIM + Fee & other income 3.53% 2.48%
0.60% Operating Expenses 0.67% 0.54%
3.40% Earnings before credit cost 2.86% 1.94%
0.05% Credit Cost (excl Covid-19) 0.70% 1.91%
- Credit Cost (for Covid-19) 0.22% 0.23%
1.98% Return on Assets 1.80% 0.22%
6.77 Debt / Equity 4.72 5.05
16.94% Return on Equity 11.06% 1.39%
57 *Includes interest income of Rs. 52 Cr for IL&FS, which was deferred in Q4FY19 and recognized in Q1FY20Infrastructure Finance (ex IDF) - Asset quality
Infrastructure Finance- Asset Quality
55% 60% 63%
18%
16%
3,569
14%
12.48% 12%
2,568 2,564
10%
9.02% 9.09%
1,594
8%
6%
1,036 956
5.98% 4%
3.85% 3.59%
2%
0%
Q1FY20 Q4FY20 Q1FY21
GS3 (Rs. Cr) NS3 (Rs. Cr) GS3 (%) NS3 (%) PCR (%)
In addition to above; Covid-19 provision at Rs. 34 Cr
58 GS3 - Gross Stage 3; NS3 - Net Stage 3; PCR – Provision Coverage RatioIDF – Summary financial performance
Performance Summary
Q1FY20 Summary P&L (Rs. Cr ) Q4FY20 Q1FY21 Y-o-Y (%)
233* Interest Income 214 213 (9%)
155 Interest Expense 173 175 13%
78 NIM 41 38 (51%)
5 Fee & Other Income 13 12 122%
83 NIM + Fee & other income 55 50 (40%)
9 Operating Expense 10 9 (8%)
74 Earnings before credit cost 44 41 (44%)
0 Credit Cost (1) 1 -
74 PAT 45 40 (46%)
Q1FY20 Particulars (Rs. Cr ) Q4FY20 Q1FY21 Y-o-Y(%)
8,307 Book 8,796 9,146 10%
1,135 Networth 1,267 1,307 15%
59 *Includes interest income of Rs. 32 Cr for IL&FS, which was deferred in Q4FY19 and recognized in Q1FY20IDF – Key ratios
Key Ratios
Q1FY20 Key Ratios Q4FY20 Q1FY21
11.27%* Yield 9.60% 9.53%
3.78% Net Interest Margin 1.85% 1.71%
0.26% Fee & Other Income 0.59% 0.53%
4.04% NIM + Fee & other income 2.45% 2.23%
0.45% Operating Expenses 0.45% 0.38%
3.59% Earnings before credit cost 2.00% 1.85%
0.01% Credit Cost (0.03%) 0.06%
3.44% Return on Assets 1.87% 1.63%
6.37 Debt / Equity 5.98 6.01
27.34% Return on Equity 14.56% 12.46%
60 *Includes interest income of Rs. 32 Cr for IL&FS, which was deferred in Q4FY19 and recognized in Q1FY20You can also read