The Salience of ESG Ratings for Stock Pricing: Evidence From (Potentially) Confused Investors
←
→
Page content transcription
If your browser does not render page correctly, please read the page content below
The Salience of ESG Ratings for Stock Pricing:
Evidence From (Potentially) Confused Investors

    Aleksandra Rzeźnik, Kathleen Weiss Hanley, and Loriana Pelizzon§

                                         June 24, 2021

                                              Abstract

      We exploit the a modification to Sustainanlytics’ environmental, social, and gover-
      nance (ESG) rating methodology, which is subsequently adopted by Morningstar, to
      study whether ESG ratings are salient for stock pricing. We show that the inversion
      of the rating scale but not new information leads some investors to make incorrect
      assessments about the meaning of the change in ESG ratings. They buy (sell)
      stocks they misconceive as ESG upgraded (downgraded) even when the opposite is
      true. This trading behavior exerts transitory price pressure on a↵ected stocks. Our
      paper highlights the importance of ESG ratings for investors and consequently for
      asset prices.

Keywords: Corporate Social Responsibility, ESG Rating Agencies, Sustainable Invest-
ments, Socially responsible investing, ESG, Portfolio choice
JEL Classification: G11, G12, G23, G59, M14, Q5
     We thank Patrick Augustin, Lutz Hahnenstein, Yigitcan Karabulut, Christian Koziol, Albert
Menkveld, Lilian Ng, Ben Sand, Zacharias Sautner, seminar participants at the Tinbergen Institute,
University of Amsterdam, Frankfurt School of Finance and Management, European Central Bank, Frank-
furter Institut für Risikomanagement und Regulierung, University Ca’ Foscari of Venice and JRC Ispra.
We thank Carmelo Latino for excellent research support. Pelizzon thanks the Leibniz Institute for
Financial Research SAFE and the European Investment Bank Institute for the EIBURS project “ESG-
Credit.eu - ESG Factors and Climate Change for Credit Analysis and Rating” for financially sponsoring
this research.
     York University, arz@yorku.ca.
     Lehigh University, kwh315@lehigh.edu.
   §
     Leibniz Institute for Financial Research SAFE, Goethe University Frankfurt, Ca’ Foscari University
of Venice and CEPR, pelizzon@safe-frankfurt.de.

                                                  1
1 Introduction
The Environmental, Social, and Governance (ESG) activities of firms is of increasing
importance to regulators and investors.1 Numerous initiatives are underway to improve
the disclosure and monitoring of ESG activities. For example, the U.S. Securities and
Exchange Commission is considering ways to create an e↵ective ESG disclosure system.2
The European Union recently adopted regulations that require financial market partic-
ipants, such as mutual funds, insurance companies, venture capitalists, and others, to
publish a statement on their website describing the policies in place “where they consider
principal adverse impacts of investment decisions on sustainability factors, a statement
on due diligence policies with respect to those impacts, or where they do not consider
adverse impacts of investment decisions on sustainability factors, clear reasons for why
they do not do so.”3 The demand for “green” assets, whether by regulation or by choice,
has increased reliance on rating agencies to distill information on firms’ ESG activities.
In this paper, we show that changes in ESG ratings are salient to investors’ decision-
making and can impact asset prices using a setting that abstracts away from any change
in underlying firm fundamentals. We do so by exploiting a quasi-natural experiment that
uses a modification in the methodology for determining ESG ratings by Sustainalytics and
its subsequent adoption, one year later in September 2019, by Morningstar and Yahoo!
Finance.
The change in the methodology has two main goals. The first is to reassess the unique
components of a firm’s ESG risk exposure in order to facilitate comparisons across compa-
1
In the U.S. Sustainable investments reached $17.1 trillion at the beginning of 2020, which translates
into a 42% increase since 2018 – https://www.ussif.org/blog home.asp?Display=155. Around the
world, the amount could be as high as $100 trillion – https://www.unpri.org/news-and-press/principles-
for-responsible-investment-releases-new-framework-for-signatories-to-take-action-on-the-sustainable-
development-goals/5924.article.
2
See https://www.sec.gov/news/public-statement/coates-esg-disclosure-keeping-pace-031121.
3
Regulation (EU) 2019/2088 of the European Parliament and of the Council of 27 November 2019.
The Principle for Responsible Regulation association counted up to 700 policy interventions since 2020.
For further details, see https://www.unpri.org/policy/regulation-database.
2nies that may operate in di↵erent sectors. The second goal is to make the interpretation
of the ESG Risk rating more logical by inverting the scale. Both the new and the old
ratings share the same scale from 0 to 100, but under the old method, higher ratings
indicate lower ESG risk while under the new method lower ratings indicate lower ESG
risk. For example, a firm that is considered to be the best in terms of ESG risk would
previously been rated closer to 100 but under the new methodology is rated closer to 0.
The inversion of the rating scale results in a decline in the level of the ESG rating for
the majority of firms in our sample. This, in turn, leads to an unintended consequence
during the transition period: a decline in the ESG rating is perceived to be a “downgrade”
and is thus interpreted by some investors as bad news even when it is not. This causes
them to rebalance their portfolio in such a way as to impact prices. We show that a
one standard deviation decline in the ESG rating translates into a 1.12% decrease in the
monthly four-factor abnormal return.
In order to make sure that it is the inversion of the scale and not the reevaluation of
ESG risk that is driving our results, we employ two di↵erent methods to control for the
potential information content of the new ratings methodology that may cause investors
to rationally reassess the firm’s ESG exposure. In the first, we incorporate two variables
that capture the relative change in ESG risk of the firm due to the new methodology.
The first variable measures how much a firm’s ESG risk ranking changes relative to its
peers before and after adoption. The second variable reflects whether the firm’s change
in rating is accompanied by a reclassification of its ESG risk within Morningstar’s ESG
Rating Assessment. For example, firms in high ESG risk sectors such as oil and gas may
have been highly ranked in their industry under the old methodology but now have a worse
ranking when compared to all other firms. The inclusion of either of these measures of
new information does not change our findings.4
4
We have access to Sustainalytics’ ESG Risk rating prior to the adoption by Morningstar and Yahoo!
Finance. Including the change in the ESG Risk rating over the transition period does not a↵ect our
3In our second method, we restrict our sample to firms whose downgrade is not ac-
companied by a negative change in the firms’ actual ESG exposure: firms whose ratings
decline but their ESG ranking is the same or better than its peers after the adoption.
These firms are unambiguously good (or at least no worse) in terms of the new ESG
Risk rating and we would expect either an increase or no change in abnormal returns.
Our results, however, for this sample of firms remain quantitatively and qualitatively
unchanged. Investors perceive negative changes in ratings as a “downgrade” even when
they are not. The combination of an exogenous shock to ESG ratings and investor con-
fusion makes the interpretation of our findings clear; investor preferences for sustainable
assets and their reliance on ESG ratings for making investment decisions can have pricing
implications.
In our setting, investor preferences are made manifest through confusion, therefore, we
expect that prices will eventually converge to rational values when misinformed investors
correct their erroneous beliefs. Our empirical findings support this conjecture: the e↵ect
on abnormal returns is short-lived. We show that returns adjust to their pre-adoption
level within five months by February 2020.
We next examine what type of investor is most likely to be confused by the new
methodology and thus, drive the post-adoption abnormal returns. We investigate the
trading behavior of four di↵erent types of investors: retail, institutional, ESG funds,
and short sellers. We predict that investor confusion is more likely to be exhibited by
uninformed or retail investors and less likely to be observed in the case of institutional
investors.
Retail investors are generally perceived as less sophisticated, uninformed investors,
or as noise traders (e.g., Calvet, Campbell, and Sodini, 2007; Barber, Odean, and Zhu,
2006). Using Robinhood data, we find that retail participation is reduced when firms
results.
4have a large decline in their ESG ratings upon adoption even when these firms either
have no change or experience an upgrade in their relative risk ranking. Conversely, they
purchase stocks in firms that experience a positive change in their rating.5
We show that the new methodology is not accompanied by changes in the holdings
of 13F institutions or ESG funds. These investors either do not react because they
subscribe to Sustainalytics directly and thus, have been using the new ESG Risk ratings
for a year prior to adoption or are savvy enough to understand implications of the change
in methodology. The finding that there is no portfolio rebalancing for 13F institutions is
not definitive because the reported transactions on Form 13F are only for long positions.
Even if institutions believe that the Sustainalytics’ rating change itself is uninformative,
they may still take advantage of confused investors by shorting the stock.
Indeed, since the adoption of the new methodology could be known in advance, we
anticipate that short sellers will take advantage of unsophisticated investors’ misinterpre-
tation of the ratings change (Boehmer, Jones, and Zhang, 2008; Engelberg, Reed, and
Ringgenberg, 2012; Cohen, Diether, and Malloy, 2007; Diether, Lee, and Werner, 2009;
Boehmer, Huszar, and Jordan, 2010). We document that the size of the change in short
interest is positively related to the change in ESG ratings. In other words, when con-
fused investors are purchasing, short sellers increase their positions in the expectation
that returns will have a subsequent reversal once investors’ realize their error. On the
other hand, when retail investors are selling, short sellers reduce their positions in order
to take advantage of the price pressure on the stock.
We show that the e↵ect of investor confusion about ESG ratings on stock prices is
reduced when firms have high institutional holdings and hence, greater market capital-
ization. This means that the e↵ect we document is in smaller firms (those with less
institutional presence) where limits to arbitrage may be binding and the ability of unin-
5
Our findings are in contrast to Moss, Naughton, and Wang (2020) who find that the retail investors
do not respond to ESG press releases.
5formed or retail investors to a↵ect returns is more pronounced.
This study is closely related to Hartzmark and Sussman (2019) who use the imple-
mentation of Morningstar’s sustainability globes in March 2016 to rate mutual funds.
Highly-rated sustainable funds, those with five “globes,” experience significant inflows af-
ter the introduction of mutual fund sustainability rankings while low-ranked funds, those
with one “globe,” su↵er investors’ withdrawals. While investors trading appears to be
related to the fund rating, the authors do not find any e↵ect on fund performance. Un-
like Hartzmark and Sussman (2019), we investigate the potential consequences of ESG
ratings saliency for individual firms. In contrast to their results for mutual funds, we find
that investors’ ESG preferences have the capacity to exert significant price pressure on
individual stocks and by extension, a↵ect the cost of capital.
Our work is complementary to a broader literature investigating the impact of ESG-
related risk on asset prices. Both theoretical and empirical papers have examined whether
sustainability should be included in a modified CAPM (Merton (1987), Fama and French
(2007), Pedersen, Fitzgibbons, and Pomorski (2020), and Pástor, Stambaugh, and Taylor
(2020)), specific ESG-related risk factors (Hong and Kacperczyk (2009), Hong, Li, and Xu
(2019), Bolton and Kacperczyk (2021) and Hsu, Li, and Tsou (2020)), and on drivers of
investors preferences for sustainable investments (Bialkowski and Starks (2016), Barber,
Morse, and Yasuda (2021), Riedl and Smeets (2017), Alok, Kumar, and Wermers (2020),
Krueger, Sautner, and Starks (2020), and Ilhan, Sautner, and Vilkov (2021)).
Unlike those studies, however, our empirical setup allows us to disentangle the e↵ect on
asset prices of investor preferences for sustainability that is devoid of any change in either
the firm’s cash flows or ESG activities. We provide empirical support for Pedersen et al.’s
(2020) proposed ESG-adjusted capital asset pricing model by showing that changes to a
firm’s perceived ESG performance may cause investor to trade and exert short-term price
pressure on a↵ected stocks. Our findings show the importance of “Type-M” investors,
6those investors that use ESG information and have preference for good ESG scores on
asset prices.
Furthermore, our findings support the theoretical predictions of Goldstein, Kopytov,
Shen, and Xiang (2021) who present a model in which firms have a monetary (cash
flow) and non-monetary (e.g. carbon emissions) component and information is processed
di↵erently for each of these components depending on the investor’s preference for sustain-
ability. Traditional investors value only the monetary component while “green” investors
value both the non-monetary component and the monetary component If ESG ratings
are a proxy for the non-monetary component and retail investors are more likely to be
green investors, our confirm that “di↵erential use of information by traditional and green
investors have several profound impacts on the stock price.”
Our setting is unique in that we are using investor confusion to shed light on the
salience of ESG ratings. We are not, however, the first to find that investor confusion can
a↵ect asset prices. Rashes (2001) notes that investors may confuse one ticker symbol for
another and this mix up causes comovement among similar firms. Using an experimental
setting, Kirchler, Huber, and Stöckl (2012) find that investor confusion about firms’
fundamental values can create bubbles. Moreover, our results confirm Hirshleifer (2001)
who states that “misperception that derives from a fundamental human psychological
trait can remain important for asset prices. . . .”
Finally, we contribute to the literature on information intermediaries – in particular,
rating agencies. When rating agencies incorporate fundamental information, they allow
investors to make better investment decisions. Investors’ blind reliance on ratings, how-
ever, can lead them astray, as evidenced by investors’ use of credit ratings during the
financial crisis. Many studies highlight potential problems in these ratings.6 Unlike the
components of credit ratings, di↵erent ESG rating providers incorporate and weight com-
6
Ashcraft (2010), Biglaiser (1993), Lizzeri (1999), Griffin and Tang (2011), and Bolton, Freixas, and
Shapiro (2012) to name a few. For a review of the literature see Sangiorgi and Spatt (2017).
7ponents of sustainability di↵erently making ESG ratings oftentimes incompatible (Chat-
terji, Durand, Levine, and Touboul, 2016; Chatterji, Levine, and To↵el, 2009; Semenova
and Hassel, 2015; Dorfleitner, Halbritter, and Nguyen, 2015; Delmas and Blass, 2010;
Berg, Koelbel, and Rigobon, 2019; Billio, Costola, Hristova, Latino, and Pelizzon, 2020;
Berg, Fabisik, and Sautner, 2020), which increases the possibility of investor confusion.7
Despite this fact, investors appear to value the ratings on sustainability for investment
decisions (Hartzmark and Sussman, 2019; Cao, Titman, Zhan, and Zhang, 2020). Thus,
our results suggest that blind reliance on these ratings without independent information
production might lead investors to make sub-optimal choices (Malenko and Shen, 2016).
2 ESG Rating Methodology Change
Through a third-party vendor (Sustainalytics), Morningstar has provided sustainability
(ESG) ratings for over 40,000 mutual funds and 75,000 companies worldwide since 2016
and 2018, respectively.8 In September 2018, Sustainalytics launched its new enhanced
ESG Risk rating.9 Morningstar’s adoption of the new Sustainalytics ESG Risk rating was
delayed until October 2019 when it first disclosed the September 2019 ESG Risk ratings.
Sustainalytics ESG ratings are also publicly available on Yahoo! Finance’s website and
an examination of the time-series of ESG ratings on Morningstar and Yahoo! Finance
indicates that both platforms adopted the new methodology at the same time.10 Figure
7
Regulators have also raised concerns about the challenges and importance of regulating ESG rat-
ings. See https://www.esma.europa.eu/press-news/esma-news/esma-calls-legislative-action-esg-ratings-
and-assessment-tools and https://www.sec.gov/oiea/investor-alerts-and-bulletins/environmental-social-
and-governance-esg-funds-investor-bulletin.
8
Morningstar acquired a 40% stake in Sustainalytics in 2017 and purchased the remaining 60% in
April 2020.
9
Sustainalytics still produces the old ESG rating for legacy clients and continued to provide
it to clients during the transition period for adopters (https://www.sustainalytics.com/sustainable-
finance/2019/04/26/webinar-understanding-esg-risk-ratings-2/).
10
Yahoo! Finance has been providing sustainability ratings from Sustainalytics for more than 2,000
companies since February 1, 2018 (https://www.sustainalytics.com/esg-investing-news/yahoo-finance-
adds-sustainability-scores/).
81 shows the time series of Sustainalytics ESG ratings methodologies and the subsequent
adoption by Morningstar and Yahoo! Finance.11
Under the old ESG rating, a company was evaluated with respect to “its general
preparedness to address its ESG risks and opportunities on an industry-relative basis.”12
The old ESG rating was on a scale from 0 to 100 and a firm with a high ESG rating
was considered to be a leader in managing ESG risks within an industry. According to
Morningstar, “To a large degree, it (the old ESG rating) was focused only on what is
called “managed risk” without regard to how much ESG risk exposure a company faced
in the first place.”13 One drawback to the old ESG rating was the inability of investors
to compare companies’ ESG scores across industries.
To address the problem of comparability and to update the score to better reflect ESG
risk exposure, Sustainalytics introduced a new rating, “ESG Risk,” that first identifies
the material ESG risks in each industry. For example, “in the integrated oil and gas
industry, greenhouse-gas emissions, other emissions, e✏uents and waste from operations,
management of human capital, community relations, and bribery and corruption issues
have been identified by Sustainalytics as the key material ESG risks. By contrast, in the
enterprise and infrastructure software industry, the most important material ESG risks
include data privacy and security issues, management of human capital, and corporate
governance.”14 Thus, companies in di↵erent industries may have a distinct set of material
ESG risks and each of these risks have a unique weighting depending on their importance.
In addition, the ESG Risk rating then incorporates any risk mitigation activities by the
firm and determines the ESG Risk rating based on the unmanaged ESG risk exposure.15
11
Note the name changed on Morningstar and Yahoo! Finance from “ESG” ratings to “ESG Risk”
ratings in October 2019.
12
https://www.morningstar.com/articles/954595/enhancement-to-sustainability-rating-emphasizes-
material-esg-risk.
13
Ibid
14
Ibid
15
Note that the new ESG Risk rating eliminates the complicated calculation that included
a deduction for a company’s involvement in ESG-related controversies under the old rat-
9Finally, all ESG risks are standardized so they are on the same scale across all economic
sectors.16
Sustainalytics implemented one additional change to the ratings, in order to make
their interpretation easier, and this change is independent of any information regarding
the firm’s ESG risk exposure. Although the new ESG Risk rating is still between 0 and
100, the scale is inverted. After the methodology change, a firm with a low exposure to
ESG risk is given a low ESG Risk rating, rather than a high ESG rating as under the
prior rating regime. Morningstar provides an example of how the methodology changes
the interpretation of the ESG risk exposure:17
For example, in the older company ratings, Royal Dutch Shell and Microsoft
both scored 75 out of 100 within their industry groups, ranking in the best
quartile among their peers. (Higher scores were better in this version.) These
were good scores, indicating the two companies were among the best-in-class
ESG performers in their respective peer groups. At the portfolio level, assum-
ing their position size was the same, they would have had the same impact
on the Portfolio Sustainability Score.
In the new company ESG Risk rating, by contrast, Royal Dutch Shell’s score is
34, an indicator of High ESG Risk, while Microsoft’s score is 13.8, an indicator
of Low ESG Risk. While both companies do reasonably well managing the
material ESG risks they face relative to their peers–one reason why their old
scores were similar–Royal Dutch Shell operates in an industry that carries
far more ESG risk exposure. As a result, its ESG Risk rating has a much
more negative impact on the Portfolio Sustainability Score compared with
Microsoft’s rating.
That said, the new rating remains sensitive to best-in-class comparisons. For
example, a portfolio that holds an oil company would be better o↵ with expo-
sure to Royal Dutch Shell, with its ESG Risk rating of 34, than with exposure
to ExxonMobil, which has an ESG Risk rating of 40.5.
ing – https://www.morningstar.com/articles/954595/enhancement-to-sustainability-rating-emphasizes-
material-esg-risk.
16
This discussion only briefly describes a more complicated methodology as we do
not focus on the specific information content of the new ratings. For more in-
formation on how the ESG Risk ratings are calculated, see https://globalaccess-
tutorials.s3.amazonaws.com/ESG%20Risk%20Rating Methodology%20document.pdf.
17
https://www.morningstar.com/articles/954595/enhancement-to-sustainability-rating-emphasizes-
material-esg-risk.
10The new methodology and the subsequent change in the ESG rating may create
some confusion for unsophisticated investors, at least in the short-term. If some investors
incorporate the ESG rating in their portfolio but do not understand that the scoring scale
has been inverted, then they may make incorrect investment decisions. Thus, we predict
that less sophisticated investors, those that are most likely to rely on information from
readily available sources such as Morningstar and Yahoo! Finance, are expected to simply
respond to the change in the rating without understanding the specific details of the new
rating methodology. In other words, retail investors may be unaware of the components
of the rating change and interpret a reduction in the ESG rating as a “downgrade” or
worse score, and an increase as an “upgrade” or better score, even when this may not be
the case. If investors value ESG ratings, then this confusion should result in purchases
of firms with an increase in their ESG rating and sales of firms with a decrease in their
ESG rating. These actions are expected to a↵ect asset prices and their e↵ect is not due
to any new fundamental information regarding the company but simply the salience of
ESG ratings.
Institutional investors, however, are expected to respond to the new methodology as
intended (e.g., purchasing firms with better ratings) or not at all because they either
have access to the new Sustainability Risk ratings prior to October 2019 so the adoption
by Morningstar and Yahoo! Finance has already been incorporated into their portfolio
decisions and/or are able to better understand the construction and information content
of the new ESG Risk rating.
Finally, since the announcement of the ratings change was made by Morningstar in
July 2019, we predict that short sellers may take advantage of the possibility of unsophis-
ticated investor misinterpretation. If so, then we expect an increase (a decrease) in short
selling for firms that experience a decline (increase) in their ESG ratings.
As we note above, the change in the ESG rating under the new methodology could
11contain new information on the ESG risk exposure of the firm that may be relevant
to investors. It is important, therefore, to isolate this new information in order to test
whether some investors misinterpret the nature of the rating change rather than rationally
respond to a change in ESG risk. We do this in several ways that will be discussed in
more detail later in the next section. First, we control for any change in the relative
ranking of the firm in terms of ESG scores. As noted in the example above, Microsoft’s
ranking among all firms is unlikely to change after the adoption of the new methodology.
In contrast, Royal Dutch Shell’s ranking is likely to worsen because it was highly ranked
in its industry before but is considered to have more ESG risk exposure relative to other
firms after.
Second, we control for whether the firm had a change in its Morningstar ESG Rating
Assessment, which is similar to the globe rating used in the Morningstar Sustainability
Rating for funds (Hartzmark and Sussman (2019) and hereafter referred to as “Morn-
ingstar Classification”). Finally, during the quarter preceding the rating change, a firm
may have an ESG event that could a↵ect its rating. For example, an oil and gas company
might experience an oil spill in September 2019 that could change its ESG Risk rating
but the e↵ect of this event on ESG exposure on ratings would be difficult to determine
as it coincides with the adoption of the new ESG Risk rating by Morningstar and Yahoo!
Finance. Since we have the firm’s Sustainalytics ESG Risk rating during the pre-adoption
period, we can control for any actual changes in the ESG Risk rating around this time
that might reflect a change in a firm’s ESG exposure or activities.
3 Data and Variable Construction
We collect ESG ratings from two sources for all companies trading on the NYSE, NAS-
DAQ, and Amex exchanges between June 2019 and January 2020. First, we obtain both
the old ESG rating and the new ESG Risk ratings from Morningstar Direct and confirm
12that the same ratings are reported on Yahoo! Finance. Second, we collect the new ESG
Risk ratings during the transition period (June 2019 to September 2019) from Sustaina-
lytics.
Morningstar reports Sustainalytics monthly ESG ratings at the beginning of the fol-
lowing month, therefore, the first time the new September ESG Risk rating is available
is at the beginning of October 2019. Thus, we define an indicator variable, Postt , equal
to one if the month is equal to or later than October 2019 to capture the post-adoption
period of the new ESG Risk rating.
We define four measures that capture the change in firm’s ESG rating as reported
by Morningstar and Yahoo! Finance. First, ESGi is defined as the di↵erence in stock
i’s ESG rating between October 2019 (the first month when the new ESG Risk rating
is available at Morningstar and Yahoo! Finance) and September 2019 (the last month
before the adoption of the new methodology). Second, ESGi is the di↵erence between
the average new ESG Risk rating in the three months (October-December 2019) after
the adoption and the average old ESG rating in the three months (July-September 2019)
before the adoption of the new methodology by Morningstar and Yahoo! Finance.
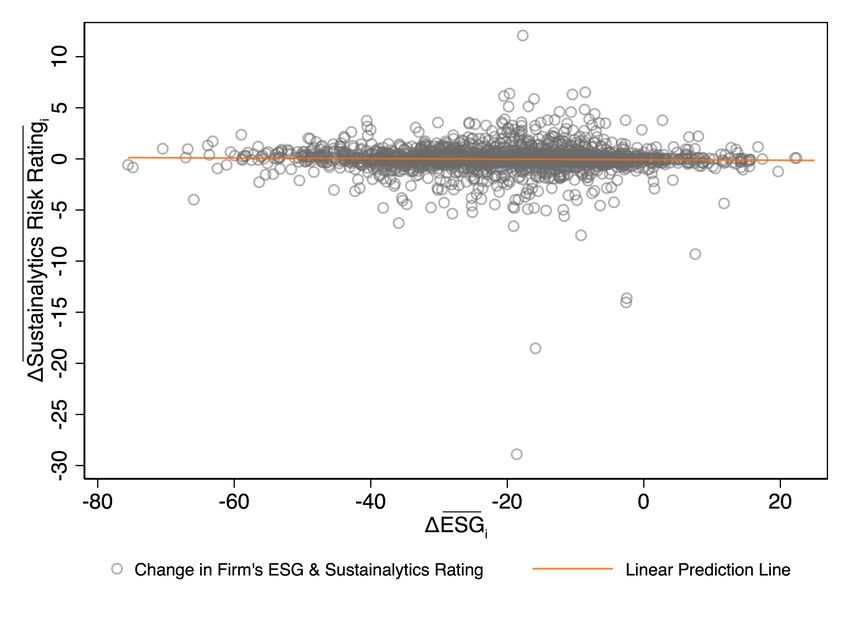
Figure 2 shows the distribution of the average old ESG rating in the three months
(July-September 2019) before the adoption in Panel A and the average new ESG Risk rat-
ing in the three months (October-December 2019) after the adoption of the new method-
ology by Morningstar and Yahoo! Finance in Panel B. The inversion in the ratings is
evident from the two graphs. In Panel A, most firms have an old average ESG rating
between 40 and 80 while in Panel B, most firms have a new average ESG Risk rating
between 10 and 60. In Table 1, Panel A, the average ESG rating was 50.51 and after
the average ESG Risk rating is 30.38, translating into an overall average change of -20.17
(Panel B). Further evidence on the impact of the new methodology on the change in
numerical ratings is in Figure 3. This figure plots the di↵erence between the two ratings,
13ESGi and as can be seen in the figure, most firms experience a decline in their rating.
The last measure of the change in a firm’s ESG ratings are two indicator vari-
ables that isolate the direction of the change in rating. The first indicator variable is
ESG Pseudo- Downgradei that is equal to one if stock i’s change in its average ESG
rating is in the lowest quartile of the ESGi distribution. Firms that have a value of
one for ESG Pseudo-Downgradei have the largest negative change in their ESG rat-
ing. For example, Microsoft has a value of one for this variable because it experienced
a large change in its ESG rating from 75 to 13.8. In other words, firms that have a
ESG Pseudo-Downgradei equal to one generally have very low ESG risk both before
and after the adoption. Moreover, the decline in ESG rating for firms that we classify as
ESG Pseudo-Downgraded is not an indication of worsened ESG exposure. Indeed,
we find that most firms in this category, 86%, are in the same or better Morningstar
Classification after the change.
The second indicator variable is similar to the first but captures whether or not the
firm has been “upgraded.” We define ESG Pseudo-Upgradei as an indicator variable
equal to one if stock i’s pre-adoption ESG rating is lower than its post-adoption ESG
Risk rating. Unlike the previous downgrade indicator variable, we do not restrict an
observation to be in any particular quartile because only 6% of the firms in our sample
experienced an increase in their ESG ratings.
The change in ESG rating reflects not only the inversion of the scale, but also potential
new information on the relative ESG risk of the firm. This new information may cause
some investors to rationally reassess the ESG risk of the firm and trade accordingly. To
control for change in a firm’s ESG risk exposure due to a change in the firm’s underlying
fundamentals, we include three additional variables to confirm the robustness of our
results. The first variable is the change in the relative ranking of the firm before and
after adoption. To construct this variable, we rank each firm from 1 to 2,310 (the number
14of firms in our sample) where one is the firm with the best ESG rating. In the pre-adoption
period, the number one firm would have the highest ESG rating and in the post-adoption
period, the number one firm would have the lowest ESG Risk rating. Ties are given the
same ranking and the next ranking reflects the number of ties in the previous ranking.
We define ESG Ranki as the di↵erence in the stock’s relative ranking, scaled by the
number of firms, in the first month (October) after the adoption and in the last month
(September) before the adoption.
Panel A of Figure 5 shows the distribution of the change in ranking of the firms
around the adoption of the new methodology. Most of the firms have little change in
their ranking as the distribution is centered on zero (also confirmed in Panel B of Table
1) but there are firms who move rankings by more than 25% in either direction.
The second variable that incorporates a potential change in the firm’s actual ESG risk
exposure is the change in the Morningstar Classification. At the time of the adoption
of the new methodology, Morningstar also changed the definition of each “globe” in the
classification but kept the same five-point scale. Table 2 Panel A defines both the old
and the new categories. Under the old ESG rating methodology, firms are assigned to a
classification based upon their ranking in their industry. Under the new ESG Risk rating
methodology, firms are assigned to a classification based upon the level of their ESG Risk
rating. Because there are the same number of categories under both rating regimes, we
define the classifications numerically from 1 to 5 with 1 being the best ESG category and
5 the worst (to mimic our ranking variable).
Table 2 presents the definition of each category and the transition matrix of each
firm’s classification. Fewer firms are classified as having the best ESG risk after adoption
(9 are classified as Negligible or Low) than before adoption (16 are classified as Industry
Leaders). A number of firms move up in their classification after the new methodology
adoption. For example, 265 firms that were in the Average Performer category pre-
15adoption are now in the Low category post-adoption. The majority of firms pre-adoption
are considered average performers (57%) but post-adoption this number drops to only
33%. In the worst ESG categories pre-adoption, Underperformer and Industry Laggard,
a number of firms go down a notch or two in classifications, i.e., their classification
improves. Overall, firms below the diagonal improve their ranking (31%) and firms above
the diagonal worsen their ranking (28%), and those on diagonal do not change their
classification (41%).
Panel B of Figure 5 shows the percentage of firms that move up or down a cate-
gory. As can be seen in the figure, the majority of firms remain in their original clas-
sification, but many move up or down one or two notches. Panel B of Table 1 shows
that the median change in the Morningstar Classification is zero. In order to capture
changes in a firm’s Morningstar Classification, we construct Classification Upgradei
(Classification Downgradei ), an indicator variable equal to one if the stock has an
increase (decrease) in its Morningstar Classification after the adoption of the new method-
ology.
The third variable is designed to capture the change in actual ESG risk over the two
transition months. For example, a firm could experience an ESG event or implement new
policies in September 2019 that could have a↵ected its ESG rating for October irrespective
of the methodology change. Although Morningstar and Yahoo! Finance adopted the
new ESG Risk rating in October 2019, it has been available from Sustainalytics since
September 2018. Sustainalytics Ratingi measures the change in a firm’s ESG Risk
rating between October 2019 and September 2019.
Panel A of Figure 4 shows the change in the Sustainalytics ESG Risk rating be-
fore and after adoption. As shown in the figure and Panel B of Table 1, most firms
do not experience any meaningful change in their ESG Risk rating during the transi-
tion period as most of the distribution is centered at zero. This figure also shows that
16Sustainalytics Ratingi is almost zero (between -5 and +5) for 98.6% of stocks.
Panel C of Table 1 presents the correlation matrix among our variables of interest.
Both ESG Ranki and Morningstar Classification are highly correlated. Thus,
we do not include both of them in the same specification. Otherwise, the correlation
between ESGi and all other variables is generally low.
We are interested in whether investors’ perception regarding the new ESG Risk ratings
a↵ects their trading behavior. Therefore, we collect daily returns, prices, and shares
outstanding from the Center for Research in Security Prices (CRSP). In order to merge
the ESG ratings data with the CRSP stock database, we convert the ISINs of U.S.
companies (starting with ‘US’) from Morningstar to 8-digit CUSIPs. We eliminate small
‘penny’ stocks by requiring that the stock price, at the end of the beginning of the sample
period, be greater than $1.
In order to compute abnormal returns, we download information on daily and monthly
risk factors for Fama and French (1993) three- and Carhart (1997) four-factor model from
Kenneth French’s website. We compute abnormal returns as follows. Using daily stock
excess returns for each firm, we estimate the loadings on the risk factors using 12-month
rolling-window regressions beginning in September 2018 and calculate expected returns.
We compute abnormal returns in the following month by subtracting the firm’s expected
return from its actual return.18
Some types of investors are more likely to be confused by the change in ESG rat-
ing methodology than others. Therefore, we collect information on the participation or
holdings of four di↵erent types of investors: retail, institutional, ESG funds, and short
sellers. We download data on the number of retail investors holding a given stock from
the Robinhood (Robintrack.net) website. Robintrack provides hourly intra-day informa-
18
Our results are robust to using two sub-periods to estimate loadings on risk factors: from July
2018 to June 2019 (for the pre-adoption period) and from October 2018 to September 2019 (for the
post-adoption period).
17tion on the number of investors holding each stock.19 We then average the reported
number of retail investors holding the stock over the day and aggregate the daily means
into monthly averages.20 Following Coval and Sta↵ord (2007), we adjust retail investors’
participation for the size of the company by dividing the mean number of Robinhood
investors holding a stock i in month t, # Retaili,t , by the average dollar trading volume
from April to June 2019 (one quarter before the transition period).21 Finally, we merge
Robinhood data to the CRSP dataset using a stock’s ticker symbol.
We collect quarterly 13F institutional ownership from Thomson Reuters and aggre-
gate holdings across all 13F institutional investors at a stock level. For the purpose of
our analysis, our data consists of 13F long positions for the two quarters surrounding
the adoption of the new ESG Risk rating methodology: at the end of September 2019
(the last quarter-end before the old ESG rating ends being reported) and December 2019
(the first quarter-end after the new ESG Risk rating begins being reported). We com-
pute 13F Ownershipi,t by dividing the aggregated position of a stock held by all 13F
institutions at the end of a quarter by the number of shares outstanding.
Using textual analysis on key words, we classify any U.S. mutual funds actively invest-
ing in U.S. equities in the Morningstar database as an ESG fund if it has the following
strings in its name: esg, sust, impact, rspnb, env, scl, eco (but not “econ”), social, and/or
green. The sample of 58 ESG funds are listed in Appendix A. For each ESG fund, we
obtain data from Morningstar on the number of shares each ESG mutual fund holds at
the end of each quarter surrounding the adoption of the new methodology (September
2019 and December 2019). We do not collect intra-quarter information for two reasons.
First, the data is more widely available at the end of the quarter than in months within
19
In August 2020, Robinhood closed down the API for Robintrack making data available only to this
date.
20
Our results remain unchanged if we use the median number of investors instead.
21
Dividing the number of retail investors by the market capitalization in a previous quarter yields very
similar results.
18the quarter. Second, it makes the determination of the holdings of ESG funds analogous
to the approach used for 13F institutions. We compute ESG Fund Ownershipi,t by
dividing the aggregated position of ESG funds in a firm at the end of a quarter by the
number of shares outstanding.
Last, we collect information from Compustat – Capital IQ on the end of the month
short interest for NYSE, Amex, and NASDAQ firms for the six month period around
the introduction of the new methodology. We then average short interest during the
three months prior to the adoption from July 2019 to September 2019 and during the
three months after the adoption from October 2019 to December 2019.22 We construct
Short Interesti,t by dividing the average number of shares sold short during the pre-
or post-adoption period by the number of shares outstanding during the same period.
Table 1 reports summary statistics for the firms before (July 2019 to September 2019)
and after the Morningstar ESG rating methodology change (October 2019 to December
2019). Consistent with Figures 2 and 3, the average ESG rating declines from 50.51 to
30.38. Mean returns change depending on whether we use a one-, three-, or four-factor
model. Abnormal returns increase over the sample period when estimated with a one-
factor model, and decrease when estimated with a three- or four-factor model. Median
returns exhibit declines from the pre-adoption to the post-adoption period.
The mean number of investors on the Robinhood platform holding a stock increases
slightly in the periods surrounding the introduction of the new ESG Risk ratings. In
the pre-adoption period, there are approximately 2,750 retail investors in a given stock
and in the post-adoption there are 2,920. However, the median number of investors is
much smaller, approximately a tenth the size of the mean. 13F institutional holdings are
roughly similar pre- and post-adoption (approximately 52% of shares outstanding). ESG
Funds hold 0.07% of shares outstanding. On average, around 5.5% of shares outstanding
22
We ignore the short interest reported in the middle of the month, however our results are robust to
its inclusion in the average short interest.
19are shorted and this number is similar across the two time periods.
4 Empirical Results
Our empirical strategy is to test the di↵erences in abnormal returns and ownership sur-
rounding the adoption of the new ESG Risk rating by Morningstar and Yahoo! Finance.
If ESG ratings are salient to investors but some investors are unsophisticated, the change
in methodology may result in misinterpretation about its meaning. In other words, in-
vestors who rely on the ratings available through Morningstar and Yahoo! Finance to
provide them with information about a firm’s ESG exposure but who are unlikely to do
their own due diligence, may mistakenly interpret the inversion of the rating scale in the
wrong way. In this case, we expect that retail investors, who are assumed to be otherwise
uninformed, will interpret a decline in the ESG rating after adoption as bad news and an
increase as good news even when this is not the case.
More sophisticated and informed investors, such as 13F institutions and ESG funds
will either be aware of the implications of the change or will have already previously
incorporated the change through their subscription to Sustainalytics. Finally, short sell-
ers, who are also informed, may take advantage of the uninformed investors confusion
and trade accordingly. Therefore, if enough investors are confused and rebalance their
portfolio based on their confusion, then we expect that abnormal returns will be negative
when the rating declines and positive when the rating increases even after controlling for
any new information that the change in rating may contain. Moreover, we predict that
this e↵ect will be primarily driven by the changes in participation by uninformed or retail
investors and holdings of short sellers, but not by the change in holdings of institutional
investors such as those that report on Form 13F or funds whose primary objective is
sustainable investing.
204.1 Change in abnormal returns
We begin our analysis by examining the e↵ect of the ESG rating methodology change on
the firm’s abnormal returns. We estimate the following di↵erence-in-di↵erences specifi-
cation:
AReti,t = 0 + 1 ESGi ⇥ Postt + di + dt + "i,t , (1)
where AReti,t is stock i’s abnormal return in month t computed with either a single-,
three-, or four-factor model. ESGi captures stock i’s exposure to the change in the
firm’s rating due to the adoption by Morningstar and Yahoo! Finance of the new Sustain-
alytics ESG Risk rating. We measure the change in the ESG rating in four ways: as the
change between September 2019 and October 2019 (calculated as the di↵erence between a
firm’s ESG Risk rating in October 2019 and its ESG rating in September 2019), ESGi ,
and as the average change over three month periods after and three months before the
adoption, ESGi . We also use two indicator variables to capture the direction of the
ESG rating change: ESG Pseudo-Downgradei and ESG Pseudo-Upgradei . di
and dt represent firm and month fixed e↵ects. Standard errors are clustered at a firm
level.23
If our conjectures about the e↵ect of investor confusion are correct, then we expect
the coefficient on the interaction terms that include our measures of ESG rating changes
to be positive and significant, i.e., a decline (increase) in ESGi would induce investors
to sell (buy) the stock causing negative (positive) abnormal returns from October 2019
onward. We report the regression estimates of equation (1) in Table 3. Panel A presents
the baseline regression. Single-factor abnormal returns are presented in columns (1) to
(4), three-factor abnormal returns are presented in columns (5) to (8), and in the last
23
Our time-series consists of only six months around the methodology adoption. According to Angrist
and Pischke (2008), six clusters is not enough for the standard cluster adjustment. See, Chapter 8.2.3
‘Fewer than 42 Clusters’ of Mostly Harmless Econometrics for more details.
21four columns, we show Carhart (1997) four-factor abnormal returns.
The coefficient estimates on the interaction terms, ESGi ⇥ Postt and ESGi ⇥
Postt , are indeed positive and highly statistically significant in all specifications, regard-
less of how abnormal returns are constructed. This implies that firms that have greater
declines (increases) in their new ESG Risk rating relative to their old ESG rating, expe-
rience more negative (positive) abnormal returns after adoption. In terms of economic
significance, a one standard deviation decrease in firm’s ESG rating translates into more
than 1 percentage point drop in monthly abnormal return regardless of the return model
employed.
To further understand the relationship between the change in the ESG rating and
abnormal returns, we investigate whether abnormal returns are di↵erentially impacted by
firms that experience large ESG rating declines, Pseudo-ESG Downgradei and firms
that experience an increase in their rating, ESG Pseudo-Upgradei . In columns (3),
(7), and (11), we compare the average abnormal returns of firms with very large negative
changes in their ESG ratings to the abnormal returns of all other firms. The coefficient on
the interaction term, ESG Pseudo-Downgradei ⇥ Postt , is negative and statistically
significant indicating that returns are lower for firms that have very large declines in
the ESG ratings compared to all other firms. In economic terms, this translates to a
decrease of between 1% and 2% monthly returns depending on the specification. As noted
previously, the majority of the firms that have a value of one for Downgradei also do not
experience any change in their Morningstar Classification. This is preliminary evidence
that the decline in abnormal returns we document is most likely due to a misinterpretation
in the meaning of the ratings change and is unlikely to be driven by investors rationally
trading on new information, i.e., it is evidence of the salience of ESG ratings on stock
prices.
In columns (4), (8), and (12), we include the ESG Pseudo-Upgradei ⇥ Postt to
22the specification. We find that this interaction term is positive (it ranges between 3.215%
and 4.340%) and statistically significant indicating that firms that experience an increase
in their ESG ratings have higher abnormal returns after adoption than firms that do not.
The coefficient on Pseudo-Downgradei ⇥ Postt remains negative and highly statisti-
cally significant. To better understand the relationship between the change in ESG rating
and abnormal returns, we use a semi-parametric regression as in Goldstein, Jiang, and
Ng (2017) where the relationship between ESG ratings and abnormal returns is allowed
to assume a flexible function form. The regression specification has as the dependent
variable, the firm’s change in its single-factor abnormal return and as the independent
variable, the demeaned change in a firm’s average ESG rating after adoption. Figure 6
presents the outcome of this analysis. The orange horizontal dashed line represents the
zero change in a firm’s abnormal return while the vertical dashed line represents the mean
change in ESG rating. The shaded area represents the 95% confidence interval.
It is evident from the graph that the change in a firm’s abnormal returns is associated
with a corresponding change in ESG rating relative to the mean. The change in abnormal
returns is declining as the change in ESG rating becomes more negative and is increasing
as the change in ESG rating becomes more positive. These results suggest that investors
who value ESG ratings in their investment decision have an impact on stock returns
even when they may incorrectly assess the meaning of the change in the firm’s ESG risk
exposure. Next, we strengthen our argument that confusion is driving the results by
examining both the impact of potential new information on returns as well as restricting
the sample to only those firms for which the interpretation of the change is unambiguous.
4.1.1 E↵ect of new information on abnormal returns
In order to disentangle the inversion of the scale from new information about a firm’s ESG
risk exposure conveyed by the change in methodology, we control for two possible types
23of new information. The first is the possibility that an ESG event may occur during
the transition from the old ESG rating to the new ESG Risk rating. Using the same
specifications as in Panel A of Table 3, we add Sustainalytics Ratingi , the change
in the Sustainalytics Risk rating over the transition period, as an independent variable
in Panels B and C of the table.
We also incorporate additional information that is generated by virtue of the new Sus-
tainalytics ratings methodology on the change in the relative ESG risk of the firm by con-
trolling for ESG Ranki in Panel B, which is the di↵erence in the stock’s relative ESG
Risk ranking among all other firms and Classification Upgradei (Classification
Downgradei ) in Panel C, which is an indicator variable equal to one if the firm becomes
less (more) ESG risky according to the Morningstar Classification after the adoption of
the new methodology.
In Panel B of Table 3, the coefficient of Sustainalytics Ratingi is never signifi-
cant indicating that a change in the Sustainalytics ESG Risk rating from October 2019 to
September 2019 does not impact returns. In other words, most firms do not experience
an ESG event that could a↵ect investors’ trading behavior and their impact on stock
returns.
The coefficient of the change in the relative ranking of the firm, ESG Ranki , is
marginally significant in columns (1)-(4) where the dependent variable is the single-factor
abnormal return and the sign is in the correct direction. Abnormal returns are higher
if the firm’s rank gets better (lower). The coefficient on this variable is insignificant in
all other remaining columns when additional factors are included in the abnormal return
model. More importantly, the inclusion of these variables does not change the overall
significance or the size of the coefficients on any of our main independent variables from
Panel A or the level of the R2 .
A similar conclusion can be drawn from Panel C of Table 3. This panel includes
24whether the firm experiences a downgrade or an upgrade in its Morningstar Classifi-
cation. The coefficients on the Morningstar Classification upgrade variable are always
insignificant and remain generally insignificant for the Morningstar Classification down-
grade variable. As with the prior panel, the statistical significance of the change in ESG
ratings variables and the R2 of the specifications remain una↵ected compared to Panel
A. Thus, we conclude that both Panels B and C support our assumption that the rela-
tionship between the change in ESG rating after the adoption of the new methodology
and subsequent abnormal returns is due to investor misinterpretation and not to new
information about the firm’s ESG risk exposure.
Finally, we provide further confirmation that investor misinterpretation is the likely
driver of our results in Table 4. This table replicates our baseline analysis but restricts the
sample to firms whose interpretation of the ratings change is clear. We use a subsample
of firms that experience a decline in their ESG ratings but have either no corresponding
change or an improvement in their relative sustainability ranking.24 In other words, this
subsample consists of firms similarly or better ranked under the new ratings regime as
under the old ratings regime. Thus, we exclude the possibility that an informed investor
would view these firms as having been correctly downgraded in terms of ESG ratings
after the adoption and therefore, be motivated to sell the security. Approximately 50%
of the firms in our sample meet these criteria.
Uninformed investors, however, will simply look to the ratings change without un-
derstanding the implications or doing due diligence. If our results are driven by the
misperception of unsophisticated investors that a firm’s ESG risk exposure has increased
when its rating declines, then our results should remain the same when we restrict the
sample to these firms. Table 4 presents the results for this set of firms and they remain
similar to the results for the full sample. The coefficients of ESGi and the correspond-
24
Our results are robust to restricting the sample of firms with negative changes in their ESG ranking
and also have no change or an upgrade in their Morningstar Classification.
25ing R2 are relatively similar to Panel A of Table 3. As further evidence that investors are
confused by the new rating methodology, the best firms in terms of ESG risk exposure,
those in the lowest quartile of changes in ESG rating, continue to experience negative
abnormal returns. We find that the coefficient on ESG Pseudo-Downgradei ⇥ Postt
is negative and significant. (Note there is no ESG Pseudo-Upgradei by construction.)
Overall, these results highlight the importance of ESG ratings for investors and the po-
tential for investors’ misinterpretation of these ratings to have a significant impact on
firms’ abnormal returns.
4.1.2 The dynamics of abnormal returns
The findings of the previous section indicate that investor reliance on ESG ratings and
their confusion about the new methodology impacts stock prices. This impact, however,
should be short-lived and ultimately reversed as investors recognize their error and reverse
their positions and/or market forces correct it. To test whether this is the case, we
estimate a dynamic version of the regression equation (1) as follows (Célerier and Matray,
2019):
5
X
AReti,t = 0 + e ESG Pseudo-Downgradei ⇥ d(e)t + di + dt + "i,t , (2)
e= 4, e6= 1
where AReti,t is the abnormal four-factor monthly return and d(e)t is equal to one
exactly e periods after (or before if e is negative) the implementation of the new ESG
rating methodology. We use September 2019 as the reference month. di and dt denote
stock and year-month fixed e↵ects and standard errors are clustered by firm. The main
coefficient of interest is e, that captures the di↵erential e↵ect over time for firms that
experience the most severe decline in the value of their ESG rating (treated firms where
ESG Pseudo-Downgrade=1), against those that have less severe declines (control
firms where ESG Pseudo-Downgrade=0). We expect that the di↵erence in abnormal
26returns will become more negative after the adoption as investor confusion is greatest for
firms with the largest declines in their ESG rating. The di↵erence in returns will most
likely reverse once confused investors become informed about the implications of the new
methodology or arbitrageurs eliminate the e↵ect.
Figure 7 plots the e coefficients together with the 95% confidence intervals. In the
months prior to the adoption of the new methodology, the two types of firms do not
have statistically significant di↵erences in their abnormal returns relative to September
2019. Once Morningstar and Yahoo! Finance begin disclosing the new ESG Risk ratings
in October, firms with the largest declines in their ESG ratings begin to experience
significantly lower abnormal returns than control firms and this becomes most pronounced
in November 2019. The magnitude of the e↵ect is quite large as the abnormal returns of
the ESG Pseudo-Downgraded firms drop by 2.5 percentage points more than the control
firms one month after the methodology change. However, this di↵erence in returns is
short-lived and persists only until January 2020 when the gap between the abnormal
returns of the treated and control firms again begins to converge. By the end of February
2020, five months after the adoption, the abnormal returns between the two types of firms
are no longer statistically di↵erent. Thus, any investor confusion about the meaning of
the change in ESG rating methodology has been either clarified or its e↵ect eliminated a
few months after adoption.
The results of this section suggest that investors find ESG ratings salient even when
they may be confused about their interpretation. When investors believe a firm’s ESG
risk has increased, their trading behavior results in negative abnormal returns, at least
in the short-run. Next, we examine whose trading behavior may be driving the change
in stock prices.
27You can also read