Ryan Packer, Bank of New Zealand
←
→
Page content transcription
If your browser does not render page correctly, please read the page content below
Paper 2698-2018
Analytics in the Cloud, Cross Functional Teams, and Apache Hadoop is not
                                 a Thing
                                  Ryan Packer, Bank of New Zealand

ABSTRACT
Digital analytics is no longer just about tracking the number of visits to a page or the traffic from a
campaign. Now the questions are about user experience and customer journeys. To answer these
questions, we need a new breed of tracking tools and new ways of analyzing the data.

The Bank of New Zealand recently implemented SAS® Customer Intelligence 360. Over the last year, we
would have done proof of concepts across multiple channels, made architecture decisions (and then
remade them), integrated it into all our customer-facing digital channels, brought the data into our big data
platform, provided near real-time reports and got our agile development teams using it.

"One line of JavaScript" is the famous phrase spouted by people selling digital analytics platforms. So
what does it take to get that one line of code working and what else is really needed? What lessons have
we learned when implementing SAS® 360 Discover across our website, two internet banking platforms,
and two mobile apps?

Now that the hard part is done and we can track Customer A across all our platforms, what can we do
with this? We need a way to analyze the huge volumes of data, blend in our offline data, and present this
information to the business user and to our data scientists. In this paper, we explore how we used the
Apache Hadoop ecosystem to build out our customer data hub to arrive at a "segment of one".

INTRODUCTION
The Bank of New Zealand (BNZ) was facing a challenge common to many businesses - we wanted to
know more about how our customers were interacting with us. With an increasingly higher proportion of
our customers and potential customers choosing to interact with us digitally, we needed to be able to
track and analyse their actions and journeys across their entire digital experience.
After evaluating various tools, and doing a proof of concept with our developers, we chose to implement
SAS® Discover; part of the SAS® Customer Intelligence 360 platform. This is a cloud-based analytics tool
that enables seamless data capture from multiple platforms. We can now apply rules to categorise what
we collect and track new elements and goals without releasing new code. Finally, it provides a usable
data model for our analytics team to use. Implementing this meant coordinating the backlog of multiple
teams, getting design and governance signoffs, creating ways to identify our customers and then getting
that data back into our on-premise big data platform, where we were able to join it with our existing
customer analytics.
The first part of this paper will outline some of the challenges and lessons we learned in our journey to
deliver this to the business. The second part will cover a brief intro to Hadoop and how we used it as a big
data engine for digital analytics.

BACKGROUND
BNZ is one of New Zealand’s largest banks. We have over 150 Stores and 30 Partners Centers
nationwide. We have over 5,000 staff, including a digital team of over 250. Over 80% of our customer
interactions are through our digital channels; this could be transferring money using one of our mobile
applications, changing home loan repayments in our Internet Banking application, creating new users in
Internet Banking for Business, researching term deposit rates or applying for a credit card on our
unauthenticated website.

                                                       1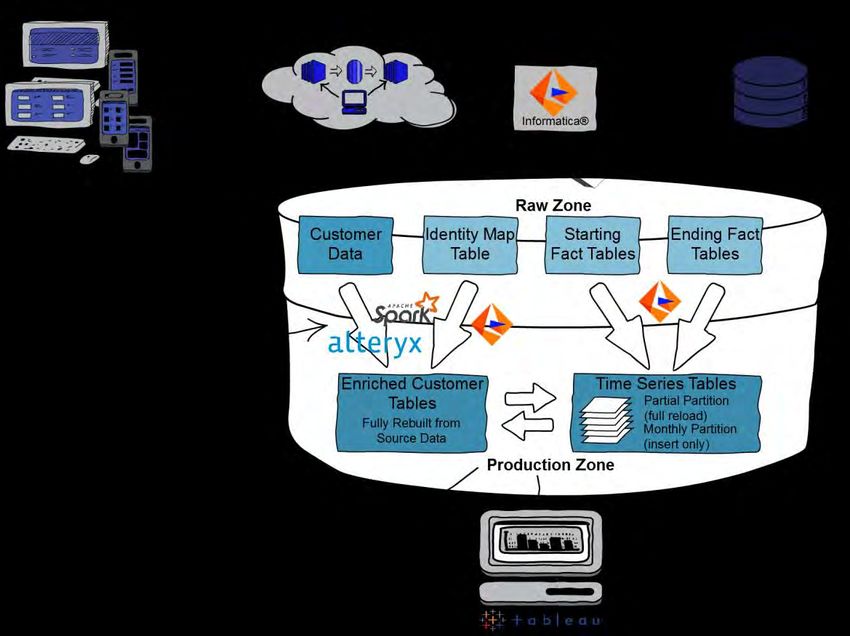
Within BNZ Digital, we think of our digital platforms as split into three key channels (Figure 1). The
unauthenticated website (often referred to as www) which acts as an information portal and has
information on our products, sales capability as well as help and support content. For our personal
banking customers, we have Internet Banking, which is the browser-based client, as well as mobile apps
where our customers can check balances, transact on their accounts and service the products they hold.
Similarly, for our business customers we have Internet Banking for Business, a browser-based banking
application, as well as our mobile business banking applications.

Figure 1. Digital Channels

We have a strong digital analytics and insights team, which over the last five years has built out various
ways to track and analyse what our users are doing. However, knowing where to go to get the data to
answer a business question is starting to require more and more domain knowledge. We needed to
simplify the way we were collecting data because our existing methods were highly siloed (Figure 2).
Some platforms used Google Analytics but this only provided aggregated data. Other channels had
bespoke logging, but any change required a code change in the application and a production release.
Some parts of the applications were also using old legacy logging tables. To help us simplify our data
collection, we decided to implement SAS® Discover.

Figure 2. Example Customer Journey

                                                     2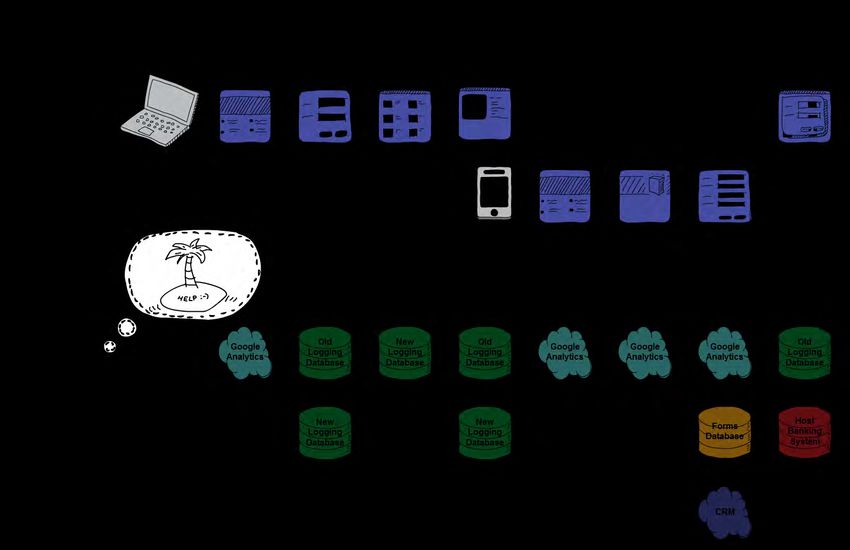
ANALYTICS IN THE CLOUD
IMPLEMENTATION
To successfully implement SAS® Discover we needed to get it into our three browser-based platforms and
four mobile apps. So, we set up a cross functional team comprising the skills we needed from each of the
channels. This allowed us to quickly implement the tool in the same way across multiple platforms, and
established a core set of people with the technical skill to support it going forward. However, trying to
coordinate with five different teams, each with its own set of priorities proved impractical. We would need
a new plan if we wanted to start getting immediate value out of the tool, so we split the implementation
into two phases:
1. Phase 1 - Insert the Javascript and SDK into each channel. This was a small task that could be
   added to the backlog of each of the teams with no other dependencies.
2. Phase 2
    2.1. Track customer identities. This involved creating a new hashed identifier for our customers, then
         developing a method to send that identity to SAS® Discover when a customer logged in on any
         channel.
    2.2. Pull SAS® Discover from the cloud to our on-premise Cloudera® Hadoop cluster.
    2.3. Reverse the hash so we could use the identities.
    2.4. Build a visual analytics suite.

RISK VS THE CLOUD
As in any large company, and in particular a bank, everything needs to be managed within an accepted
level of risk. One of the first requirements was to be able to capture as much data as possible. Only
tracking what we had initially identified would lead to large data gaps and no ability to create baselines in
the future. Our initial approach was to specifically exclude personally identifiable information (names,
addresses, etc.) from being captured. This made it easier to ensure the project stayed within approved
risk parameters.
We also wanted to collect form data, leverage existing logging, as well as be prepared for circumstances
we hadn’t yet considered. SAS® Discover has built-in functionality to turn data capture on or off, or mask
data at both a form and a field level, but it doesn’t trigger this based on the value. This meant we would
need to identify every form on the website and field in our applications and determine if it could potentially
contain one of the excluded data types. The sheer size of the analysis to identify all potential forms and
fields as well as the ongoing maintenance to ensure future collection quickly proved unfeasible.
SAS® Discover encrypts data in motion as well as at rest and uses a series of the AWS tools, such as
automated key rotation. There is also a strong logical data separation between our data and other client’s,
as well as strong user controls from SAS who has administrative access. As the final data was integrated
back into our on-premise data stores we were also able to limit the length of time that the data was kept in
the cloud. With these controls in place from SAS and a review by our risk and security teams we can now
collect all the data that we need using our cloud-based analytics tool.

FINAL DEPLOYMENT

                                                      3
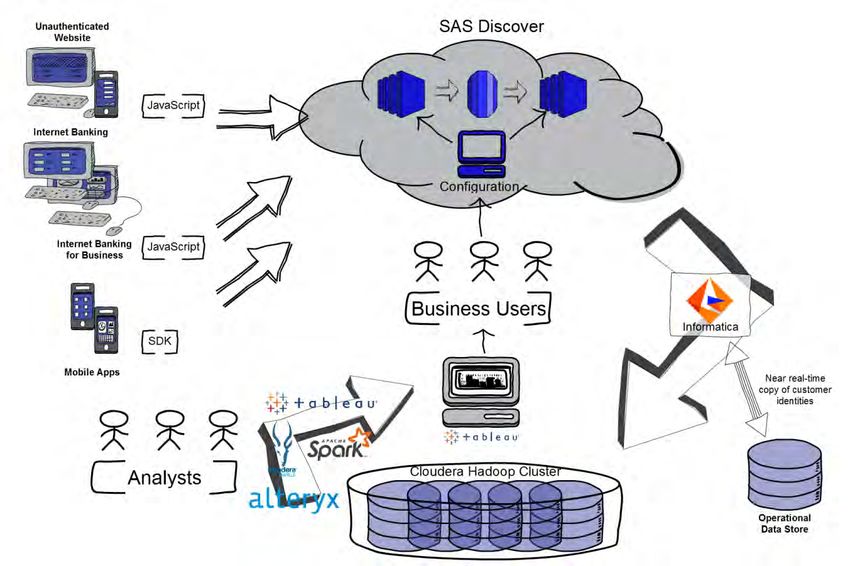
With resources finally secured and risk signoff obtained, we successfully deployed SAS® Discover. The
final design can be seen in Figure 3:
1. All five of our channels are connected to SAS® Discover. We are able to track our users as they
   move between desktop channels or even use multiple devices at the same time.
2. Business users are able to create rules to group pages and screens together, and determine goals
   and business processes they want to track.
3. The raw data flows back into to the BNZ ecosystem using Informatica® via the SAS® Discover REST
   API. New data is available on an hourly basis with any extra business rules applied.
4. Business users can use a suite of visual analytics in Tableau® to answer the majority of their
   questions.
5. The analytics team is also able to use the raw data to generate insights or build advanced models.

Figure 3. Design

HADOOP IS NOT A THING
Most analysts and business users are used to a traditional set of analytics tools (See Figure 4). We are
used to homogenous tools that provide us with:
1. A data storage mechanism: usually some sort of table made of columns containing a type of data
2. A way to import new data into the table
3. A way to manipulate the data, either through a visual editor or code
4. A way to view the output in a table or graph
5. A way to export data

                                                    4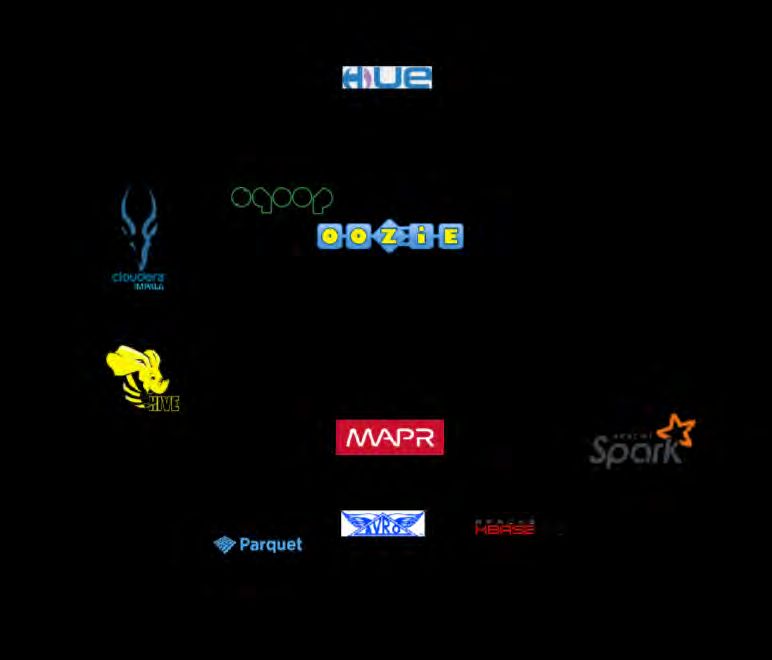
To use those tools, analysts need to learn one tool, what it can and cannot do and how to manipulate the
data. When first using Hadoop, most users assume it will be the same, only more powerful and able to
analyse vast quantities of different types of data.

                                        Figure 4. Analytics Tools
They are inevitably wrong. Hadoop is, in fact, an ecosystem of open source projects that fit loosely
together and look something more like Figure 5. The core of Hadoop is made up of two projects: HDFS
and MapReduce. These two core components started this type of distributed processing. Let’s revisit our
processing steps in a Hadoop centric way:
1. Data Storage Mechanism. Data is stored in a distributed file system called HDFS. Unlike traditional
   analytics tools it works like a folder on your computer and can take any type of file. The most common
   files for the analyst to load are CSVs or text files, but HDFS can support unstructured tests such as
   log files, JSONs or images. It also has some extra formats for storing data. In particular, Parquet files
   form the closest analogy to the traditional table, they are highly typed and the columns have specific
   names. Parquet also uses column instead of row based storage, which makes it ideal for the big
   wide tables that you often get in big data.
2. Importing Data. Hadoop has many ways to import data: Sqoop for reading and writing from relational
   databases, Flume for dealing with streams, and WebHDFS for files via a REST API. While some of
   these tools can perform minor transformations, they are only really good at landing the original data
   into HDFS.
3. When it comes to data manipulation, there is plenty of choice. MapReduce is a java based language
   that uses HDFS’s native functionality. Hive has been built on this to provide a familiar SQL interface.
   Impala uses the table metadata from Hive but performs much faster, thanks to its in-memory engine.
   Finally, Spark is a vastly powerful data engine that has Python and R APIs for Data Science and
   Machine Learning. Learning each of these, their strengths and limitations and how to combine them
   into an analytics pipeline is much more complex than traditional tools.
4. A way to output the data. Cloudera Hue provides a quick way to interact directly with the cluster, but
   lacks much of the visual output we are used to from tools like SAS®. Thankfully the SQL engines
   provide connectors to modern visualization tools like Tableau®.
5. Due to the massive nature of much of the data on Hadoop, it’s often best to just leave the data there.

                                                     5
Figure 5. Hadoop
SAS® DISCOVER DATA ON HADOOP
The final step of fully integrating SAS® Discover as a key data source for digital data was deploying the
data model to Hadoop. Because of the separation between file storage and interpreter, it is primarily a
“write once” infrastructure. This means that if you want to update a row, you need to pick up all the files in
the folder where your row might be, process the update and then rewrite the entire dataset. There are a
few key issues with this:
• Extremely processing intensive
• High potential for data loss
6Figure 6. SAS® Discover Data Integration Architecture
As a result, our data architecture for SAS® Discover looks like
Figure 6. Our Hadoop deployment is separated into logical zones: a raw zone where we initially land data
and a production zone where we can land optimised data. To get from SAS® Discover to our business
user, we follow these steps:
1. Informatica® retrieves new data from the SAS® Discover REST API
1.1. Check for new data
1.2. Informatica retrieves s3 bcket address and single use credentials for each new file
1.3. Download the fact tables in chucks and appends to existing data
1.4. Download the full identity map and appends a new partition in a time series
2. Informatica® writes the optimised data model to production
2.1. Create Event Streams. Most of the key event streams in SAS® Discover have two parts: one
stream records the event at the start, when a person lands on a page. The other is processed
later to describe the entire event, loading time and time spent on page. To get a complete view
of the stream we need to join the data from both tables. However, the starting fact arrives up to
four hours before the ending fact. Being able to react quickly is increasingly important, so we
need a way to temporarily add the partial facts to the output stream. To do this, we make use of
partitions. This allows us to maintain a small set of transitory data that is co-located in the same
‘table’ as the final data. On each run, the process picks up any new start facts, the partition with
the partial facts and any new end fact. It then writes any completed facts to the relevant monthly
partition and any un-joined facts overwrite the previous partial partition (See Figure 7).
72.2. Create Identity Map. The identity map is much easier. Informatica picks up the most recent
partition of the identity tables, joins them together and then uses the near real-time data feed
from the Operational Data Store to decode the hashed customer identities. SAS Discover allows
us to have multiple levels of identities, so we need to flatten the identity table to allow one-to-one
joining with our time series and enrichment tables.
3. Data Engineering team creates the Enrichment tables. Now that we have an hourly feed of customer
data, we need to add customer attributes such as segment, digital activation, or product holding. Our
analytics team and data engineers use the other data within the raw zone to start to fill out the 360o
degree view of our users.
Figure 7. Partition Based Update Strategy
CONCLUSION
What started out with promises of a ‘single line of javascript’ has now been fleshed out into an end-to-end
data pipeline. Our business users can define new metrics and goals, the data is then captured, processed
and joined to our enterprise data. They can then self-serve using a suite of visual analytics, freeing up our
analyst to focus on delivering high value insights to the business. Our next steps are to reverse the data
flow and start to use this data to inform the experience of our end user by providing targeted content and
personalised digital journeys.
CONTACT INFORMATION
Your comments and questions are valued and encouraged. Contact the author at:
Ryan Packer
Bank of New Zealand
ryan_packer@bnz.co.nz
https://www.linkedin.com/in/ryanspacker/
8You can also read