HARVESTING OPPORTUNITIES FOR A SUSTAINABLE FOOD SUPPLY - SAM STUDY DIEDERIK BASCH GABRIELA GRAB HARTMANN ANDREA RICCI, PHD JÜRGEN SIEMER, PHD
←
→
Page content transcription
If your browser does not render page correctly, please read the page content below

SAM Study

                         Harvesting
                         Opportunities for
                         a Sustainable
                         Food Supply
Diederik Basch
Gabriela Grab Hartmann
Andrea Ricci, PhD
Jürgen Siemer, PhD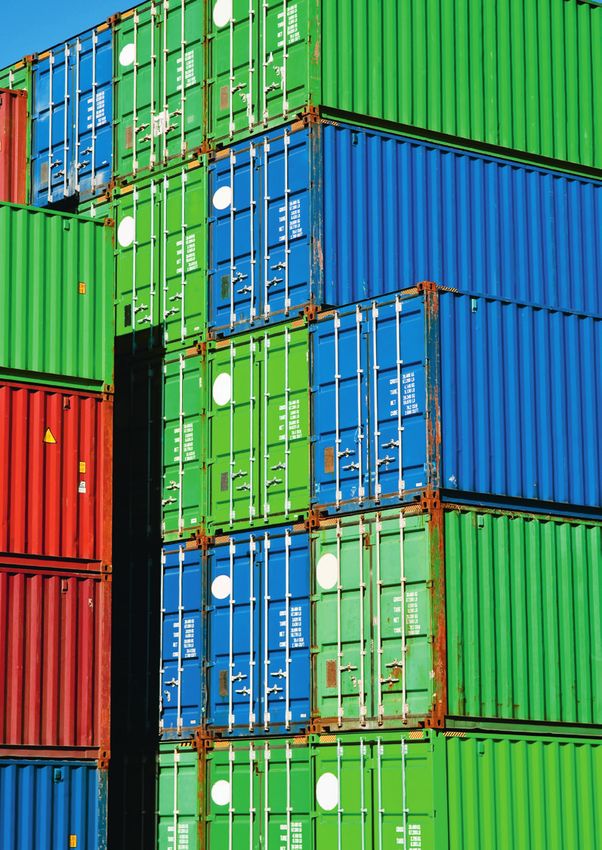
SAM Study – Investing in Food and Agribusiness
Harvesting Opportunities for a Sustainable Food Supply
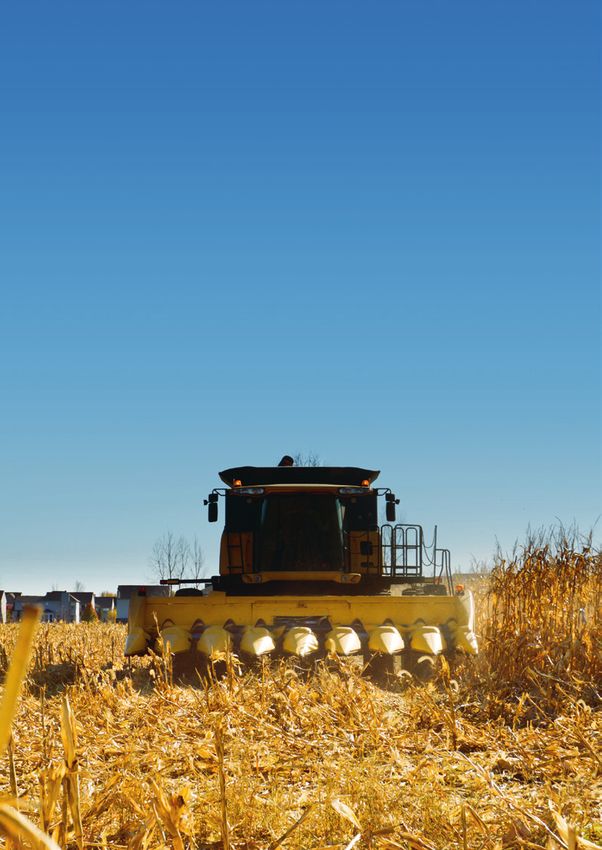
ADVANCED FERTILIZER
INJECTION KITS
SAM Study
Advanced fertilizer injection kits enable more efficient application
Harvesting Opportunities
of fertilizers, contributing to improved crop yields. for a Sustainable Food Supply
09/2012
SAM Sustainable Asset Management AG
2 © SAM 2012
SAM Study – Investing in Food and Agribusiness
                                                                            Harvesting Opportunities for a Sustainable Food Supply

Table of Contents

EXECUTIVE SUMMARY                                                                               4

1.     WHY FOOD AND AGRIBUSINESS?                                                               5

2.	GLOBAL TRENDS SHAPING THE FOOD AND AGRIBUSINESS SECTOR                                      9
2.1    Population growth and dietary change                                                    10
2.2.   The rise of the biofuels                                                                11
2.3    Declining availability of arable land per capita                                        11
2.4    Declining productivity gains                                                            12
2.5    The long supply chain & food safety                                                     13

3.     WHY SUSTAINABLE FOOD AND AGRIBUSINESS?                                                  15
3.1    Setting the sustainability standard in agriculture investments                          16

4.     WHY SAM?                                                                                21

5.     INVESTMENT OPPORTUNITIES                                                                23
5.1    Production Factors                                                                      24
5.2    Producers                                                                               26
5.3    Processing & Logistics                                                                  28
5.4    Packaged Food & Beverages                                                               30

6.     CONCLUSIONS: SUSTAINABLE INVESTMENT OPPORTUNITIES IN FOOD AND AGRIBUSINESS              33

ACKNOWLEDGEMENTS                                                                               35

                                                                                                            © SAM 2012                  3
SAM Study – Investing in Food and Agribusiness
Harvesting Opportunities for a Sustainable Food Supply
Executive Summary
According to the UN Food & Agriculture Organization (FAO), food production will have to increase by 70%
over the next 40 years in order to meet soaring demand. Population growth, economic prosperity in emerg-
ing economies, limited opportunities for expansion of agricultural land, declining productivity gains, and
growing demand for biofuels pose serious challenges to ensuring food security. As a result, global agricul-
tural commodity markets are expected to remain tight, with a prolonged period of high real prices. What
was once a world of plenty is becoming a world of scarcity and volatility.
As opportunities for expanding agricultural land remain limited, the gap between growing demand for food
and agricultural production will have to be narrowed primarily through additional increases in productivity
and improved efficiencies. This will require substantial innovation and investments along the entire value
chain, ranging from new application technologies for farm inputs and improved agronomic practices, to
greater efficiencies in logistics, transportation, storage, processing and packaging. Since agricultural activi-
ties take place within the natural environment, productivity will have to be increased in a sustainable manner.
The fundamental characteristics of food and agribusiness investments are rooted in i) secular growth, ii)
protection against inflation risks, and iii) exposure to rapidly growing emerging markets, all of which offer
investors a diversification effect.
In order to capture attractive investment opportunities in the sector, SAM has defined four investment
clusters along the entire agribusiness value chain that provide solutions addressing the bottlenecks in the
sector:
Production factors: companies that provide inputs used in agricultural production, such as seeds, fertilizers
and crop protection products, as well as suppliers of industrial machinery.
Producers: companies that are engaged in the production of agricultural commodities, livestock fish, and
timber.
Processing & Logistics: companies that purchase, transport, process, and sell agricultural raw materials.
Packaged Food & Beverages: manufacturers, distributors and retailers of food and beverage products.
Within these clusters, SAM identifies companies that promise attractive upside potential and screens them
according to key sustainability issues related to agricultural production.
This study offers insights into attractive and responsible food and agribusiness investments geared towards
developing sustainable solutions to help ensure food security.
4 © SAM 2012
1WHY FOOD AND
			 AGRIBUSINESS?
SAM Study – Investing in Food and Agribusiness
Harvesting Opportunities for a Sustainable Food Supply
1. Why food and agribusiness?
Food and agri ATTRACTIVE FUNDAMENTALS locate the capital required to fund the innova-
business offers The world is facing a period of significant food tions, technology improvements and infrastruc-
fundamentals that scarcity. This in itself is not a new phenomenon. ture investments needed to meet rising global
enable responsible In the past, instances of price spikes for agricul- demand for food. As part of this process, the food
investors to combine tural goods have been met with a strong supply and agribusiness sector will need to become a
attractive long- response and a subsequent leveling of prices. But larger component of the capital markets. The sec-
term returns with this time is genuinely different: the supply side tor offers fundamentals that enable responsible
investments in is facing limitations. Global productivity gains investors to combine attractive long-term returns
solutions that can have been declining and less room for the expan- with investments in solutions that can help secure
help secure a sion of farmland is available. As a result, investors a stable food supply well into the future.
stable food supply should expect a period of elevated agricultural
well into the future. commodity prices combined with higher short- As a relatively new investment theme, food and
term volatility. agribusiness offers a variety of attractive charac-
teristics:
RESPONSIBLE INVESTING IN AGRIBUSINESS: MORE
THAN JUST COMMODITIES SECULAR GROWTH
A responsible approach to food and agribusiness The world’s population is expected to grow by
investing is aimed at identifying and allocating 30% over the next 40 years, driven mainly by
capital to companies along the entire agribusiness longer average life expectancies, particularly in
value chain – from agricultural inputs to food dis- the rapidly growing emerging markets where in-
tributors – that are actively providing solutions to comes are rising.1 At the same time, dietary pat-
addressing bottlenecks in the food supply. This terns are changing as a result of higher disposable
goes beyond simply gaining exposure to a narrow incomes in emerging markets. In addition, de-
group of agricultural commodities. Solution pro- mand for biofuels is expected to triple, competing
viders that use innovation to address inefficiencies with food and feed for agricultural resources.
along the value chain are poised to experience Such overarching megatrends are expected to re-
strong growth stemming from the real demand main in place for years to come, driving stable de-
for their agricultural services and products. mand growth and making a compelling case for
1
World Population Prospects: The food and agribusiness investments. According to
2010 Revision, UN, 2011
The prospect of higher long-term real prices for the FAO, agricultural production would have to
Looking Ahead in Food and agricultural commodities gives players in the food increase by at least 70% over the next 40 years to
2
Agriculture: Perspectives to 2050,
edited by Piero Conforti. FAO, 2011 and agribusiness sector renewed incentives to al- meet total demand for food.2
6 © SAM 2012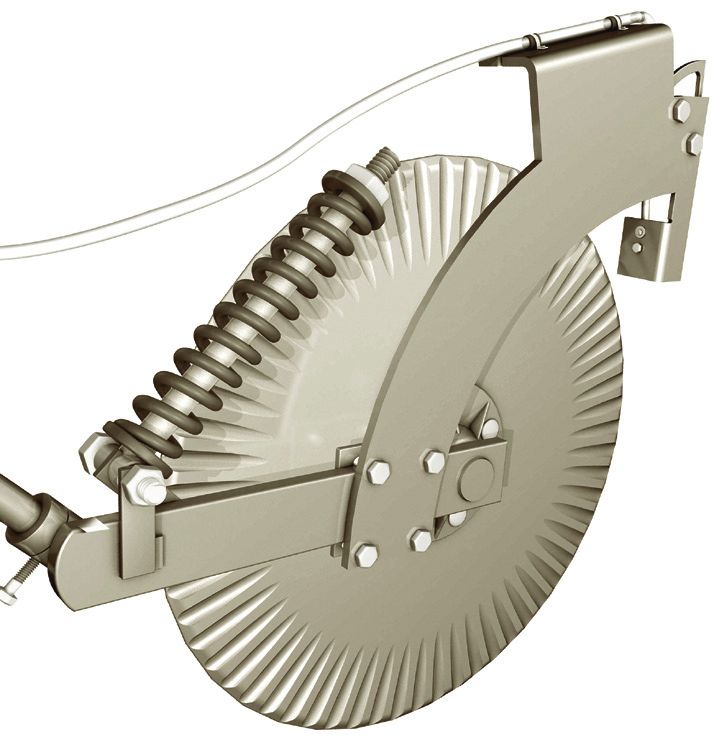
SAM Study – Investing in Food and Agribusiness
Harvesting Opportunities for a Sustainable Food Supply
INFLATION PROTECTION ability to meet global demand for food and agricul-
Until around 2006, real prices for agricultural prod- tural products.
ucts remained relatively stable, as shown in Figure
1. After reserves of important agricultural commod- The relative scarcity of food supplies is here to stay.
ities that had been held by private companies or Some economists3 expect that after stabilizing at
governments to support domestic price levels fell to the current level, real prices should increase by up
lows not seen in years, markets suddenly had to to another 60% by 2050, depending on the crop
price in the sector’s reduced ability to generate suf- and the assumptions applied. As a result, funda-
ficient production increases to meet future demand. mental demand growth drivers combined with the
This led to two significant upward price moves in finite nature of the natural resources used in agri-
2008 and in 2011. For many commodities, buffer culture should provide investors with built-in infla-
stocks are still not sufficient to accommodate for tion protection.
short-term production setbacks, contributing to re-
cent volatility of agricultural commodity prices. EMERGING MARKETS EXPOSURE
According to the UN, approximately 80% of pop-
To a certain extent, recent volatility reflects market ulation growth is expected to come from develop- 3
See for instance: Food Security,
participants’ overreaction to the structural shift in ing countries. Increasing demand for food prod- Farming and Climate Change
to 2050: Scenarios, Results, Policy
market pricing power from the demand side to the ucts will primarily come from the emerging mar- Options. Gerald C. Nelson.
IFPRI, 2010; or for a short term
supply side. And the supply side of the equation is kets, particularly in Asia, where growth of the
outlook: OECD - FAO Agricultural
indeed facing structural constraints, hampering its middle classes is expected to be most pronounced. Outlook 2010-2019, OECD 2010
Figure 1: Development of real agricultural commodity prices
Source: FAO Food Price Index (2002-2004=100)
180
160
FAO Food Price Index (real terms)
140
120
100
80
60
40
20
0
31.1.1990
31.1.1991
31.1.1992
31.1.1993
31.1.1994
31.1.1995
31.1.1996
31.1.1997
31.1.1998
31.1.1999
31.1.2000
31.1.2001
31.1.2002
31.1.2003
31.1.2004
31.1.2005
31.1.2006
31.1.2007
31.1.2008
31.1.2009
31.1.2010
31.1.2011
31.1.2012
Year
Consists of the average of 5 commodity group price indices (meat, dairy, cereals, oil & fat, and sugar) weighted
with the average export shares of each of the groups for 2002–2004.
© SAM 2012 7
SAM Study – Investing in Food and Agribusiness
    Harvesting Opportunities for a Sustainable Food Supply

                                     On the supply side, many developed regions in             increase production through acreage expansion or
                                     North America and Europe are already operating at         the more widespread adoption of modern farming
                                     highly efficient productivity levels, making it diffi-    techniques. Thus, food and agribusiness invest-
                                     cult to achieve incremental yield increases, while        ments offer exposure to the rapidly growing
                                     large expanses of land in the Black Sea Region,           emerging markets, both on the supply side as well
                                     Latin America and Africa still have the potential to      as on the demand side.

                                      SHORT TERM CONSIDERATIONS: IMPACT OF FINANCIAL CRISIS ON THE AGRICULTURAL SECTOR
                                      The ongoing financial crisis raises the possibility of a new global recession. However, given the long-term
                                      secular trends supporting the food and agribusiness theme, the financial crisis should not have a signifi-
                                      cant negative impact on the agricultural sector:

                                      •    Highly indebted regions such as Europe, in particular, have already slid into a severe recession. The
                                           recession may be shorter if the reallocation of human and financial capital to productive uses – such
                                           as the food and agribusiness sector – is supported by structural reforms.

                                      •    A s long as agribusiness companies themselves are not burdened by excessive debt, they should be
                                           able to take advantage of increasing global demand for agricultural products.

                                      •    During the recession, the agribusiness sector will likely weather the storm better than other sectors
                                           of the economy, as people need to eat regardless of economic conditions or market cycles.

8              © SAM 2012
2 GLOBAL TRENDS
			 SHAPING THE FOOD
		 AND AGRIBUSINESS SECTOR
SAM Study – Investing in Food and Agribusiness
Harvesting Opportunities for a Sustainable Food Supply
2. Global trends shaping the food and agribusiness sector
2.1 POPULATION GROWTH AND DIETARY CHANGE Growth in the meat sector has been propelled by
Population growth is the most fundamental driver the Chinese market, where over the last 30 years,
of demand for agricultural products. In 2011, the meat consumption has grown from 9 kg per capita
world’s population reached 7 billion and is expected per year to more than 50 kg. While it is unlikely that
to exceed 9 billion by 2050. such growth in China will continue at the same
rate, there is still significant scope for growth in
But it isn’t just sheer numbers of people. People’s other developing countries, where annual meat
diets are also changing. As emerging economies in consumption currently sits at 16 kg per capita and
Asia and Latin America continue to benefit from is expected to double by 2050.4
robust growth, the global middle class is expand-
ing, particularly in urban areas. Increased affluence Increased consumption of meat and dairy products
is typically concentrated in urban areas, and middle is significant because livestock requires up to 8 kg
class consumers usually have greater purchasing of feed – such as corn, soybeans, wheat and bar-
Looking Ahead in Food and power to consume more meat, fish, dairy products ley – for every kg of meat produced. China, for
4
Agriculture: Perspectives to 2050,
edited by Piero Conforti. FAO, 2011 and processed foods. instance, consumes 50% of all global pork pro-
Figure 2: A more populous and urban world
Source: World Population Prospects: The 2010 Revision. United Nations, New York, 2011.
10
8
Billion people
6
Urban population in
4 developing countries
Urban population in
developed countries
2 Rural population in
developing countries
Rural population in
0 developed countries
1950
1955
1960
1965
1970
1975
1980
1985
1990
1995
2000
2005
2010
2015E
2020E
2025E
2030E
2035E
2040E
2045E
2050E
10 © SAM 2012SAM Study – Investing in Food and Agribusiness
Harvesting Opportunities for a Sustainable Food Supply
duction, making it a major importer of corn and requirements and subsidies for biofuel feedstocks
soybeans to support its livestock production. have accelerated demand. As a result, global bio-
fuel production increased 124 % between 2000
The growing demand for meat and dairy products and 2010, and demand for bio-fuels is expected to
translates into increased demand for animal feed, triple by 2050, according to the FAO.6 5
Looking Ahead in Food and
which in turn intensifies competition for land. For Agriculture: Perspectives to 2050,
edited by Piero Conforti. FAO, 2011
example, to accommodate the increased demand for Biofuels represent 7% of global coarse grain use and
The FAO has chosen this assumption
feed driven by increased meat consumption, the FAO 9% per cent of global vegetable oil use. Their im-
6
based on the work of Fischer et al, at
estimates that soybean production, which is primarily pact is even more extreme at the regional level. For the International Institute for Applied
Systems Analysis (IIASA). (Biofuels
a feed crop, will need to grow 135 % by 2050. 5
example, biofuel production accounts for over 40% and Climate Change: Challenges to
Food Security in the Twenty-First
of US corn,7 about half of the sugar cane crop in
Century). The International Energy
2.2. THE RISE OF THE BIOFUELS Brazil, and about two-thirds of the vegetable oil pro- Agency (IEA), on the other hand,
calculates an estimated 800%
Bioethanol and biodiesel – which are produced duction (predominantly from rapeseed) in the EU. increase in the production of biofuels
until 2050. The IEA scenario,
from a number of agricultural crops that are also
however, includes a significant
important sources of food and feed – are a rela- 2.3 DECLINING AVAILABILITY OF ARABLE LAND contribution from second generation
biofuels in its calculations.
tively recent growth driver for agricultural com- PER CAPITA
World Agricultural Supply and
modity markets. Over the past decade, govern- The easiest way to boost food and feed production
7
Demand Estimates, United States
ment policies such as minimum biofuel blending in response to growing demand is to increase agri- Department of Agriculture, July 2012
Figure 3: Increasing protein consumption
Source: Rabobank, based on FAPRI, FAO, USDA, EC, OECD
450
400
Consumption (million tonnes)
350
300
250
200
150
100 Lamb
Poultry
50
Pork
0 Beef
1985 1995 2005 2015E 2025E
Table 1: Feed conversion ratios
Source: various growers’ associations, company data, FAR
Number of kg of feed required
Protein Source for every kg of meat
Beef 8
Lamb 5
Pork 2.5
Poultry 1.5
Fish 1.2
© SAM 2012 11SAM Study – Investing in Food and Agribusiness
Harvesting Opportunities for a Sustainable Food Supply
cultural land area. But urbanization, soil erosion, amount of land potentially suitable for rain fed ag-
and water scarcity continue to claim prime agricul- riculture, followed by South America and Russia.
tural land. Furthermore, any additional farmland However, in many of these regions this land is often
expansion will have to be balanced against the located in remote areas, away from transportation
need to prevent deforestation and protect biodi- and storage infrastructure, or in environments that
versity. Opportunities for further expansion of ara- lack a favorable institutional environment. As a
ble land still exist, but are limited by physical con- result, significant challenges must be overcome in
straints (i.e. availability of water, quality of soil) and order to take this land into production.
economic constraints (i.e. availability of infrastruc-
ture and labor, or institutional factors such as prob- 2.4 DECLINING PRODUCTIVITY GAINS
lems relating to title deeds and security). In the last In the early 1960’s, when the Green Revolution was
40 years, total net arable land area increased in full swing, annual yields per hectare grew be-
by 9 %.8 According to the FAO, only an additional tween 2.5 % and 5 % for important field crops.
net 4 – 5 % expansion of arable land is economi- More recently, however, global average yields per
cally feasible, while the International Food Policy hectare have only increased between 0 to 1.5 % per
Research Institute (IFPRI) expects a net increase of year. Soybeans, whose yields per hectare increased
3 % by 2050. by an average of 2.2 % each year between 2006
and 2011, are the only exception. Soybean produc-
Opportunities for farmland expansion are concen- tion has been particularly successful because farm-
Looking Ahead in Food and trated in a limited number of countries. The World ers in Latin America have been planting new high-
8
Agriculture: Perspectives to 2050,
edited by Piero Conforti. FAO, 2011 Bank identifies Africa as the region with the largest yielding soybean varieties on a large scale.
Figure 4: Increasing food demand & declining agricultural land per capita
Source: WRI, Aquila, Robeco
2.6 1.8
2.4 1.7
2.2 1.6
2.0 1.5
1.4
ha agricultural land per capita
1.8
1.6 1.3
Billion tonnes
1.4 1.2
1.2 1.1
1.0 1.0
0.8 0.9
0.6 0.8
0.4 0.7 Demand food
Demand animal feed
0.2 0.6
Demand biofuels
0.0 0.5 Agricultural land per capita
1960 1965 1970 1975 1980 1985 1990 1995 2000 2005 2010 2015E
12 © SAM 2012SAM Study – Investing in Food and Agribusiness
Harvesting Opportunities for a Sustainable Food Supply
Using an optimistic assumption of a net 7.5 % transfer of expertise and improved management.
expansion of farmland by 2050, aggregate agri- Used in conjunction, such practices can help pro-
cultural productivity would have to increase by an ducers achieve the much needed incremental
average of 1.3 % per year globally over the next yields required to meet demand for agricultural
40 years in order to meet the expected 70 % products.
increase in demand. Average yield increases are
currently below the amount required to guarantee 2.5 THE LONG SUPPLY CHAIN & FOOD SAFETY
sufficient future food production. As shown There is a growing geographical mismatch be-
in Figure 5, a continuation of the declining trend tween where food is produced and where it is
in yield increases would likely result in what is of- needed, as shown in Figure 6. The greatest poten-
ten referred to a productivity gap. tial for increasing agricultural yields is concentrated
in South America, the Black Sea region, and in the
Additional and sustained yield improvements are more distant future, Africa, while demand growth
generally achieved through a combination of capi- is expected to come primarily from Asia. Therefore,
tal and superior expertise. These include the use of the transportation and trade of agricultural com-
new seed varieties, increased irrigation, a more modities will be crucial to bridging the gap be-
balanced application of fertilizers, improved agri- tween local demand and available supply. This will
cultural equipment, the use of new Geographical require improved logistics and transport capacity to
Information Systems (GIS) to monitor soil, land, facilitate global trade flows. As trade becomes
and machinery, improved storage, processing and more globalized, the reliability and costs of long-
transport facilities, and equally important, the distance transport represent potential bottlenecks.
Figure 5: Declining trend in annual yield increases for key agricultural crops
Source: Rabobank, USDA data for wheat, corn and soybean yields
5.0%
4.5%
4.0%
3.5%
3.0%
Growth in %
2.5%
2.0%
1.5% Annual growth in crop yields,
5-year moving average
1.0% Trend line
Productivity gap
0.5%
Average annual yield increase
0.0% required (1.3%)
1965
1967
1969
1971
1973
1975
1977
1979
1981
1983
1985
1987
1989
1991
1993
1995
1997
1999
2001
2003
2005
2007
2009
2011
2013E
2015E
2017E
2019E
© SAM 2012 13SAM Study – Investing in Food and Agribusiness
Harvesting Opportunities for a Sustainable Food Supply
The solution to A significant portion of all food that is produced for coli and salmonella outbreaks in Europe and the US
addressing food human consumption is wasted, spoiled, or thrown have led to growing concerns over food safety. Such
supply constraints is away before it reaches the table. Therefore, the so- concerns are further compounded by the fact that
as much about lution to addressing food supply constraints is as most consumers are so removed from the food pro-
wasting less as it is much about wasting less as it is about producing duction process that they typically have minimal
about producing more. Improved transportation and logistics there- knowledge of where the food came from, how it
more. fore play an important role in meeting future de- was produced and how it ended up on their tables.
mand for food and agricultural products Therefore, as supply chains from harvest to tables
lengthen, one of the agribusiness sector’s primary
In addition, consumers demand food that not only responsibilities is to ensure that the strictest quality
tastes good at a reasonable price, but that is also and safety standards have been guaranteed as the
fresh, clean and healthy. Recent food scandals such food is transported from the field, processed,
as melamine contamination of milk in China, or E. stored, packaged and delivered to the consumer.
Figure 6: Mapping grain and oilseed trade flows
Source: International Grains Council, International Olive Oil Council, OILWORLD - ISTA Mielke-Hamburg (www.oilworld.biz),
UN Comtrade, USDA, Rabobank 2012. Data trade flow years: grains 2009/10; oilseeds 2010.
Major trade flows (data in 1,000 tonnes)
Soy exports
Soy meal exports
Palm oil exports
Wheat exports
Corn exports
Major trade flows (data in 1,000 tonnes)
Soy exports
Soy meal exports
Palm oil exports
Wheat exports
Corn exports
14 © SAM 20123 WHY SUSTAINABLE FOOD AND AGRIBUSINESS?
SAM Study – Investing in Food and Agribusiness
Harvesting Opportunities for a Sustainable Food Supply
3. Why sustainable food and agribusiness?
Agribusiness has Agricultural activities take place within the natural Companies that operate sustainably tend to have
no choice but to be environment and make use of limited soil and w
ater more reliable supply chains, are better prepared to
sustainable. resources while applying various inputs intended to maintain their social license to operate, experience
nourish and protect crops from natural enemies and less volatility in their profits and losses, and are
competitors. In its original Latin form, the term ag- therefore better positioned to deliver greater share-
riculture means “cultivating the acres.” In practical holder value.
terms, this means improving and maintaining soil
fertility. Naturally, this definition can be broadened 3.1 SETTING THE SUSTAINABILITY STANDARD IN
to include the more efficient use of water resources, AGRICULTURE INVESTMENTS
reducing waste and minimizing any harmful effects To ensure the sustainable use of natural resources
on the environment while preserving biodiversity. critical to agricultural production, the benefits and
Limiting negative impacts on agricultural resources risks arising from the application of new technolo-
is critical to preserving the land’s ability to remain gies must be carefully weighed. For this reason,
productive well into the future, ensuring that future SAM has developed and continuously refines pro-
demand for food can be met. Agribusiness has no prietary investment criteria to screen and monitor
choice but to be sustainable. companies for their exposures to and manage-
Figure 7: Sustainable Intensification of agriculture: maximizing crop yields while optimizing the use of agricultural resources
Agricultural production done in a sustainable manner yields:
• optimizing inputs and technology
• increased current and future
• through knowledge sharing
Sustainability criteria: food production
• through product and process
• preserving land fertility • reduction of wasted food
innovations
• conserving water resources during transport
• expanding agricultural acreage
• protecting biodiversity • limited and controlled
• building additional and more
environmental impact
efficient processing facilities and
• jobs in rural communities
infrastructure
16 © SAM 2012SAM Study – Investing in Food and Agribusiness
Harvesting Opportunities for a Sustainable Food Supply
ment of critical sustainability issues related to agri- producers also have dedicated staff charged with SAM has developed
culture. ensuring firm-wide sustainable animal treatment and continuously
practices. refines proprietary
For each of these issues, SAM systematically ap- investment criteria
plies minimum sustainability standards to the entire AQUACULTURE & FISHERY to screen and moni-
food and agribusiness investment universe to eval- Aquaculture – also known as fish farms – has tor companies
uate the extent to which companies effectively emerged as an important source of protein as for their exposures
manage their exposures to sustainability risks. This many consumers seek healthier alternatives to red to and management
careful screening process eliminates companies meat. Moreover, fish farms have become the main of critical sustain
with inferior management of these risks, resulting source of fish for certain species, particularly ability issues related
in a universe of sustainable food and agribusiness salmon. However, various potential risks are associ- to agriculture.
companies. ated with aquaculture. These include the large vol-
umes of waste generated by high concentrations of
ANIMAL WELFARE fish living in a compact area and the use of fishmeal
Consumers are increasingly concerned with animal as feed, which places additional pressure on wild
treatment, animal-welfare standards and overall fish populations.
farming conditions. Further, farmers recognize that
the appropriate treatment of livestock improves the Sustainable fish farms must be located close to cur-
quality, taste and safety of their meat and dairy rents that can help disperse fish waste, limiting the
products, and that for a combination of ethical, environmental damage to coastal areas. They also
health, and taste reasons, consumers are often will- adhere to international certification standards such
ing to pay a premium for sustainable meat prod- as the International Fishmeal and Fish Oil Organi-
ucts. zation’s Global Standard for Responsible Supply
or Friends of the Sea, ensuring traceability and the
Despite a large body of laws in various countries sustainable sourcing of fishmeal. Other sustainable
and regions regulating the treatment of livestock, best practices include limiting the use of antibiotics
a widely adopted international standard for animal and implementing appropriate measures to pre-
welfare is still lacking. Sustainable livestock farm- vent the escape of farmed fish into the environ-
ers subject themselves to periodic external audits ment. Finally, sustainable fish farms actively explore
and demonstrate a commitment to best practices using plant sources as an alternative to fishmeal.
related to breeding, minimizing the use of antibi-
otics, and training their staff on the appropriate Despite the growth of aquaculture, wildcatch still
handling and slaughter of livestock. Sustainable accounts for roughly half of total fish production
© SAM 2012 17SAM Study – Investing in Food and Agribusiness
Harvesting Opportunities for a Sustainable Food Supply
for human consumption. Overfishing can result in tify new crops that can be grown on marginal land,
the depletion of fish stocks, causing serious dam- and the development of crop varieties better suited
age to the marine environment. Sustainable wild- to the needs of biofuel production have yielded
catch fisheries avoid the overexploitation of marine promising results. As long as crops used as feed-
sources by committing to maintaining a steady fish stocks for biofuels are economically viable without
population, thus reducing environmental impacts. relying on market distorting subsidies, and as long
They also comply with all local, national and inter- as their production processes meet minimum sus-
national regulations to ensure authorized fishing, tainability standards, biofuels can play an impor-
and have received certification from the Marine tant role in diversifying the energy mix.
Stewardship Council Environmental Standard for
Sustainable Fishing. The most sustainable growers active in this area
have publicly available policies outlining their com-
BIOFUELS panies’ commitment to assuring transparency and
Over the last few decades, societal demand for al- traceability, preserving biodiversity, and limiting
ternatives to fossil fuels has prompted increasing feedstock depletion. Responsible growers are also
investments in the biofuel industry. Yet the chal- willing to disclose how much of their crop is being
lenges of balancing the limited supply of arable directed to biofuel production versus food produc-
land to grow biofuel feedstocks against the need tion, and participate in certification schemes for
for food and feed have sparked controversies relat- biofuel feedstocks such as the Better Sugar Cane
ing to the appropriate use of land and the impact Initiative or the Roundtable on Sustainable Biofu-
of biofuels on food prices. Although biofuels repre- els. Further, responsible producers of biofuels pub-
sent a legitimate path to enhancing energy security licly disclose their commitment to developing and
and mitigating climate change, if not produced sus- implementing technologies for the production of
tainably, their use can have far-reaching economic, second generation biofuels.
environmental and social implications.
FORESTRY
However, the biofuel industry has begun to im- Forest management is central to the production of
prove the productivity and efficiency of its produc- wood products such as timber, fiber, and pulp,
tion processes. Ongoing research into second gen- which are further processed to serve a wide range
eration biofuel feedstock crops, attempts to iden- of applications in the paper, construction and fur-
18 © SAM 2012SAM Study – Investing in Food and Agribusiness
Harvesting Opportunities for a Sustainable Food Supply
nishing industries. Although wood-based products had a gene or genes from a different species trans-
have been used by society for millennia, forestry ferred into its genetic material in order to improve
raises various critical sustainability issues related to productivity, pest resistance or to enhance another
deforestation, impacts on biodiversity, land dis- quality. Today, agricultural producers increasingly
putes, illegal commercial practices and conflicts turn to genetically modified seeds that can en-
with indigenous people. hance a plant’s resistance to droughts and pests or
reduce water consumption by more efficiently ab-
Sustainable forest management entails the preser- sorbing air moisture, all of which can help increase
vation of timberland and ecosystems, limiting neg- yields.
ative impacts on biodiversity and engaging with
the local population. Sustainable forest owners Genetically modified seeds are viewed as part of
and managers obtain at least partial certification of the solution to ensuring food security. However, as
their timberland from internationally recognized a relatively misunderstood technology, the use of
certification schemes such as the Forest Steward- GMOs has sparked controversies stemming from
ship Council or the Sustainable Forestry Initiative, concerns over potential negative impacts on biodi-
confirming the sustainable management of the for- versity and food safety, leading to public resistance
est. They implement and publicly disclose their en- to the use of genetically modified seeds.
vironmental management systems in line with ISO
14001, and are subject to periodic third party mon- Seed producers that use genetically modified prod-
itoring and auditing. Finally, for their non-certified ucts responsibly have a proven track record of de-
timberlands, sustainable forest managers provide a veloping biotechnologies that have resulted in im-
publicly available report on their internal policies proved agricultural performance while minimizing
ensuring the sustainable management of their negative impacts on biodiversity and human safety.
property. Leading companies in this sector are also willing to
address public mistrust of GMOs by actively engag-
GMO (GENETICALLY MODIFIED ORGANISMS) ing with and educating stakeholders, providing la-
Genetically modified organisms (GMOs) have been beling and traceability of their GM products and
created using specific breeding technologies or en- ingredients, and committing to transparent man-
gineering techniques. In the context of agriculture, agement and communication on their processes
the term refers to any genetic plant type that has and scientific advances in the field.
© SAM 2012 19SAM Study – Investing in Food and Agribusiness
Harvesting Opportunities for a Sustainable Food Supply
PALM OIL growth of the palm oil industry has also raised a
Palm oil is an important agricultural commodity number of social issues relating to land rights/ti-
widely used in a broad range of food products. Its tles as well as plantation workers’ health and
high productivity relative to other vegetable oils safety. Sustainable palm oil companies comply
has driven growth of the palm oil industry. De- with the Roundtable on Sustainable Palm Oil
spite its contribution to economic growth, par- (RSPO) certification standards and either the Uni-
ticularly in Malaysia and Indonesia, the palm oil versal Declaration of Human Rights or the UN
industry has been blamed for contributing to en- Declaration on Rights of Indigenous People, re-
vironmental damage such as deforestation and flecting their commitment to sustainable environ-
the loss of biodiversity and watersheds. The mental and social practices.
20 © SAM 20124 WHY SAM?
SAM Study – Investing in Food and Agribusiness
Harvesting Opportunities for a Sustainable Food Supply
4. Why SAM?
SAM benefits SAM’s long-standing experience in conducting cor- and financial expertise in the field of food and
from an experienced porate sustainability assessments and sustainable agriculture. In addition, SAM has direct access to
research and theme investing has enabled it to develop a respon- Rabobank and its global network of 90 agribusi-
portfolio manage- sible approach to investing in the food and agri- ness experts at Rabo FAR (Rabobank Food & Ag-
ment team with business sector. SAM refrains from investing in ribusiness Research and Advisory). As one of the
a combination of capital market products that are constructed leading banks committed to the food and agri-
technical and to profit solely from the price volatility of agricul- business sector, Rabobank’s in depth knowledge
financial expertise tural commodities and does not make speculative on major developments in the agricultural sector
in food and bets on short-term commodity price movements. and its relationships with some of the industry’s
agriculture, and Rather, SAM is a long-only equity investor that fo- top players enables SAM to continuously develop
leverages the unri- cuses on identifying companies that provide solu- the Sustainable Food and Agribusiness theme.
valed expertise tions to the challenges faced by the sector. This combination of food and agribusiness exper-
of Rabobank’s tise and SAM’s longstanding experience in sus-
global network of SAM’s Sustainable Agribusiness Equities Strategy tainability research are critical to addressing key
90 agribusiness benefits from an experienced research and port- sustainability issues specifically related to the agri-
specialists. folio management team with specialized technical business theme.
THE ADVANTAGES OF SUSTAINABILITY INVESTING
Sustainability investing goes beyond making investment decisions based purely on financial analysis.
Analyzing sustainability performance is essential to identifying companies that are better equipped to
respond to economic, environmental and social opportunities and challenges arising from sustainability
megatrends. Sound financial analysis is incomplete if it does not take into account such sustainability
considerations that have an impact on a company’s long-term performance. This is particularly important
for the agribusiness sector, which operates within the natural environment and is directly affected by
long-term megatrends such as demographic change and resource scarcity.
22 © SAM 20125INVESTMENT OPPORTUNITIES
SAM Study – Investing in Food and Agribusiness
 Harvesting Opportunities for a Sustainable Food Supply

                                  5. Investment opportunities

            SAM identifies        The global food crisis requires long-term solutions.             5.1 PRODUCTION FACTORS
     companies along the          SAM has developed the SAM Sustainable Agribusi-                  The Production Factors cluster encompasses pro-
         entire agricultural      ness Equities Strategy, which identifies investment              viders of inputs used in agricultural production:
          value chain that        opportunities along the entire agricultural value                seeds, fertilizers and crop protection products as
      provide solutions to        chain that are poised to benefit by providing solu-              well as equipment and machinery used in the food
         the challenges of        tions to the challenges of food security, food safety            and beverage processing industries.
       food security, food        and sustainability.
       safety and sustain-                                                                         Technological developments in production factors
                     ability.     The upper segment of the food and agribusiness                   have in large part contributed to the steady
                                  value chain covers those areas that are most                     growth in per capita global agricultural produc-
                                  closely associated with a more traditional view of               tion achieved over the last few decades. The reli-
                                  agriculture. These include farm inputs such as                   able supply of mineral fertilizers has allowed farm-
                                  seeds, fertilizers, crop protection products, irriga-            ers to provide plants with nutrients. Crop protec-
                                  tion and farm equipment, as well as the producers                tion products have helped reduce the growth of
                                  of agricultural goods. Further down the value                    weeds competing for nutrients, water and sun-
                                  chain, companies engaged in logistics, trade, stor-              light while protecting crops against diseases, fungi
                                  age and packaging, as well as distributors and                   and insects. New seed varieties have enabled
                                  food-service providers are also an integral part of              higher yields and greater resistance to diseases,
                                  the solution.                                                    insects and droughts. In addition, the develop-

                                  Figure 8: From field to fork: The agricultural value chain
                                  Source: SAM

                                         Production Factors                 Producers             Processing & Logistics   Packaged Food&Beverages

                                                                            Producers of Crops,
                                         Agricultural Inputs                Animal Protein and      Commodity Processors      Food/Beverages
                                         Needed on the Field                Timber                  and Transportation        and Distribution/Retail

24           © SAM 2012
SAM Study – Investing in Food and Agribusiness
Harvesting Opportunities for a Sustainable Food Supply
ment of improved agricultural equipment has al- Although they offer producers huge benefits, pro-
lowed for the continuous improvement of the duction factors have not always been used in the
seedbed, reducing soil compression and limiting most effective or optimal manner. For instance,
losses during harvest. the over-application of nitrogen-based mineral
fertilizers, which produce short term improve-
Although weeds and pests naturally develop resist- ments in the plant, has often occurred at the
ance to crop protection chemicals, over the last few expense of potash, which replenishes the soil’s
decades the chemical industry has identified inno- mineral potassium levels and is important to main-
vative active principles that preserve a plant’s integ- taining high yields in future harvests. Along with
rity while targeting only the unwanted pests. Pest a lack of technology and unfavorable climates,
management will remain a significant business op- unbalanced fertilization is broadly responsible for
portunity for suppliers of production factors. This the lagging agricultural yields in emerging coun-
will require chemical innovation in order to develop tries compared to those in developed countries. In
more efficient agrochemicals amid rising regulatory order to close this yield gap, farmers, particularly
barriers aimed at protecting farmers and consum- in developing countries such as China and India,
ers. Meanwhile, the expiration of several patents are expected to apply a more balanced mixture of
covering key chemicals used as crop protection fertilizers.
agents will also generate opportunities for suppliers
of generic crop protection products. Finally, the in- CASE STUDY: JUST-IN-TIME ORDERING
creased use of bio-fertilizers – microorganisms that As is often the case when crop prices are volatile,
help the roots extract nutrients from the soil – will farmers and agricultural distributors in North
also be part of the solution to improving yields. America have recently been concerned with the
Table 2: Chinese potash consumption
Source: IFA (International Fertilizer Industry Association), SAM estimates
1991–1995 1996–2000 2001–2005 2006–2010 Future trends
Average annual growth of potash consumption in China 13.9% p.a. 4.9% p.a. 10.5% p.a. 0.2% p.a. 5–10% p.a. over the
next 10 years
Prices constant constant increasing increasing constant
© SAM 2012 25SAM Study – Investing in Food and Agribusiness
Harvesting Opportunities for a Sustainable Food Supply
timing of their purchase of agricultural inputs such Companies active in this cluster produce grains and
as mineral fertilizers, out of fear that prices of in- oilseeds, sugar, milk, beef, pork and poultry, as well
puts could fall further after they have already made as wildcatch or farmed fish, and timber. Agricul-
their purchase. This has given rise to the practice of tural producers are the primary beneficiaries of in-
just-in-time ordering, already widely used in other creasing prices for their respective agricultural
manufacturing industries. Farmers place orders to commodities. Therefore, their revenue growth out-
distributors only when they are out of stock, and look is likely to remain solid.
only purchase the goods shortly before their use.
Profit margins for individual companies in the clus-
Companies possessing efficient distribution net- ter primarily depend on factors such as soil quality,
works are best placed to respond to farmers’ de- the local availability of rainfall, access to infrastruc-
mand in a timely manner, potentially taking advan- ture, and distance to markets. Secondary factors
tage of demand rushes that can induce temporary such as agricultural expertise and management ca-
price spikes, while avoiding supply disruptions. In pabilities, fluctuations in exchange and interest
addition, companies that own retail centers can rates, the wise allocation of fixed assets and the
supply a larger product portfolio including crop efficient use of working capital can either enhance
protection chemicals, growth additives and adju- or limit the growth potential of specific producers.
vants, potentially becoming a one-stop solution for Such secondary factors determine the future devel-
farmers. By combining a comprehensive product opment of stock prices of agribusiness companies.
offering with complementary distribution capabili- Based primarily on their superior agricultural exper-
ties such as retail stores, such companies can ac- tise, successful companies consistently achieve
tively manage their inventories and best respond to higher yields per hectare and/or lower costs over
rapidly changing market dynamics, while strength- longer time periods.
ening their relationship with farmers.
Global demand for agricultural commodities will
5.2 PRODUCERS outpace global population growth. In contrast to
The Producers cluster consists of large farming, other clusters, however, the downside risk for the
plantation, livestock or fish farming operations. producers cluster should be limited.
Table 3: Growth in agricultural commodity sales volumes
Source: FAO, SAM estimates
1991–1995 1996–2000 2001–2005 2006–2010 Future trends
Average annual growth of global sales volumes (t) 0.3% p.a. 2.2% p.a. 2.8% p.a. 2.5% p.a. 2–2.5% p.a. over
of wheat, sugar, cotton, coffee, cocoa, corn and the next 5 years
soybeans
Prices* 93.8 80.6 62.9 95.5 increasing
* Discounted with US-Consumer Price Index, 1990 =100
26 © SAM 2012SAM Study – Investing in Food and Agribusiness
Harvesting Opportunities for a Sustainable Food Supply
FISH – WILDCATCH AND AQUACULTURE
Not only does seafood taste good, it is also a healthy source of protein, vitamins, minerals and essential
fatty acids. Capture fisheries and aquaculture currently supply the world with about 154 million tonnes
of fish, 130.8 million of which are consumed by humans, providing an estimated per capita supply of 18.8
kg (live weight equivalent).9 The remaining fish is used as feed for aquaculture and animal production.
Since the mid-1990’s global marine wild catch production has remained relatively stable. The amount of
fish caught in rivers and oceans cannot be increased further without risking the stability of wild fish
populations. This, in turn provides attractive opportunities for aquaculture as demand for seafood con-
tinues to grow. Since 1996, the volume of fish produced through aquaculture has more than doubled.
Aquaculture is currently the fastest growing animal food producing sector, and today, almost 50 % of
consumed seafood is of farmed origin.
Aquaculture is still a young industry and there is still room for growth. In the past two decades, consider-
able progress has been made in addressing aquaculture governance issues through national and interna-
tional efforts with the common goal of ensuring the sustainability of the sector. 9
“The State of World Fisheries and
Aquaculture 2012“, FAO Fisheries and
Aquaculture Department
Figure 9: Global fisheries and aquaculture production
Source: The State of World Fisheries and Aquaculture (2002-2012). FAO Fisheries and Aquaculture Department
180
160
140
120
Million tonnes
100
80
60
40
20
Aquaculture
0 Capture
1996
1997
1998
1999
2000
2001
2002
2003
2004
2005
2006
2007
2008
2009
2010
2011
© SAM 2012 27SAM Study – Investing in Food and Agribusiness
Harvesting Opportunities for a Sustainable Food Supply
In the near future, CASE STUDY: LARGE-SCALE AGRICULTURE OFFERS long run, processors should enjoy relatively stable
the world’s largest ADVANTAGES margins as long as volumes, capacity utilizations
demand centers will Over the past few decades, Brazil has grown into and interest rates remain constant.
be concentrated one of the bread-baskets of the world. Its large ex-
on the coasts of the panses of land and its well-educated agricultural The most attractive companies in this cluster allo-
China Sea and on engineers combined with public investments in in- cate their capital investments wisely, ensuring that
the Indian subconti- frastructure and storage facilities will continue to high capacity utilization is achieved. They also re-
nent, while increas- strengthen its position in the next few decades. duce average overhead costs by combining North-
ing quantities of ern Hemisphere with Southern Hemisphere busi-
their food supply will One of Brazil’s leading agribusiness companies pro- ness and benefit from their proximity to locations
come from across duces cotton, soybeans, corn and various other crops that provide prime access to either growing supply
the ocean. covering more than 250,000 hectares on a number centers or growing demand centers. In the near
of farms in Northeastern Brazil. Through its use of future, the world’s largest demand centers will be
superior seed selection, soil management and mod- concentrated on the coasts of the China Sea and
ern technology to reduce crop losses, the company on the Indian subcontinent, while increasing quan-
has consistently achieved better yields per hectare tities of their food supply will come from across the
than its competitors. At the same time it has trimmed ocean in the Americas, South-East Asia, Australia,
its operational costs by optimizing the use of its ma- the Black Sea Region, and in the more distant fu-
chinery through GPS-guidance, and has reduced soil ture, East Africa.
erosion through no- or low-till-farming. Finally, its
crop rotation system has successfully lowered the in- Reducing waste is just as important as increasing
cidence of plagues and diseases by introducing new production. In warm climates such as in Asia, for
intermediate crops into the rotation. The company’s instance, up to 25% of fresh produce is spoiled be-
main competitive advantage, however, is that such a tween production and consumption due to a lack
large agribusiness company can offer substantial vol- of cold chains. This provides opportunities for com-
umes of uniform, high quality crops, allowing it to panies in construction, warehousing, transport,
realize premium prices when selling the crop. shipping and packaging. Reducing waste therefore
makes business sense.
5.3 PROCESSING & LOGISTICS
The Processing & Logistics cluster consists of pri- Another important trend for the Processing & Lo-
mary processors of agricultural commodities that gistics cluster is that end consumers demand trace-
typically operate on a global scale and specialize in ability of the food products back through the sup-
specific products, regions or trade routes. Over the ply chain. More than ever, consumers expect to
28 © SAM 2012SAM Study – Investing in Food and Agribusiness
Harvesting Opportunities for a Sustainable Food Supply
know where their food has been produced, and ing agricultural products. Sophisticated IT systems In warm climates
demand guarantees that environmental, social and allow companies to constantly monitor the move- such as in Asia,
hygienic standards have been met. They are even ment of large amounts of goods over long dis- for instance, up to
often willing to pay a premium for safety and trans- tances and immediately identify and resolve any 25% of fresh
parency. This favors companies that can monitor problems in the supply chain. Companies that con- produce is spoiled
the flow of goods and guarantee their quality tinually invest in systems and software can build a between production
throughout the value chain. competitive edge over their peers. and consumption
due to a lack of cold
Over the past decade, technology has become in- Agricultural commodity global trade volumes will chains.
creasingly important for processing and distribut- continue to experience strong growth:
Table 4: Growth in global agricultural commodity exports
Source: FAO, SAM-estimates
1991–1995 1996–2000 2001–2005 2006–2010 Future trends
Average annual growth rates of global export 2.8% 0.8% 3.7% 2.8% 2.5– 3.5% p.a.
volumes (t) for wheat, sugar, cotton, coffee, corn, over the next 5
and soybeans years
Margins constant constant constant constant constant
CASE STUDY: high utilization rate of its railways and loading
TRANSPORTING GRAINS ACROSS THE PLAINS facilities. In addition, the company is constantly
Canada already exports substantial volumes of improving its supply chain management systems
grains, oilseeds and processed food, with Asian in order to provide their customers with more
destinations showing the strongest demand sophisticated end-to-end support. As reliable
growth. Agricultural commodities, fertilizers and logistics services play an increasingly important role
timber in Canada are primarily transported by rail, in ensuring that food cultivated in naturally abun-
which offers the most cost-effective means of dant yet remote locations reaches customers with
transportation. Canada’s leading private railway guaranteed quality, on time and without losses, the
company has made significant investments in its company is well-positioned to profit from the
network and in efficient intermodal connections to expected growth of exports of agricultural com-
road and sea. These investments have yielded a modities and food from Canada to Asia.
© SAM 2012 29SAM Study – Investing in Food and Agribusiness
Harvesting Opportunities for a Sustainable Food Supply
5.4 PACKAGED FOOD & BEVERAGES Emerging market exposure is expected to make a
The Packaged Food and Beverage cluster in- greater contribution towards the future growth of
cludes manufacturers, distributors and retailers, the packaged food sector. Approximately 80 % of
representing the downstream portion of the ag- the global population growth will come from
ricultural value chain, providing a direct link to emerging markets, making these countries essen-
the consumer. The global packaged food and tial for future growth. Recent mergers & acquisi-
non-alcoholic beverage market was valued at tions (M&A) and investment activity by large global
USD 2.8 trillion in retail sales in 2010 with ap- players have been directed at increasing exposure
proximately 60 % of sales coming from devel- to China and India in particular, which combined,
oped markets and 40 % from emerging mar- account for over one third of the global population.
kets. Generally, as consumers become wealth-
10
The economic slowdown in the US and Western
ier, their demand for food shifts from basic com- Europe has placed additional importance on com-
modities towards prepared and packaged food, panies’ emerging market strategies.
convenience offerings and foods that offer
higher nutritional and health benefits. Recently, Regional food preferences vary greatly and prod-
packaged food companies have placed addi- ucts need to be tailored to local tastes. In addition,
tional emphasis on developing healthier food price points and distribution methods also have to
10
Global Food & Beverage: 10-year
sales growth history and 4-year
portfolios. Innovations focusing on health and be adapted to the local market. However, lessons
growth projections… who are the convenience are key long-term drivers for the learned and experience gained in emerging mar-
winners and losers?, Bernstein
Research, July 14, 2011 industry. kets can also be applied globally and products
DAIRY
The dairy sector offers unique opportunities: in terms of volume, demand is expected to grow by approxi
mately 60% through 2050. Dairy products can be categorized into three groups: fresh milk and its de-
rivatives, which cannot be economically transported over long distances, internationally traded commod-
ity products such as milk powder and butter, and high value products such as cheeses, yoghurts, and
mixed drinks, which are traded internationally and sold as consumer goods. These branded products
represent interesting export opportunities, particularly for companies based in Western Europe, most of
which experienced a number of difficult years due to structural overproduction in the past.
30 © SAM 2012You can also read