SAND AND DUST STORMS IN THE MIDDLE EAST AND NORTH AFRICA (MENA) REGION
←
→
Page content transcription
If your browser does not render page correctly, please read the page content below
Public Disclosure Authorized

                               SAND AND DUST STORMS
                               IN THE MIDDLE EAST
                               AND NORTH AFRICA
                               (MENA) REGION
                               Sources, Costs, and Solutions
Public Disclosure Authorized

                                                                                            Fall 2019
Public Disclosure Authorized
Public Disclosure Authorized

                                                               Environment, Natural Resources & Blue Economy

   10117_Dust_CVR.indd 3                                                                              11/12/19 12:00 PM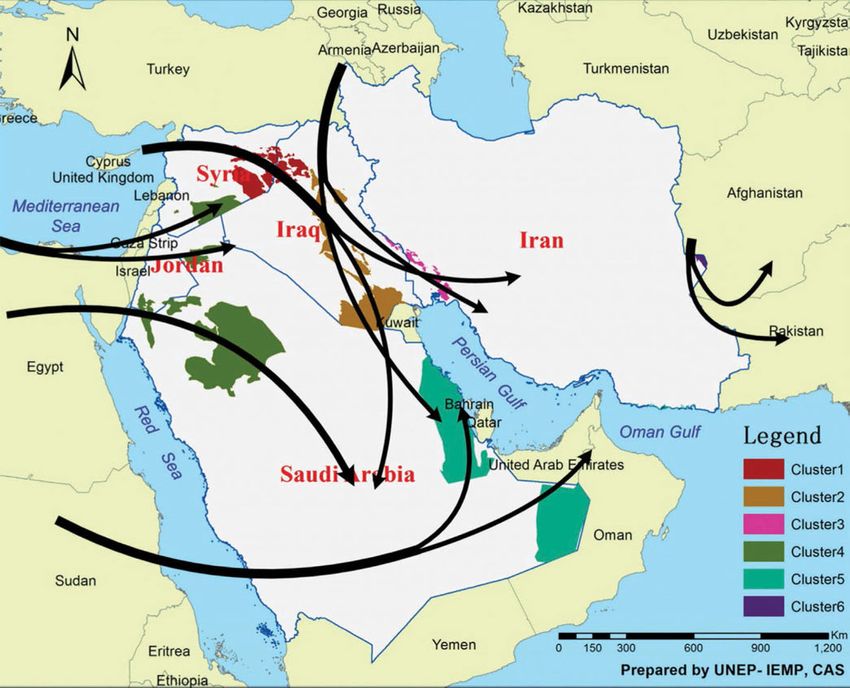
SAND AND DUST STORMS
             IN THE MIDDLE EAST
             AND NORTH AFRICA
             (MENA) REGION
             SOURCES, COSTS, AND SOLUTIONS

10117_Dust.indd 1                            11/18/19 11:01 AM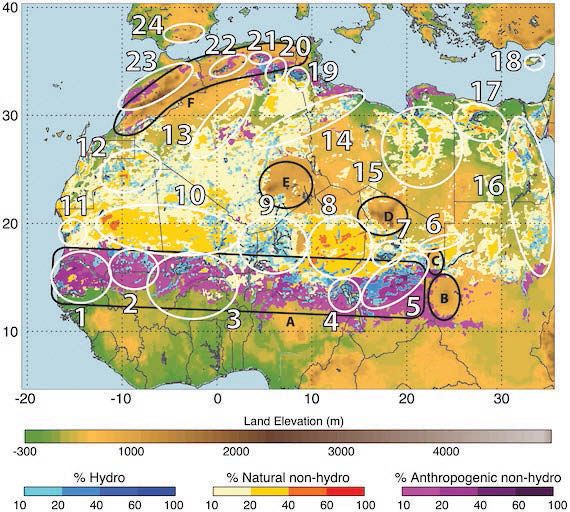
© 2019 International Bank for Reconstruction and Development/The World Bank

        1818 H Street NW
        Washington, DC 20433
        Telephone: 202-473-1000
        Internet: www.worldbank.org

        This work is a product of the staff of The World Bank with external contributions. The findings, interpretations, and
        conclusions expressed in this work do not necessarily reflect the views of The World Bank, its Board of Executive Direc-
        tors, or the governments they represent.

        The World Bank does not guarantee the accuracy of the data included in this work. The boundaries, colors, denomina-
        tions, and other information shown on any map in this work do not imply any judgment on the part of The World Bank
        concerning the legal status of any territory or the endorsement or acceptance of such boundaries.

        Rights and Permissions

        The material in this work is subject to copyright. The World Bank encourages dissemination of its knowledge, this work
        may be reproduced, in whole or in part, for noncommercial purposes as long as full attribution to this work is given.

        Attribution—Please cite the work as follows: World Bank. 2019. Sand and Dust Storms in the Middle East and North Africa
        Region—Sources, Costs, and Solutions. Washington, DC.

        Any queries on rights and licenses, including subsidiary rights, should be addressed to:

        World Bank Publications
        The World Bank Group
        1818 H Street NW
        Washington, DC 20433
        USA
        Fax: 202-522-2625

10117_Dust.indd 2                                                                                                              11/18/19 11:01 AM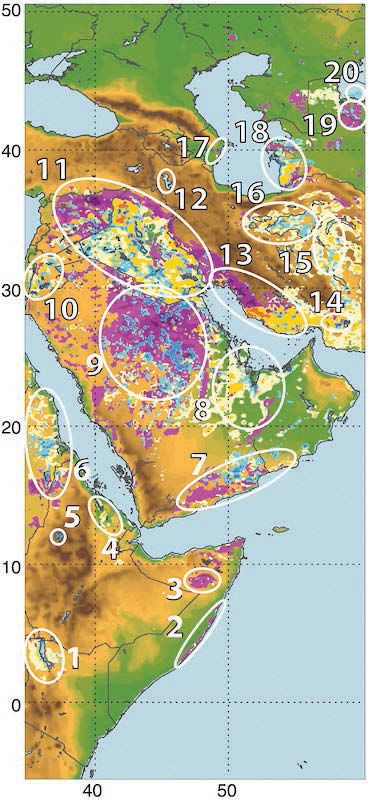
TABLE OF CONTENTS

             Acknowledgments .  .  .  .  .  .  .  .  .  .  .  .  .  .  .  .  .  .  .  .  .  .  .  .  .  .  .  .  .  .  .  .  .  .  .  .  .  .  .  .  .  .  .  .  .  .  .  .  .  .  .  .  .  .  .  .  .  .  .  .  .  .  .  .  .  . v
             Acronyms and Abbreviations .  .  .  .  .  .  .  .  .  .  .  .  .  .  .  .  .  .  .  .  .  .  .  .  .  .  .  .  .  .  .  .  .  .  .  .  .  .  .  .  .  .  .  .  .  .  .  .  .  .  .  .  .  .  . vi
             Executive Summary .  .  .  .  .  .  .  .  .  .  .  .  .  .  .  .  .  .  .  .  .  .  .  .  .  .  .  .  .  .  .  .  .  .  .  .  .  .  .  .  .  .  .  .  .  .  .  .  .  .  .  .  .  .  .  .  .  .  .  .  .  .  . viii

             Trends and Sources of Dust Storms in MENA .  .  .  .  .  .  .  .  .  .  .  .  .  .  .  .  .  .  .  .  .  .  .  .  .  .  .  .  .  .  .  .  .  .  .  .  .  .  .  .  .  . 1
                       Dust Hot Spots and Trends .  .  .  .  .  .  .  .  .  .  .  .  .  .  .  .  .  .  .  .  .  .  .  .  .  .  .  .  .  .  .  .  .  .  .  .  .  .  .  .  .  .  .  .  .  .  .  .  .  .  .  .  .  .  .  . 1
                       Sources and Drivers of Sand and Dust Storms .  .  .  .  .  .  .  .  .  .  .  .  .  .  .  .  .  .  .  .  .  .  .  .  .  .  .  .  .  .  .  .  .  .  .  .  .  . 4
             Impacts of Increased Dust Concentration and Dust Storms .  .  .  .  .  .  .  .  .  .  .  .  .  .  .  .  .  .  .  .  .  .  .  .  .  . 10
                       Health Impacts of Dust Deposition .  .  .  .  .  .  .  .  .  .  .  .  .  .  .  .  .  .  .  .  .  .  .  .  .  .  .  .  .  .  .  .  .  .  .  .  .  .  .  .  .  .  .  .  .  .  .  . 10
                       Environmental Impacts of Dust .  .  .  .  .  .  .  .  .  .  .  .  .  .  .  .  .  .  .  .  .  .  .  .  .  .  .  .  .  .  .  .  .  .  .  .  .  .  .  .  .  .  .  .  .  .  .  .  .  .  . 14
                       Economic Costs of Dust . . . . . . . . . . . . . . . . . . . . . . . . . . . . . . . . . . . . . . . . . . . . . . . . . . . . . . . . . 15
             Preventative Actions, Interventions, and Policies against Sand and Dust Storms .  .  .  .  .  .  . 19
                       Early Warning Systems for Dust Storm Prediction  .  .  .  .  .  .  .  .  .  .  .  .  .  .  .  .  .  .  .  .  .  .  .  .  .  .  .  .  .  .  .  .  . 19
                       Technical Interventions .  .  .  .  .  .  .  .  .  .  .  .  .  .  .  .  .  .  .  .  .  .  .  .  .  .  .  .  .  .  .  .  .  .  .  .  .  .  .  .  .  .  .  .  .  .  .  .  .  .  .  .  .  .  .  .  . 22
                       National and Regional Government Policies .  .  .  .  .  .  .  .  .  .  .  .  .  .  .  .  .  .  .  .  .  .  .  .  .  .  .  .  .  .  .  .  .  .  .  .  .  .  . 23
             References .  .  .  .  .  .  .  .  .  .  .  .  .  .  .  .  .  .  .  .  .  .  .  .  .  .  .  .  .  .  .  .  .  .  .  .  .  .  .  .  .  .  .  .  .  .  .  .  .  .  .  .  .  .  .  .  .  .  .  .  .  .  .  .  .  .  .  .  .  .  . 27

             Glossary .  .  .  .  .  .  .  .  .  .  .  .  .  .  .  .  .  .  .  .  .  .  .  .  .  .  .  .  .  .  .  .  .  .  .  .  .  .  .  .  .  .  .  .  .  .  .  .  .  .  .  .  .  .  .  .  .  .  .  .  .  .  .  .  .  .  .  .  .  .  .  .  . 35

             Sources, Costs, and Solutions                                                                                                                                                                                                               iii

10117_Dust.indd 3                                                                                                                                                                                                                                    11/18/19 11:01 AM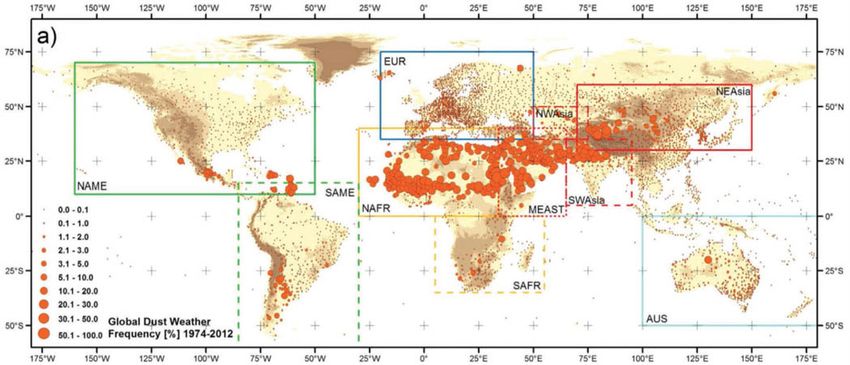
FIGURES
        Figure 1: Global Pattern of Dust Frequency Estimated from the Synoptic Present Weather
        Records for the Period of January 1974 to December 2012 .  .  .  .  .  .  .  .  .  .  .  .  .  .  .  .  .  .  .  .  .  .  .  .  .  .  .  .  .  .  . 2
        Figure 2: Geographic Distribution of the Dust Atmospheric Load  .  .  .  .  .  .  .  .  .  .  .  .  .  .  .  .  .  .  .  .  .  .  .  .  . 3
        Figure 3: Time Series of Global Monthly Mean Dust Concentration and the Corresponding
        95% Confidence Interval (in error bars) for the Period 1974–2012  .  .  .  .  .  .  .  .  .  .  .  .  .  .  .  .  .  .  .  .  .  .  .  .  . 3
        Figure 4: Sand and Dust Storms Path and Source Clusters in MENA .  .  .  .  .  .  .  .  .  .  .  .  .  .  .  .  .  .  .  .  .  . 5
        Figure 5: Distribution of the Percentage Number of Days per Year with Dust
        Optical Depth > 0.2 over North Africa .  .  .  .  .  .  .  .  .  .  .  .  .  .  .  .  .  .  .  .  .  .  .  .  .  .  .  .  .  .  .  .  .  .  .  .  .  .  .  .  .  .  .  .  .  .  .  .  .  . 6
        Figure 6: Distribution of the Percentage Number of Days per Year with Dust
        Optical Depth > 0.2 over the Middle East  .  .  .  .  .  .  .  .  .  .  .  .  .  .  .  .  .  .  .  .  .  .  .  .  .  .  .  .  .  .  .  .  .  .  .  .  .  .  .  .  .  .  .  .  .  .  . 7
        Figure 7: Global PM10 Levels and DALYs  .  .  .  .  .  .  .  .  .  .  .  .  .  .  .  .  .  .  .  .  .  .  .  .  .  .  .  .  .  .  .  .  .  .  .  .  .  .  .  .  .  .  .  .  .  .  . 11
        Figure 8: Annual PM10 Concentration, Deaths, and DALYs in MENA Countries .  .  .  .  .  .  .  .  .  .  .  .  . 12
        Figure 9: Technologies for Sand and Dust Storm Monitoring .  .  .  .  .  .  .  .  .  .  .  .  .  .  .  .  .  .  .  .  .  .  .  .  .  .  . 20

        TABLES

        Table 1: Key Physical Factors Influencing Wind Erosion .  .  .  .  .  .  .  .  .  .  .  .  .  .  .  .  .  .  .  .  .  .  .  .  .  .  .  .  .  .  .  .  .  . 8
        Table 2: Short-term and Long-term Impacts of Sand and Dust Storms .  .  .  .  .  .  .  .  .  .  .  .  .  .  .  .  .  . 16
        Table 3: Welfare Losses from Ambient PM2.5 by Region (2011 US$ billions—
        PPP adjusted) .  .  .  .  .  .  .  .  .  .  .  .  .  .  .  .  .  .  .  .  .  .  .  .  .  .  .  .  .  .  .  .  .  .  .  .  .  .  .  .  .  .  .  .  .  .  .  .  .  .  .  .  .  .  .  .  .  .  .  .  .  .  .  .  .  .  .  .  .  .  . 17
        Table 4: Mean Annual PM2.5, and Total Deaths and Losses from Pollution by Country .  .  .  .  .  . 18
        Table 5: Institutions and Organizations with Dust Forecasting Programs  .  .  .  .  .  .  .  .  .  .  .  .  .  .  . 22

        BOXES
        Box 1: Indirect Human-Induced Factors That Contribute to Sand and Dust Storms  .  .  .  .  .  .  .  . 9
        Box 2: Economic Cost Case Studies .  .  .  .  .  .  .  .  .  .  .  .  .  .  .  .  .  .  .  .  .  .  .  .  .  .  .  .  .  .  .  .  .  .  .  .  .  .  .  .  .  .  .  .  .  .  .  .  .  .  . 17
        Box 3: UN-Interagency Response to SDS .  .  .  .  .  .  .  .  .  .  .  .  .  .  .  .  .  .  .  .  .  .  .  .  .  .  .  .  .  .  .  .  .  .  .  .  .  .  .  .  .  .  .  .  . 24
        Box 4: Regional Air Pollution Policies .  .  .  .  .  .  .  .  .  .  .  .  .  .  .  .  .  .  .  .  .  .  .  .  .  .  .  .  .  .  .  .  .  .  .  .  .  .  .  .  .  .  .  .  .  .  .  .  . 26

        iv                                                                                                                                     Sand and Dust Storms in the Middle East and North Africa (MENA) Region

10117_Dust.indd 4                                                                                                                                                                                                                              11/18/19 11:01 AM
ACKNOWLEDGMENTS

             This report was prepared by Menaal Ebrahim under the guidance of Craig Meisner, Senior
             Environmental Economist of the World Bank.

             The team would like to thank their colleagues from the World Bank for their useful advice
             and support throughout this project: Benoit Blarel, Practice Manager, Lia Sieghart, Practice
             Manager, Tim Brown, Senior Natural Resources Management Specialist, Philippe Dardel,
             Senior Environmental Specialist, Raffaello Cervigni, Lead Environmental Economist, Paola
             Agostini, Lead Natural Resources Management Specialist, and Melissa Landesz, Senior
             Natural Resources Management Specialist. The team would also like to acknowledge the
             financial support of this study through the Program for Forests (PROFOR) Trust Fund.

             Sources, Costs, and Solutions                                                                       v

10117_Dust.indd 5                                                                                           11/18/19 11:01 AM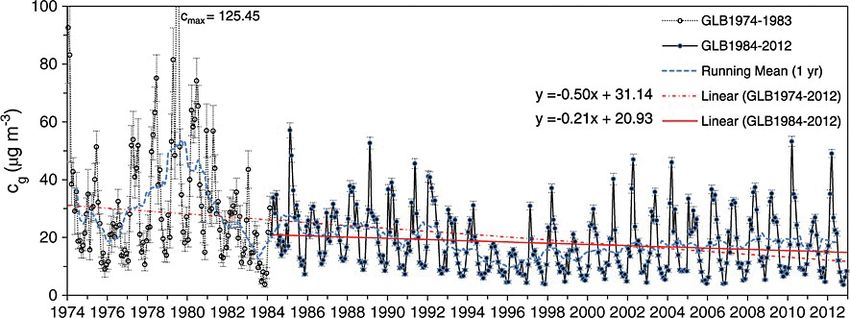
ACRONYMS AND
        ABBREVIATIONS

        ADB         Asian Development Bank
        AEMET       Meteorological State Agency of Spain
        AI          Aerosol Index
        APINA       Air Pollution Information Network for Africa
        ASEAN       Association of Southeast Asian Nations
        AUD         Australian Dollar
        CAWAS       Centre for Atmosphere Watch and Services (China)
        CLRTAP      Convention on Long-Range Transboundary Air Pollution
        CNY         Chinese Yuan
        COPD        Chronic Obstructive Pulmonary Disease
        DALYs       Disability-Adjusted Life Years
        ECMWF       European Center for Medium-range Weather Forecasting (UK)
        FAO         Food & Agriculture Organization
        GDP         Gross Domestic Product
        IARS        Inertial Altitude Reference System
        IASI        Infrared Atmospheric Sounding Interferometer
        ICAO        International Civil Aviation Organization
        IHME        Institute of Health Metrics and Evaluation
        ITU         International Telecommunication Union
        IUCN        International Union for Conservation of Nature
        KMA         Korea Meteorological Administration
        km2         Square kilometers
        MENA        Middle East and North Africa
        MODIS       Moderate Resolution Imaging Spectroradiometer
        NIES        National Institute for Environmental Studies (Japan)
        NWS         National Weather Service (USA)
        PM2.5       Particulate Matter (diameter less than 2.5 microns)
        PM10        Particulate Matter (diameter less than 10 microns)
        PEF         Peak Expiratory Flow
        PPP         Purchasing Power Parity
        RAPIDC      Regional Air Pollution in Developing Countries
        RC          Regional Centre
        SA          Source Apportionment
        SACEP       South Asia Cooperative Environment Programme
        SCS         Soil Conservation Service (USA)
        SDS         Sand and Dust Storm
        SDS-WAS     Sand and Dust Storm Warning Advisory and Assessment System
        SMS         Short Message Service
        UAE         United Arab Emirates
        UAV         Unmanned Aerial Vehicle
        UN          United Nations
        UNCCD       United Nations Convention to Combat Desertification
        UNDP        United Nations Development Programme
        UNECE       United Nations Economic Commission for Europe
        UNEP        United Nations Environment Programme

        vi                                            Sand and Dust Storms in the Middle East and North Africa (MENA) Region

10117_Dust.indd 6                                                                                                          11/18/19 11:01 AM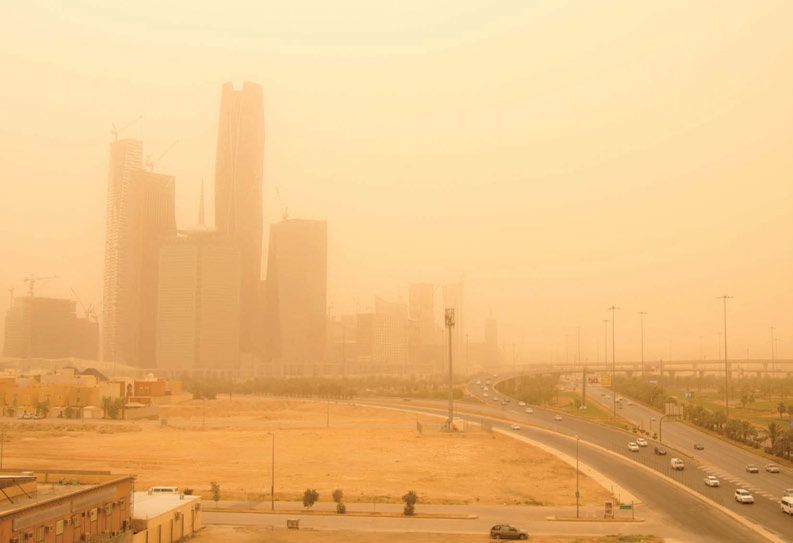
UNESCAP              United Nations Economic and Social Commission for Asia and Pacific
             UNESCWA              United Nations Economic and Social Commission for Western Asia
             UN-Habitat           United Nations Human Settlement Programme
             UNITAR               United Nations Institute for Training and Research
             USD                  United States Dollars
             WHO                  World Health Organization
             WMO                  World Meteorological Organization
             WRF                  Weather Research and Forecasting
             WSN                  Wireless Sensor Network

             Sources, Costs, and Solutions                                                                vii

10117_Dust.indd 7                                                                                      11/18/19 11:01 AM
EXECUTIVE SUMMARY

        Dust storms are capable of transporting sediment over thousands of kilome-
        ters, but due to the Middle East and North Africa (MENA) region’s proximity
        to the Sahara Desert, the region is one of the dustiest in the world. Dust storms
        are transboundary, which has important implications for their mitigation, as effects are felt in
        different countries and even regions than their source of origin. North African dust is trans-
        ported to as far away as the Amazon Forest, North America, Europe, and China. The Sahara
        Desert is undoubtedly the biggest dust source, as its dust emissions are about four times as
        much as Arabian deserts. North Africa, the Middle East, South West Asia, and North East
        Asia are the regions with the highest dust frequencies and highest Aerosol Index (AI) values.
        The highest density of dust sources in the Middle East is found in northern Iraq between the
        Tigris and Euphrates rivers and along the Syria-Iraq border. Dust sources in the region are
        also generally found in areas with extensive desert cover, low population densities, and sparse
        agriculture concentrated along river valleys. In terms of occurrences of dust storms, Sudan,
        Iraq, Saudi Arabia, and the Persian Gulf report the greatest number of dust storms overall.

        While natural sources such as the Sahara are the main contributors to dust
        storms in MENA, land-use changes and human-induced climate change has
        added anthropogenic sources as well. There are about three times as many natural
        dust sources as anthropogenic dust sources, however due to land use changes in the past few
        decades, anthropogenic sources have increased. Most North African dust storms originate from
        natural sources such as the Sahara, but there are some anthropogenic sources too. For instance,
        Southern Sahel, the Atlas Mountains, and the Mediterranean coast sources are overwhelmingly
        anthropogenic. The Middle East region also experiences dust storms from a mix of natural and
        anthropogenic sources. The Aral Sea is an active dust source, as well as dry riverbeds in Saudi
        Arabia. There is a cluster of anthropogenic and hydrologic sources along the Jordan River, par-
        ticularly on the east side. In addition, Iran has prominent dust sources such as large salty lakes
        and deserts, but the northwestern part is anthropogenic. Although much dust in the Middle East
        derives from local sources, substantial amounts of dust come from the Sahara.

        Like sources, drivers of sand and dust storms are also natural and anthropo-
        genic, as both wind speed and land management can cause them. Wind erosion is
        the main driver of sand storms and dust emissions in all systems. Essentially, erodibility of sur-
        face material coupled with aridity that limits protective effects of vegetation is a natural driving
        factor of sand and dust storms. For instance, the major dust storm event in 2015 in the Middle
        East has been attributed to the wind and arid conditions in the area rather than man-made fac-
        tors. However, there are many man-made drivers of wind erosion too. Human-induced land
        degradation is a driver of wind erosion and a major contributor toward sand and dust storms,
        as it exposes degraded and dry surfaces with a long wind fetch. Besides resource use and man-
        agement in drylands, practices that disrupt the hydrology and protection provided by land in
        general also contribute to sand and dust storms. In addition, land management practices that
        result in deforestation and clearance of vegetation will lead to an increase of wind velocity, as
        well as reduce the entrapment of particles. The complementary piece titled ‘Sustainable Land
        Management and Restoration in the Middle East and North Africa Region—Issues, Challenges, and Rec-
        ommendations’ provides details on land degradation severity, drivers, and impacts and provides
        insights into the human-induced drivers of dust storms in MENA.

        viii                                                       Sand and Dust Storms in the Middle East and North Africa (MENA) Region

10117_Dust.indd 8                                                                                                                       11/18/19 11:01 AM
Dust deposition has wide-ranging health impacts, such as causing and aggra-
vating asthma, bronchitis, respiratory diseases, and infections and lung
cancer. Populations far from the source regions are exposed to a wide range of air quality–
related health problems when long-range atmospheric transport carries dust. For instance,
African dust transported to the Caribbean and Florida has deteriorated air quality standards
in those areas and makes up half of South Florida’s airborne particles in the summer. Poor
air quality and dust cause numerous health problems, both near the dust storm and thou-
sands of kilometers away. Inhalation of fine particles can cause or aggravate diseases such as
asthma, bronchitis, emphysema, and silicosis. Chronic exposure can be linked to respiratory
disease, lung cancer, and acute lower respiratory infections.
Apart from devastating health impacts, dust also impacts the environment,
agriculture, transport, and infrastructure. For the environment, dust can have both
negative and positive effects. Dust storms have some positive global impacts due to their trans-
boundary nature and the importance of dust in global climate and terrestrial and biogeo-
chemical cycling. For instance, dust fertilizes and sustains both oceans and forests, playing
a huge part in the earth’s biogeochemical cycles. While dust boosts primary productivity of
oceans, it could have damaging effects on coral reefs. In addition, dust has been also associ-
ated with leading to and exacerbating climatic events such as storms, droughts, and the melt-
ing of glaciers. Dust deposition and dust storms are also associated with many other costs such
as crop damage, livestock mortality, infrastructure damage, and interruption of transport.
Globally, welfare losses from dust are approximately 3.6 trillion USD, where
costs are about 150 billion USD and over 2.5 percent of Gross Domestic Prod-
uct (GDP) on average in MENA. Dust storm costs range from negative health impacts
to reducing crop yields to lowering property values to steering talented workers away from
polluted places. The World Health Organization estimates that 7 million people die from
poor air quality every year, which is at least partly attributed to dust. A study prepared by the
World Bank and the Institute of Health Metrics and Evaluation (IHME) calculated welfare
losses from ambient PM2.5 pollution for each country, where welfare losses represent the
cost of premature mortality. Global welfare losses from premature mortality are large and
increasing from 2.2 trillion in 1990 to 3.6 trillion USD in 2013. For MENA, dust concentra-
tion and storms cost MENA over 150 billion USD annually and over 2.5 percent of GDP
for most countries in the region. According to the UN, about 13 billion USD are lost every
year from dust storms alone in the MENA region and welfare losses from PM2.5 alone were
about 141 billion USD in 2013. The biggest welfare losses were incurred by Egypt, Iran, and
Pakistan.
Besides investing in early warning systems, governments all over the world
are designing policies to mitigate the impact of sand and dust storms, both
at national and regional levels. Devastating impacts from sand and dust storms in the
Americas, MENA region, and East Asia have encouraged governments to enforce many
large-scale initiatives and plans. In many instances, these initiatives also tackle land degra-
dation, terrestrial biodiversity, and climate change mitigation. However, policies designed to
mitigate the wider impacts of sand and dust storms, including many that are transboundary,
are geographically patchy and have a much shorter history. Regional and international coop-
eration among countries will lead to greater understanding of the transportation paths of
dust storms, particle content, and their impacts. Eventually, regional action will also lead to
reduced the occurrence of dust storms. Recent years have seen some regional air pollution
policies emerge, but more collaboration is needed and should be sustained.
Sources, Costs, and Solutions ix
10117_Dust.indd 9 11/18/19 11:01 AM10117_Dust.indd 10 11/18/19 11:01 AM
TRENDS AND SOURCES OF DUST
             STORMS IN MENA

             Sand and dust storms (SDS) are complex events with transboundary impacts. Sand and
             dust storms result from the erosion and transport of mineral sediments from land. Sand
             particles are larger than dust, but both are typically associated with dryland areas and can
             occur anywhere where there are dry unprotected sediments.1 They could lift large quanti-
             ties of dust particles into the air and transport them hundreds or thousands of kilometers
             away.2 SDS occur because of interlinked direct and indirect drivers, divided into natural and
             anthropogenic sources. Concern on sand and dust storms is growing considering their huge
             impacts on the economy, human health, and the environment.

             DUST HOT SPOTS AND TRENDS
             The MENA region, which neighbors the Sahara Desert, is the dustiest region
             in the world. Nine regions contribute to the total global production of desert dust: North
             Africa (Sahara), South Africa, the Arabian Peninsula, Central Asia, Western China, Eastern
             China, North America, South America and Australia.3, 4 North Africa, the Middle East,
             South West Asia, and North East Asia are the regions with the highest dust frequencies, as
             observed from synoptic weather reports (Figure 1).5 Similarly, in terms of Aerosol Index
             (AI) hot spots, the Sahara and Asian deserts are dominant, whereas AI values are low in
             the Southern Hemisphere and the Americas.6 The dust observed in the Caribbean is trans-
             ported dust from the Sahara, while the dust observed in Mexico may be partly related to the
             dust activities in the Chihuahua Desert.7, 8 The Sahara Desert is undoubtedly the biggest
             dust source, as its dust emissions are about four times as much as Arabian deserts.

             Dust can travel thousands of kilometers, as North African dust is transported
             as far as the Caribbean. Dust storms are capable of transporting sediment over thou-
             sands of kilometers. Dust storms are transboundary, which has important implications for their

             1Middleton    and Goudie, Desert Dust in the Global System.
             2Zoljoodi,  Didevarasl, and Saadatabadi, “Dust Events in the Western Parts of Iran and the Relationship with Drought
             Expansion over the Dust-Source Areas in Iraq and Syria.”
             3Prospero et al., “Environmental Characterization of Global Sources of Atmospheric Soil Dust Identified with the Nimbus 7

             Total Ozone Mapping Spectrometer (TOMS) Absorbing Aerosol Product.”
             4Tanaka and Chiba, “A Numerical Study of the Contributions of Dust Source Regions to the Global Dust Budget.”
             5Shao, Klose, and Wyrwoll, “Recent Global Dust Trend and Connections to Climate Forcing.”
             6Middleton and Goudie, Desert Dust in the Global System.
             7Prospero, “Long-Range Transport of Mineral Dust in the Global Atmosphere.”
             8Liu et al., “CALIPSO Lidar Observations of the Optical Properties of Saharan Dust.”

             Sources, Costs, and Solutions                                                                                                    1

10117_Dust.indd 1                                                                                                                        11/18/19 11:01 AM
FIGURE 1: GLOBAL PATTERN OF DUST FREQUENCY ESTIMATED FROM THE SYNOPTIC
PRESENT WEATHER RECORDS FOR THE PERIOD OF JANUARY 1974 TO DECEMBER 2012
Source: Shao et al., 2013.
mitigation, as effects are felt in different countries and even regions than their source of origin.
For instance, dust from China can reach the European Alps, after being transported across
the Pacific and Atlantic Oceans over 13 days.9 Dust from Central Asia and China reaches
Korea, Japan, the Pacific Islands, and North America.10 Based on estimates made by Tanaka
and Chiba (2006), Figure 2 shows the geographical distribution of the desert dust atmospheric
loads, in mg m−2.11 North African dust is transported to as far away as the Amazon Forest,
North America, Europe, and China. The westward dust movement from the Sahara is the
largest flow, accounting for 30–50 percent of the output. For example, transport to the Carib-
bean, where 20 million tons of Saharan dust are deposited annually, typically takes 5 to 7 days.
While dust emissions have generally been high and increased over the last
century, the past two decades have not seen a rise in emissions from the North
Africa region. Simulations suggest that global annual dust emissions have increased by 25
to 50 percent over the last century due to a combination of land use and climate changes.
Sand and dust storm frequency and severity have increased in recent decades in some areas
but decreased in other areas. However, a recent analysis by Shao et al. (2013) revealed that
over the period 1984–2012, the global mean of near-surface dust concentration decreased
at 1.2 percent per year (Figure 3).12 This decrease is mainly due to reduced dust activities
in North Africa, accompanied by reduced activities in Northeast Asia, South America, and
South Africa. This could be attributed to recovery of vegetation because of rainfall following
the droughts in the 1980s, leading to a reduction in wind.13 However other studies conclude
that a reduction in wind cannot be directly linked to changes in land use.14
9Grousset et al., “Case Study of a Chinese Dust Plume Reaching the French Alps.”
10Middleton and Goudie, Desert Dust in the Global System.
11Tanaka and Chiba, “A Numerical Study of the Contributions of Dust Source Regions to the Global Dust Budget.”
12Shao, Klose, and Wyrwoll, “Recent Global Dust Trend and Connections to Climate Forcing.”
13Cowie, Knippertz, and Marsham, “Are Vegetation-Related Roughness Changes the Cause of the Recent Decrease in Dust
Emission from the Sahel?”
14Ridley, Heald, and Prospero, “What Controls the Recent Changes in African Mineral Dust Aerosol across the Atlantic?”
2 Sand and Dust Storms in the Middle East and North Africa (MENA) Region
10117_Dust.indd 2 11/18/19 11:01 AMFIGURE 2: GEOGRAPHIC DISTRIBUTION OF THE DUST ATMOSPHERIC LOAD
Source: De Longueville et al., 2010.15
FIGURE 3: TIME SERIES OF GLOBAL MONTHLY MEAN DUST CONCENTRATION
AND THE CORRESPONDING 95% CONFIDENCE INTERVAL (IN ERROR BARS)
FOR THE PERIOD 1974–2012
Source: Shao et al., 2013.
15De
Longueville et al., “What Do We Know about Effects of Desert Dust on Air Quality and Human Health in West Africa
Compared to Other Regions?”
Sources, Costs, and Solutions 3
10117_Dust.indd 3 11/18/19 11:01 AMCountries in the Middle East experience varying frequencies of dust storms
depending on the time of year. The Middle East region is a notable dust hot spot, espe-
cially during the summer months when the dust storms in the region are often associated
with Shamal winds.16 Sudan, Iraq, Saudi Arabia, and the Persian Gulf report the greatest
number of dust storms overall.17 In the summer months, Iran, Iraq, Syria, the Persian Gulf,
and the southern Arabian Peninsula experience the most dust storms. In western Iraq and
Syria, Jordan, Lebanon, northern Israel, northern Arabian Peninsula, and southern Egypt
they occur mainly in the spring, while in southern Israel and in the Mediterranean parts of
northern Egypt, they occur in winter and spring.18
Sand and dust storms in MENA are determined by numerous climate systems
and pathways. There are a variety of climate systems that govern the distribution of
sand and dust storm events in the MENA region such as the Siberian, polar, and monsoon
cyclones, and the depressions in the non-summer months. In MENA, most of dust storm
systems can be classified into Summer Shamal and frontal dust storms.19 Shamal dust storms
usually occur across Iraq, Kuwait, western part of Khuzestan plain, and some parts of Ara-
bian Peninsula, whereas frontal dust storms occur across Jordan, Israel, and the northern
Arabian Peninsula.20 There are six main sand and dust storm paths dominated by the cli-
mate in MENA (Figure 4). The first path originates from the Mediterranean Sea passing over
Cyprus and enters Syria. The second path is under the control of a high-pressure system
over east of Europe.21 The third path comes from south of the Mediterranean Sea or coastal
of northern Africa and always strikes south of Syria or the north border of Jordan and Saudi
Arabia. The fourth path is from north of Africa which usually passes across Egypt, north of
the Red Sea, and blows toward southeast in Saudi Arabia.22 The fifth path is also located
in the depressions in north of Africa. The last path originates from Sistan Plain at the Iran–
Afghanistan border which is controlled by anticyclone over central Asia. Air masses from the
Mediterranean Sea are important factors for the generation of sand and dust storms which
cover about 70 percent dust storm events.23
SOURCES AND DRIVERS OF SAND
AND DUST STORMS
SOURCES OF SAND AND DUST STORMS
Sand and dust storm sources and drivers are both natural and anthropogenic.
There is need to distinguish drivers of sand and dust storms from natural sources, which sup-
ply most of the global dust emissions and anthropogenic sources. However natural ecosys-
tems are increasingly being subject to human pressure, which may intensify their importance
as source areas in the future.24 Although there is currently much uncertainty on the mag-
nitude of human activity on sand and dust storms, disturbance of natural systems through
human pressure is highly likely to increase in the coming decades, including through human-
induced climate change.
16Choobari, Zawar-Reza, and Sturman, “The Global Distribution of Mineral Dust and Its Impacts on the Climate System.”
17Furman, “Dust Storms in the Middle East.”
18Ibid.
19Hamidi, Kavianpour, and Shao, “Synoptic Analysis of Dust Storms in the Middle East.”
20Middleton, “Dust Storms in the Middle East.”
21Hamidi, Kavianpour, and Shao, “Synoptic Analysis of Dust Storms in the Middle East.”
22Wilderson, “Dust and Sand Forecasting in Iraq and Adjoining Countries.”
23Cao et al., “Identification of Dust Storm Source Areas in West Asia Using Multiple Environmental Datasets.”
24Assessment, Millennium Ecosystem.
4 Sand and Dust Storms in the Middle East and North Africa (MENA) Region
10117_Dust.indd 4 11/18/19 11:01 AMFIGURE 4: SAND AND DUST STORMS PATH AND SOURCE CLUSTERS IN MENA
Source: Cao et al., 2015.
Globally, there are about three times as many natural dust sources as anthro-
pogenic dust sources; however, due to land use changes in the past few decades,
anthropogenic sources have increased. There are three dust source types: hydrologic,
dust linked to various water features as discussed above; natural, dust emitted from land
surfaces where land use is less than 30 percent; and anthropogenic, sources where land use
exceeds 30 percent. North Africa accounts for 55 percent of global dust emissions with only
8 percent being anthropogenic, mostly from the Sahel. Hydrologic dust sources (e.g., ephem-
eral water bodies) account for 31 percent worldwide; 15 percent of them are natural while
85 percent are anthropogenic. Overall, natural dust sources globally account for 75 percent
of emissions and anthropogenic sources account for the rest.
Most North African dust comes from natural sources such as the Sahara,
with some anthropogenic sources. Southern Sahel sources are overwhelmingly
anthropogenic (locations 1 to 5), whereas the Sahara is the most significant natural
Sources, Costs, and Solutions 5
10117_Dust.indd 5 11/18/19 11:01 AMFIGURE 5: DISTRIBUTION OF THE PERCENTAGE NUMBER OF DAYS
PER YEAR WITH DUST OPTICAL DEPTH > 0.2 OVER NORTH AFRICA
Source: Ginoux et al., 2012.25
source (locations 6 to 11) (Figure 5). This could be explained by the fact that agricultural
and grazing activities in regions with some rainfall are confined to relatively localized areas
around point sources of water, and most agricultural and grazing activity takes place in wet-
ter areas.26 Analysis of thousands of years of dust deposition in the mouth of the Senegal
River showed a sharp increase in deposition after the advent of commercial agriculture in
the Sahel, about 200 years ago.27 The sources in the Atlas Mountains (locations 20 to 23) and
along the Mediterranean coast (e.g., location 19) are also mostly anthropogenic. Outside the
Sahel, the major sources are natural.28 These include major depressions, large basins with
sand seas, ephemeral lakes, and the Nile River Basin.
25Ginoux et al., “Global-Scale Attribution of Anthropogenic and Natural Dust Sources and Their Emission Rates Based on
MODIS Deep Blue Aerosol Products.”
26Prospero et al., “Environmental Characterization of Global Sources of Atmospheric Soil Dust Identified with the Nimbus 7
Total Ozone Mapping Spectrometer (TOMS) Absorbing Aerosol Product.”
27Mulitza et al., “Increase in African Dust Flux at the Onset of Commercial Agriculture in the Sahel Region.”
28Prospero et al., “Environmental Characterization of Global Sources of Atmospheric Soil Dust Identified with the Nimbus 7
Total Ozone Mapping Spectrometer (TOMS) Absorbing Aerosol Product.”
6 Sand and Dust Storms in the Middle East and North Africa (MENA) Region
10117_Dust.indd 6 11/18/19 11:01 AMFIGURE 6: DISTRIBUTION OF THE PERCENTAGE NUMBER
OF DAYS PER YEAR WITH DUST OPTICAL DEPTH > 0.2 OVER THE
MIDDLE EAST
Source: Ginoux et al., 2012.
The Middle East shows a complex mixture of natural and anthropogenic
sources. The Aral Sea was formerly one of the largest lakes in the world (area 68,000 km2)
but is now reduced to 10 percent of its original size. Large areas of the Aral Sea are now
active dust sources, in agreement with in situ measurements.29 There is an extensive area of
anthropogenic sources, mixed with hydrologic sources, in Saudi Arabia (location 9) essen-
tially aggregated around the dry riverbeds (Figure 6). The dust from the region between the
Tigris and Euphrates is mapped as natural in Iraq and anthropogenic in Syria. There is a
cluster of anthropogenic and hydrologic sources along the Jordan River, particularly on the
east side (location 10). Iran has prominent dust sources such as large salty lakes and deserts,
but the northwestern part is anthropogenic. Although much dust in the Middle East derives
from local sources, substantial amounts of dust come from the Sahara.
29Wiggs et al., “The Dynamics and Characteristics of Aeolian Dust in Dryland Central Asia.”
Sources, Costs, and Solutions 7
10117_Dust.indd 7 11/18/19 11:01 AMDRIVERS OF SAND AND DUST STORMS
Wind erosion is the main natural driver of dust storms, which is also depen-
dent on other climate and land characteristics. Wind is the main driver of sand
storms and dust emissions in all systems. Specific synoptic meteorological conditions that
produce winds vary in different regions.30 Globally about 32 million km2 of land is suscepti-
ble to wind erosion, with 17 million km2 having high or very high susceptibility.31 Erodibility
of surface material coupled with aridity that limits protective effects of vegetation is what
usually defines natural dust sources and dust storms. For instance, the major dust storm
event in 2015 in the Middle East has been attributed to the wind and arid conditions in the
area rather than man-made factors.32 Besides wind speed, other land form characteristics
also determine wind erosivity (Table 1). Considering these factors, the biggest dust sources
are therefore usually inland drainage basins or depressions in arid areas, such as the Bodele
Depression in the Sahara and the Taklamakan Desert in China.33, 34
TABLE 1: KEY PHYSICAL FACTORS INFLUENCING WIND EROSION
Climate Sediment or Soil Vegetation Landform
Wind speed (+) Soil type Type Surface roughness
Wind direction Particle composition Coverage (–) Slope (–)
Turbulence (+) Soil/sediment structure Density Ridge
Precipitation (–) Organic matter (–) Distribution (+/–)
Evaporation (+) Carbonates (–)
Air temperature Bulk density
Air pressure (+) Degree of aggregation (–)
Freeze-thaw action Surface moisture (–)
Source: UNEP, WMO, UNCCD, 2016; Shi et al., 2004; Middleton and Goudie, 2006.35
(+) indicates that the factor reinforces wind erosion, whereas (–) indicates that the factor has a protective effect, reducing wind
erosion. (+/–) indicates the effect can be positive or negative depending on the processes involved.
While climatic factors directly cause dust storms, there are several human-
induced factors that can alter those climatic factors. Human-induced land degra-
dation is a driver of wind erosion and a major contributor toward sand and dust storms, as
it exposes degraded and dry surfaces with a long wind fetch. Besides resource use and man-
agement in drylands, practices that disrupt the hydrology and protection provided by land
in general also contribute to sand and dust storms. For instance, demand for water for urban
areas or irrigation disturbs the hydrology of ephemeral lakes and playas. Building roads and
other infrastructure that blocks the inflow of drainage waters is another contributor to the
drying up of playas.36 Poor standards of crop management (e.g., related to soil fertility, seed
quality, tillage, planting, and pest and disease control) that result in poor vegetation growth
and soil cover increase risk of wind erosion. In addition, land management practices that
result in deforestation and clearance of vegetation will lead to an increase of wind velocity,
as well as reduce the entrapment of particles. The complementary piece titled ‘Sustainable
30Knippertz and Stuut, “Mineral Dust.”
31Eswaran, Lal, and Reich, “Land Degradation.”
32Parolari et al., “Climate, Not Conflict, Explains Extreme Middle East Dust Storm.”
33Bullard et al., “Preferential Dust Sources.”
34Thomas, Arid Zone Geomorphology.
35UNEP, WMO, UNCCD., “Global Assessment of Sand and Dust Storms.”
36Gill, “Eolian Sediments Generated by Anthropogenic Disturbance of Playas.”
8 Sand and Dust Storms in the Middle East and North Africa (MENA) Region
10117_Dust.indd 8 11/18/19 11:01 AMBOX 1: INDIRECT HUMAN-INDUCED FACTORS THAT CONTRIBUTE
TO SAND AND DUST STORMS
»» Population increase and economic globalization leading to increased demands for food,
feed, and other products
»» Failure of policy to recognize noneconomic ecosystem functions
»» Policies that unwittingly encourage unsustainable land management
»» Land use change to less sustainable uses
»» Use of prime agricultural land for urban development and waste disposal, thereby increas-
ing pressure on marginal land
»» Subsistence farming
»» Lack of access to rural credit, extension services, and markets
»» Poverty
»» Insecure land tenure
»» Migration to fragile land
»» Climate change
»» War and insecurity
Source: UNEP, WMO, UNCCD, 2016.
Land Management and Restoration in the Middle East and North Africa Region—Issues, Challenges, and
Recommendations’ provides details on land degradation severity, drivers and impacts and offers
insights into the man-made drivers of dust storms in MENA. There are also many other
indirect drivers of sand and dust storms, such as population increase, weak land tenure, pov-
erty, conflict, and climate change (Box 1).
Sources, Costs, and Solutions 9
10117_Dust.indd 9 11/18/19 11:01 AMIMPACTS OF INCREASED DUST
CONCENTRATION AND DUST
STORMS
Dust deposition has vast health, environmental, and economic impacts. Dust
can contribute to numerous human health problems globally, especially in arid and semiarid
regions. Inhalation of fine particles can cause or aggravate diseases such as asthma, bronchitis,
emphysema, and silicosis. Chronic exposure can be linked to respiratory disease, lung cancer,
and acute lower respiratory infections. For the environment, dust can have both negative and
positive effects. Dust affects the climate system and can lead to intensifying drought conditions,
but it also increases precipitation and provides nutrients to terrestrial ecosystems. In addition
to health and environmental impacts, there are other short-term costs of dust such as crop
damage, livestock mortality, infrastructure damage, and interruption of transport. Longer term
costs include health problems, soil erosion, and disruption of global climate regulation. Mone-
tizing these impacts can translate to hundreds of million dollars just from a single dust storm.
HEALTH IMPACTS OF DUST DEPOSITION
Dust storms often affect human life and health not only in the drylands but
also in downwind regions. As discussed in the previous chapter, dust emitted from the
North Africa region reaches as far as the rest of Africa, Middle East, Europe, Asia, the Carib-
bean and the Americas, impacting air quality in those regions too. Dust from Asia is shown
to contribute to aerosol loadings in western North America.37 African dust transported to the
Caribbean and Florida has deteriorated air quality standards in those areas and makes up
half of South Florida’s airborne particles in the summer.38 Therefore, populations far from
the source regions are exposed to a wide range of air quality related health problems.
Air quality, which is impacted by dust, is very poor in MENA. Airborne dust
particles, whether of natural origin and/or partially human from bush fires or practices
that lead to desertification, affect human health through their impact on local and regional
air qualities.39, 40 Airborne mineral dusts are respirable within size ranges of particles equal
37Fairlie,
Jacob, and Park, “The Impact of Transpacific Transport of Mineral Dust in the United States.”
38Prospero and Mayol-Bracero, “Understanding the Transport and Impact of African Dust on the Caribbean Basin.”
39Anuforom et al., “Inter-Annual Variability and Long-Term Trend of UV-Absorbing Aerosols during Harmattan Season in
Sub-Saharan West Africa.”
40Sassen et al., “Saharan Dust Storms and Indirect Aerosol Effects on Clouds.”
10 Sand and Dust Storms in the Middle East and North Africa (MENA) Region
10117_Dust.indd 10 11/18/19 11:01 AMto or less than a diameter of 2.5 microns (PM2.5) and coarse particles equal to or less than
10 microns (PM10), as defined by the US Environmental Protection Agency. In the United
States today, the following standards apply: the acceptable annual mean values of PM2.5
and PM10 are respectively 15 μg m−3 and 50 μg m−3 and the mean values over 24 h exceed-
ing respectively 65 μg m−3 and 150 μg m−3 are considered to exceed the standards.41 Dust
concentrations in the MENA region can reach well beyond these acceptable levels. Studies
have shown that dust storms in the Middle East are characterized by high concentrations of
particles with 2 to 20 μm diameter size, with more than 85 percent of them being less than
10 μm in diameter.42, 43
Increased dust concentrations can adversely affect health and even lead to
death. Ambient fine particulate matter (PM2.5) exposure is currently considered the lead-
ing environmental risk factor globally. Fine particulate matter can come from a variety of
sources and its determination can be ascertained through a source apportionment (SA)
study.44 Locations susceptible to high dust concentrations will have a larger contribution
and in general will have a larger impact on premature mortality.45, 46 WHO’s environmen-
tal burden of disease dataset that compiles PM10 levels and Disability Adjusted Life Years
(DALYs) (which considers years lost to mortality) in all countries, shows a positive correlation
between the two (Figure 7). It is estimated that PM2.5 exposure contributed to 4.1 million
premature deaths in 2016.47 The situation is worse in areas that are prone to frequent dust
events. Compared to other regions, MENA has one of the highest average PM2.5 and PM10
levels.48 Within MENA, populations in Iraq, Egypt, and Pakistan suffer disproportionately
more in terms of premature deaths—as many as 30,000 deaths can be attributed to bad air
quality (Figure 8).
FIGURE 7: GLOBAL PM10 LEVELS AND DALYs
6.0
5.0
DALYs/1,000 capita per year
4.0
3.0 y = 0.011x + 0.2725
2.0
1.0
0
0 50 100 150 200 250
Annual PM10 (ug/m3)
Source: Authors’ calculations based on WHO—Environmental burden of disease, 2004.
41Prospero, “Assessing the Impact of Advected African Dust on Air Quality and Health in the Eastern United States.”
42Perdue et al., “The Surgical Significance of Persian Gulf Sand.”
43Draxler et al., “Estimating PM Air Concentrations from Dust Storms in Iraq, Kuwait and Saudi Arabia.”
10
44The WHO maintains a database on source apportionment studies for particulate matter in the air (PM and PM ) at
10 2.5
https://www.who.int/quantifying_ehimpacts/global/source_apport/en/
45Perez et al., “Coarse Particles from Saharan Dust and Daily Mortality.”
46Samoli et al., “Does the Presence of Desert Dust Modify the Effect of PM on Mortality in Athens, Greece?”
10
47Gakidou et al., “Global, Regional, and National Comparative Risk Assessment of 84 Behavioural, Environmental and
Occupational, and Metabolic Risks or Clusters of Risks, 1990–2016.”
48World Health Organization, “Environmental Burden of Disease: Country Profiles.”
Sources, Costs, and Solutions 11
10117_Dust.indd 11 11/18/19 11:01 AMFIGURE 8: ANNUAL PM10 CONCENTRATION, DEATHS, AND DALYs
IN MENA COUNTRIES
DALYsa
*Annual **Urban /1000
Population PM10 Population Deaths Capital
Country (’000) [µg/m3] (%) per Year per Year
Afghanistan 24,076 27 16 400 0.3
Egypt 71,550 136 32 15,500 2
Iran 68,669 68 42 9,100 1.0
Iraq 27,456 167 58 10,300 6
Israel 6,574 53 80 1,400 1.1
Jordan 5,371 69 49 700 1.1
Kuwait 2,617 129 74 300 1.1
Lebanon 3,965 43 74 400 1.6
Libyan Arab Jamahiriya 5,799 121 85 1,800 3
Morocco 30,152 27 37 900 0.2
Oman 2,479 124 36 300 1.1
Pakistan 155,333 165 27 30,000 2.0
Qatar 764 57 65 100,000 and national capital.
aFor Outdoor Air Pollution, DALYs consist only of years of life lost to premature mortality (YLL).
RESPIRATORY/ASTHMA
Respiratory illnesses are one of the main health impacts of dust. Airborne dust
particles are transported via air inhaled through the nose or mouth and passed via the tra-
chea to the lung tissues. Exposure to dust therefore contributes to respiratory disorders such
as asthma, tracheitis, pneumonia, aspergillosis, allergic rhinitis, and nonindustrial silicosis.49
Dust has been strongly linked to Chronic Obstructive Pulmonary Disease (COPD), which is
an umbrella term used to describe progressive lung diseases including emphysema, chronic
bronchitis, and refractory (non-reversible) asthma. In Hong Kong, it was found that dust
events had a significant adverse impact on emergency hospital admissions for COPD.50 Epi-
demiological studies have also shown that increases in allergic rhinitis and daily admissions
and clinical visits for allergic diseases such as asthma coincided with Asian dust storms.51, 52
Pneumonia admissions have also been significantly associated with Asian dust storms in
Taipei.53 Desert dust also deteriorates pulmonary function. Recent studies have shown
49Derbyshire, “Natural Minerogenic Dust and Human Health.”
50Tam et al., “Effect of Dust Storm Events on Daily Emergency Admissions for Respiratory Diseases.”
51Chang et al., “Correlation of Asian Dust Storm Events with Daily Clinic Visits for Allergic Rhinitis in Taipei, Taiwan.”
52Kanatani et al., “Desert Dust Exposure Is Associated with Increased Risk of Asthma Hospitalization in Children.”
53Cheng et al., “Consequences of Exposure to Asian Dust Storm Events on Daily Pneumonia Hospital Admissions in Taipei,
Taiwan.”
12 Sand and Dust Storms in the Middle East and North Africa (MENA) Region
10117_Dust.indd 12 11/18/19 11:01 AMsignificantly reduced Peak Expiratory Flow (PEF) values and more increased PEF variability
during dust days than during the control days in Korea.54, 55, 56
There is strong evidence on the adverse impacts of dust on asthma. Asthma is one of the
world's leading noncommunicable diseases, and it affects about 334 million people each
year.57 There is plenty of evidence that shows dust causes or exacerbates asthmatic condi-
tions. Exposure to dust particles transported globally from desert storms is associated world-
wide with increased hospital admissions for childhood asthma and bronchitis, for example
in Japan, Trinidad, and Texas.58, 59, 60 The highest prevalence of asthma has been reported
in areas with desert dust storms events such as the MENA region.61, 62 In Greece, Saharan
dust events have been associated with a 2.5 percent increase in pediatric asthma hospital
admissions.63 Similarly, in Kuwait, dust storms led to an 8.4 percent increase in daily emer-
gency asthma admissions over a period of five years, which was particularly evident among
children.64 In Qatar, asthma cases are reported to increase by 30 percent during and shortly
after very windy conditions.65
CARDIOVASCULAR
Studies have found a positive correlation between dust events and cardio-
vascular illnesses, such as ischemic heart disease, cerebrovascular disease,
and hypertension among others. Epidemiological studies have found positive relations
between cardiovascular mortality and morbidity and dust storms. For instance, in Taiwan, a
study of 39 Asian dust storm events found drastic increases in cardiopulmonary emergency
visits when ambient PM10 concentrations were high and estimated that cardiovascular dis-
eases, ischemic heart diseases, and cerebrovascular diseases during the Asian dust events
increased by 26 percent, 35 percent, and 20 percent per event, respectively, compared to
the pre-dust periods in Taiwan.66 Another study in China found a significant association
between dust events and hypertension in men in Minqin China, and that the association of
dust events and cardiovascular hospitalization was stronger in spring than in winter.67 There
are some studies that have quantified cardiovascular health problems in MENA as well. The
2005 dust storm in Baghdad, Iraq, led to nearly 1,000 cases of suffocation.68 In Iran, dust
storms caused a 1 percent increase in cardiovascular morbidity.69
54Gwack et al., “Effects of Asian Dust Events on Diurnal Variation of Peak Expiratory Flow Rate in Children with Bronchial
Asthma and Healthy Children.”
55Yoo et al., “Acute Effects of Asian Dust Events on Respiratory Symptoms and Peak Expiratory Flow in Children with Mild
Asthma.”
56Hong et al., “Asian Dust Storm and Pulmonary Function of School Children in Seoul.”
57Global Asthma Network, “Global Asthma Report.”
58Kanatani et al., “Desert Dust Exposure Is Associated with Increased Risk of Asthma Hospitalization in Children.”
59Gyan et al., “African Dust Clouds Are Associated with Increased Paediatric Asthma Accident and Emergency Admissions
on the Caribbean Island of Trinidad.”
60Grineski et al., “Hospital Admissions for Asthma and Acute Bronchitis in El Paso, Texas.”
61Al Frayh et al., “Increased Prevalence of Asthma in Saudi Arabia.”
62Bener et al., “Genetic and Environmental Factors Associated with Asthma.”
63Samoli et al., “Acute Effects of Air Pollution on Pediatric Asthma Exacerbation: Evidence of Association and Effect
Modification.”
64Thalib and Al-Taiar, “Dust Storms and the Risk of Asthma Admissions to Hospitals in Kuwait.”
65Teather et al., Examining the Links between Air Quality, Climate Change and Respiratory Health in Qatar.
66Chan et al., “Increasing Cardiopulmonary Emergency Visits by Long-Range Transported Asian Dust Storms in Taiwan.”
67Meng and Lu, “Dust Events as a Risk Factor for Daily Hospitalization for Respiratory and Cardiovascular Diseases in
Minqin, China.”
68Middleton and Goudie, Desert Dust in the Global System.
69Delangizan and Jafari Motlagh, “Dust Phenomenon Affects on Cardiovascular and Respiratory Hospitalizations
and Mortality: A Case Study in Kermanshah, during March-September 2010–2011.”
Sources, Costs, and Solutions 13
10117_Dust.indd 13 11/18/19 11:01 AMOTHER INFECTIONS
Infectious diseases, such as meningitis, conjunctivitis, and eye and skin infec-
tions, are also known to be linked to increased dust concentrations. Meningo-
coccal meningitis, also known as cerebrospinal meningitis, caused by the bacterium Neisseria
meningitides, can cause large epidemics with fatality rates among cases.70 The largest epi-
demic occurs in the African “meningitis belt,” a semiarid region spanning the Sahel from
Senegal in the west to Ethiopia in the east, which has the highest rate of the disease.71 Dust
storms from the Sahara and meningitis outbreaks are highly correlated and are perhaps
linked through the Neisseria bacteria that need iron-laden dust to grow and become viral.72
Dust has also been linked to conjunctivitis, which is an inflammation of the conjunctiva
and other ocular surfaces because of the reaction to an allergen.73 Exposure to desert dust
could also lead to itchy eyes and skin rashes.74 Lastly, Asian dust is widely suspected to be an
important factor in the pathogenesis of atopic dermatitis, which could be due to the fungi,
mites, and other allergens contained in dust.75
ENVIRONMENTAL IMPACTS OF DUST
Besides many of the negative impacts, dust fertilizes oceans and forests. Dust
storms have some positive global impacts due to their transboundary nature and the impor-
tance of dust in global climate and terrestrial and biogeochemical cycling.76 For instance,
dust fertilizes and sustains both oceans and forests, playing a huge part in the earth’s biogeo-
chemical cycles.77 Saharan dust fertilizes the Amazon forest, by replacing the phosphorous it
loses from the basin. Similarly, Hawaiian rain forests receive nutrient inputs from dust from
central Asia, which may sustain forest productivity over long time periods.78
While dust boosts primary productivity of oceans, it could have damaging
effects on coral reefs. Dust provides nutrients to the surface and seabed of oceans, boost-
ing primary productivity such as phytoplankton growth.79 Changes in dust fluxes to the
ocean have the potential to modify ocean biogeochemistry.80 Research has suggested that
dust deposition trends have increased ocean productivity by an estimated 6 percent in the
past century.81 However, there is also a possibility that microorganisms, nutrients, trace met-
als, and organic contaminants deposited in the dust on land and in oceans may play a role
in the complex changes occurring on coral reefs worldwide.82 For instance, dust originating
from Africa and Asia could therefore be adversely affecting coral reefs and other downwind
ecosystems in the Americas.
Dust has been also associated with leading to and exacerbating climatic events
such as storms, droughts, and the melting of glaciers. Dust can affect climate by
70UNEP, WMO, UNCCD, “Global Assessment of Sand and Dust Storms.”
71World Health Organization, “Meningococcal Meningitis.”
72Noinaj, Buchanan, and Cornelissen, “The Transferrin–Iron Import System from Pathogenic N Eisseria Species.”
73Zhang et al., “A Systematic Review of Global Desert Dust and Associated Human Health Effects.”
74UNEP, WMO, UNCCD, “Global Assessment of Sand and Dust Storms.”
75Lee and Lee, “Effects of Asian Dust Events on Daily Asthma Patients in Seoul, Korea.”
76Ravi et al., “Aeolian Processes and the Biosphere.”
77Goudie, “Dust Storms.”
78Chadwick et al., “Changing Sources of Nutrients during Four Million Years of Ecosystem Development.”
79Jickells et al., “Air-Borne Dust Fluxes to a Deep Water Sediment Trap in the Sargasso Sea.”
80Aumont, Bopp, and Schulz, “What Does Temporal Variability in Aeolian Dust Deposition Contribute to Sea-Surface Iron
and Chlorophyll Distributions?”
81Mahowald et al., “Observed 20th Century Desert Dust Variability.”
82Garrison et al., “African and Asian Dust.”
14 Sand and Dust Storms in the Middle East and North Africa (MENA) Region
10117_Dust.indd 14 11/18/19 11:01 AMits effect on biogeochemical cycles, especially through effects on the ocean temperature and
primary productivity and through indirect mechanisms from the dusts’ chemical reactivi-
ty.83 Therefore, extreme events such as floods and droughts can be influenced by dust. For
instance, dust has been linked to modifying tropical storms and cyclone intensities.84 Dust
can also cause drought intensification, as dust loadings effect absorption and scattering of
solar radiation and can alter the Earth’s radiative balance.85 Dust can affect precipitation
indirectly too, through effects on convective activity due to altered temperature gradients.
Glacial melt has also been linked to dust, as the deposition of mineral dust on glaciers has
the potential to lower their surface albedo and speed up their melting.86
Dust deposition and storms are both a cause and symptom of land degra-
dation. Wind erosion is one of the main land degradation processes, especially in dry-
land regions.87 Wind erosion removes finer soil particles, which constitute the most active
soil component in retaining nutrients and organic matter, resulting in soil degradation. The
eroded material may damage crops and vegetation due to abrasion and sand burying young
plants.88 Dust deposition has played a role in soil formation in many parts of the world, often
at large distances from desert margins. The most striking example is the influence of aeolian
processes on the formation of loess soils (unconsolidated silt), which occur extensively in
North and South America, Central Asia, and China.89 Aeolian processes have also contrib-
uted to forms of land degradation, such as soil salinization and alkalinity, through accumu-
lation of soluble salt, and reduction of soil acidity through addition of carbonates.90 Thus
dust entrainment (particle lifting by wind erosion) during dust events leads to long-term soil
degradation, which is essentially irreversible.
ECONOMIC COSTS OF DUST
There are countless short-term and long-term impacts of dust pollution.
Impacts range from negative health impacts to reducing crop yields to lowering property
values to steering talented workers away from polluted places. As discussed in the previous sec-
tion, sand dust affects crops and soil negatively. Sandblasting and burial of seedlings have an
immediate negative effect on yields, and the loss of nutrient rich topsoil affects productivity in
the long term.91 During dust storms, labor productivity and household incomes drop sharply,
and millions of people are unable to reach work, and factories and offices close. Additionally,
continued incidence of dust storms can also result in migration. Because of the Dust Bowl in
the 1930s, millions of hectares of farmland became useless, and hundreds of thousands of
people were forced to leave their homes.92 Other short-term impacts include livestock mortal-
ity, infrastructure and transportation damage, and cost of clearing up sand (Table 2, Box 2).
Global welfare losses from premature mortality are huge and increased from
2.2 trillion in 1990 to 3.6 trillion in 2013. Quantifying and monetizing dust impacts
is difficult, as costs are wide-ranging and methods to calculate them are complex. Very few
83Singh et al., “Enhancement of Oceanic Parameters Associated with Dust Storms Using Satellite Data.”
84Evan et al., New Evidence for a Relationship between Atlantic Tropical Cyclone Activity and African Dust Outbreaks.
85Highwood and Ryder, “Radiative Effects of Dust.”
86Oerlemans, Giesen, and van den Broeke, “Retreating alpine glaciers: increased melt rates due to accumulation of dust
(Vadret da Morteratsch, Switzerland).”
87Middleton and Goudie, Desert Dust in the Global System.
88Ravi et al., “Aeolian Processes and the Biosphere.”
89Muhs et al., “Identifying Sources of Aeolian Mineral Dust: Present and Past.”
90Middleton and Goudie, Desert Dust in the Global System.
91Behzad, Mineta, and Gojobori, “Global Ramifications of Dust and Sandstorm Microbiota.”
92Lee, Gill, and Mulligan, “The 1930s Dust Bowl.”
Sources, Costs, and Solutions 15
10117_Dust.indd 15 11/18/19 11:01 AMYou can also read