SANS Institute Information Security Reading Room - SANS.org
←
→
Page content transcription
If your browser does not render page correctly, please read the page content below
SANS Institute
Information Security Reading Room

Bridging the Gantt
______________________________
Erik Couture

Copyright SANS Institute 2020. Author Retains Full Rights.

This paper is from the SANS Institute Reading Room site. Reposting is not permitted without express
written permission.
Bridging the Gantt

                               Integrating Project Management
                                    and Task Management

                                GIAC (GCPM) Gold Certification

                         Author: Erik Couture, erikcouture@gmail.com
                                     Advisor: Rich Graves

                                Accepted: December 22nd, 2013

                                             Abstract

The Gantt chart is a time-tested tool that enables Project Managers to visualize work elements,
resources and dependencies. Personal task management techniques focus on enabling individuals
to understand what action they need to do next to accomplish larger goals. The gap between these
processes is well recognized and this paper proposes methods for bringing the two closer
together; helping Project Managers translate their macro-level plans into action.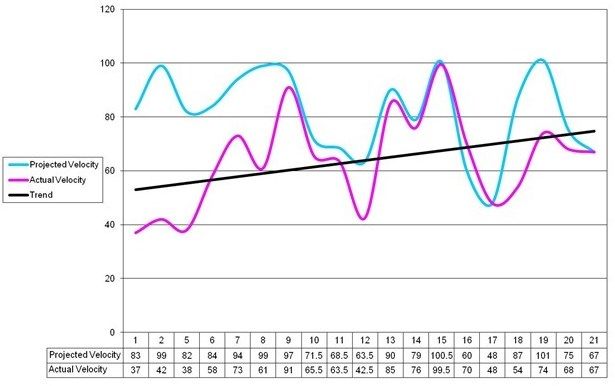
Bridging the Gantt - 2

1. Introduction
To Project Management (PM) novices, the Gantt chart is often seen as the central tool of the
project management process. The chart's creation and maintenance often becomes the focal point
of effort for the project staff. "Feeding the beast" with near-constant updates has potential to
overrun resources, in particular as a Gantt chart grows to include ever-deeper levels of detail. The
responsibility for its maintenance may be devolved to middle management or to the employees
who should be focused on doing project work. The return on investment of this time
management tool quickly drops off as it becomes increasingly burdensome.
This scenario poses a particular risk in small and medium-sized organizations that do not have
dedicated PM staffs. Managers, responsible for their assigned operations and personnel, and also
burdened with delivering projects may not realize the full benefits of time management tools as
they bridge the responsibilities of a Project Manager and functional manager. Ultimately, they
need to strike a balance between time spent managing and time spent doing.

1.1. Scope and Limitations
This paper will examine the current doctrine of Project Time Management and assess the
effectiveness of its most popular tool, the Gantt chart. It will also outline Task Management
techniques and goals, and propose efficiencies to be gained in drawing clearer linkages between
these two processes.
It will explore this nexus, proposing a simplified workflow with available tools. It will to seek to
enable a mutually beneficial existence of these processes, in a manner that promotes Projects
Managers' goals and the operational effectiveness of 'tactical-level' employees with as little

unnecessary overhead as possible. It’s important to consider this question in some context; the

key to Project success does not reside exclusively in with time management visualization and

associated processes. The project manager’s fundamental skill is effective communications with

his team and project stakeholders. This paper will show how better time management processes
and technology can aid a project manager in ensuring an effective and open communication, up
and down the chain.

Erik Couture, erikcouture@gmail.com
Bridging the Gantt - 3 2. Project Time Management Time management is a critical PM process, vital to delivering projects “On time, on budget”. More often then not however, projects deliver late. According to McKinsey & Company research, the average tech project is 7% late (Bloch et al, 2012). Time overruns alone are identified as the primary cause of 11% of overall project failures. In recent years, the popularization of myriad PM software tools such as Microsoft Project and Primavera has likely contributed to the misconceptions that good time management equals a robust Gantt chart. When personnel untrained in PM are asked what comes to mind at the term "Project Management" the image is often that of a Gantt chart. 2.1. The Gantt Chart in Project Management Henry Gantt developed the Gantt chart over a hundred years ago and popularized it for project management shortly thereafter (Gcek, 2008). At the time, the concept was considered revolutionary in the field of management. It was conceived to illustrate a project schedule, highlighting a number of variables including: (Wikipedia, 2013) Name of each activity Start and Finish dates Dependencies/precedence Percentage complete Erik Couture, erikcouture@gmail.com
Bridging the Gantt - 4
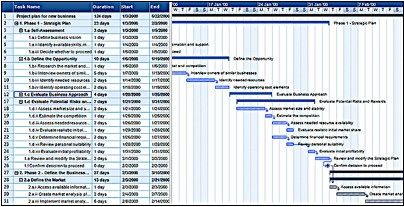
Figure 1 - Gantt chart (Matchware, 2013)
With the advent of accessible computing and simplified software in the 1980s, the use of Gantt
charts exploded and it has provided real benefit to managers' abilities to outline, organize, plan
and execute projects. The visualization of project schedules allows managers to easily analyze
dependencies and resource bottlenecks in their projects.
3. A Critical look at the Gantt chart
At its most fundamental level, the Gantt chart shows the relationship between work elements
over a time span. They are used most extensively for production planning, scheduling and control
(Ghosh, 2013).
3.1. Benefits
Like any tool, the Gantt chart is used and misused in any number of ways. The goals of its user
will define its effectiveness for a given task. It does, however offer a number of positive
advantages to a manager faced with complex projects: (Answers, 2013).
Clarity - The Gantt can help visualize complexities of a plan. Humans are great at analyzing
visual data, and a Gantt can help highlight areas of slack space in the schedule, critical
dependencies and unexploited opportunities for concurrent activity.
Erik Couture, erikcouture@gmail.comBridging the Gantt - 5
Communication - A clear chart that represents multiple tasks, stakeholders and dependencies
can be an effective communications tool to provide situational awareness both to senior
management and to project stakeholders. Teams can gain a quick appreciation of their own
progress with respect to other teams, with whom they might not interact with on a regular
basis.
Coordination - Gantt charts provide a glimpse of time and resource scheduling at the macro
level, allowing project managers and team leaders to collaborate on sequencing and conflict
resolution.
Flexibility - This attribute may be a double-edged sword (as we'll see later). The flexibility
offered by software-generated Gantt charts can enable rapid high-level impact assessments
(i.e. what happens to my critical path if this work element slips by 2 weeks).
Accountability - By placing tasks in a simple to understand format and clearly linking
interdependencies, team leaders can be made accountable for impacts their team’s
performance has on others.
3.2. Drawbacks
Before critiquing the Gantt chart, it is worth noting again that it was designed for a particular
purpose. Much criticism stems from the evolution of its use, or shortfalls in domains for which it
was never intended. Gantt charts illustrate a key truism of any visualization: “Every notation
highlights some kinds of information at the expense of obscuring other kinds” (Green & Petre,
1984). In effect, highlighting some aspects of a dataset will necessarily obscure others. That said,
there are a significant number of drawbacks to the Gantt:
3.2.1. Visual/Analytical Ineffectiveness
Most Gantt charts are “analytically thin, too simple, and lack substantive detail” (Tufte, 2013).
project managers must apply substantial analysis to get value; the axiomatic “garbage
in/garbage out” applies.
Erik Couture, erikcouture@gmail.comBridging the Gantt - 6
Gantt charts don’t scale well in the vertical axis. As a project manager, you may manipulate
the chart by collapsing sub-tasks into larger components but as a viewer, when a chart begins
to exceed the page/screen it's viewed/printed on it becomes difficult to grasp and loses the
very context it is designed to give (Bowen, 2013).
3.2.2. Inflexibility
Gantt charts can be inflexible when used for planning. They force managers to complete all
time/resource estimates for project activities up front. Significant effort needs to first be
applied to developing a detailed WBS before those tasks are laid out in a Gantt, lest a major
item be missed, leading to significant changes to the schedule later once resources have
already been committed. WBS decomposition and the subsequent Gantt need to follow the
100% rule, which states that the sum of the work at the “child” level must equal 100% of the
work represented by the “parent”. (Bowen, 2013). This can be challenging as the project
manager and stakeholders may not always know what is required of a task (particularly in
‘knowledge work’ fields)
Gantt charts don’t really deal with sub-WBS activity tasks, and if leveraged into this space,
quickly balloon in size and management overhead (Thaxter, 2013).
Detail tends to trail off when planning far out: often not enough is known about the WBS
elements and their required effort. This lessening of detail over the timeline may lead to false
analysis of total project delivery times and poor scheduling decisions.
Gantt charts are rigid and demand inflexible start and finish dates. It is well understood that
change will occur, and that managers need to respond quickly and appropriately. Tools which
add significant overhead to this decision making process often give way to more flexible ones
like spreadsheets and to-do lists, which can be customized in a moment to suit the need
(Gupta, 2013).
Erik Couture, erikcouture@gmail.comBridging the Gantt - 7
3.2.3. Resource intensiveness
Constant ‘care-and feeding’ is required by the project manager to keep the chart up to date.
The effort is proportional to number of tasks and amount of detail included; the more detailed
the plan, the more work will be required to keep it up to date (Ghosh, 2013).
3.2.4. Contextual Concerns
While traditional time management practices are flexible enough to be applied to a wide breadth
of projects, they are rooted in an industrial age mentality (Booker, 2007). There is significant
emphasis on in-depth upfront planning rather than incremental, iterative or collaborative
planning. Knowledge-based projects, in particular, require a degree of flexibility in their time
management, which may not be necessary in more traditional ‘widget-making’ projects. The type
of problem-solving involved in knowledge work can prove very difficult to characterize in an
upfront planning process; how can a PM (or even a contributing stakeholder) know with any
certainty how long it will take to write a policy, review a document or write a new piece of code
(Brooks, 1995).
3.3. Points to consider
In the context of this paper, the issue of greatest concern with the Gantt chart is the work element
to actionable task or “macro-to-micro” interface. A greater number of tracked tasks/activities
reduces the project manager’s bias but increases the resulting effect of fluctuation of any of those
variables and adds undesirable overhead, which is prone to drive aversion to maintain and
faithfully employ the system.
Though not conceived as a day-to-day task management tool, MS Project is sometime employed
to try to plan at that level of execution detail. The planning churn created by this is massive, even
if distributed via a collaborative planning model where successive levels of management insert
and update the tactical level detail.
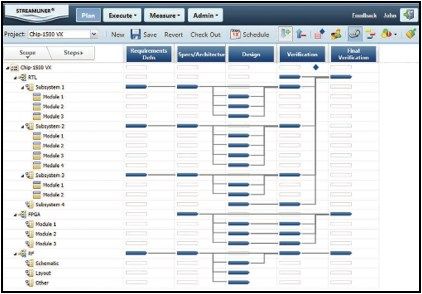
One alternative to this approach is attempting new visualizations from first principles. Fig 2
depicts an alternate workflow-based planning tool, which tracks projects with a ‘swim-lane’-like
visualization and work elements only planned out at the macro level.
Erik Couture, erikcouture@gmail.comBridging the Gantt - 8
Figure 2 - Realization Technologies’ Streamliner workflow-based planning tool
This view has the advantage of showing the components of a project and their interrelationships
while avoiding the traditional time-on-X-axis Gantt approach. Though serving a role at the high
level, these visualizations also prove ultimately un-scalable to the working level.
It can be said that the process of creating the WBS and subsequently the Gantt chart are in
themselves the most valuable part of the process. The act forces the project manager and
stakeholder to think through the problem and determine high-level dependencies, milestones, and
conflicts while they are still addressable.
"If you spend more than 1% of your time on Gantt charts, you’re not a project
manager." (Hyde, 2011)
A PM’s raison-d’être is to ensure project success. This is often primarily a communication and
leadership function. Indeed, effort expended tweaking Gantt charts may take away from time
communicating and resolving issues. By focusing on goal achievement rather then individual
Erik Couture, erikcouture@gmail.comBridging the Gantt - 9
work elements and tasks, the plan can remain relevant, while the task-level detail gets handled at
a lower level of planning. (Tufte, 2013).
4. Personal Time/Task Management
4.1. Overview
Though there exist a number of personal time/task management philosophies and systems (e.g.
Pomodoro, Simpleology), for the sake of this paper one of the more popularly used ones in the
technology industry will be highlighted: David Allen’s “Getting Things Done” (GTD). GTD was
developed as a system to assist an individual to collect, organize and do all the myriad tasks we
are faced with. Though expressly not technology focused, the availability of smartphones and
simple to use apps has enabled the GTD methodology to be successfully integrated into the
personal and professional lives of millions of people. GTD outlines a five-step process: (Allen,
2002)
Collecting - gathering tasks, inputs, resources,
Processing - analyzing the inputs, deciding which ‘bin’ to classify them in (task, project, long-
range plans),
Organizing - placing the processed tasks into a trusted system,
Doing - accomplishing the work that you can accomplish at a given moment, and
Reviewing - assessing the results of your effort, revising and improving.
Users of the system are strongly encouraged to get everything ‘out of their head’ and into the
system. This is a powerful concept as a personal time management tool but potentially a
goldmine if properly aggregated and correlated across a Project team.
GTD’s lexicon differentiates projects (with a small ‘p’) from tasks. A project is any goal that
requires more than one step to accomplish. It introduces the concept of ‘actions’ as the most
discretely reducible step (akin to a low-level WBS decomposition).
Erik Couture, erikcouture@gmail.comBridging the Gantt - 10 The employee’s focus is a valuable commodity; the system should be developed to bring the appropriate action to the employee’s attention at the right time and place to allow him to do the work. Time spent wondering what to do next is time wasted. Likewise, energy spent trying to remember tasks that should otherwise be tracked in a trusted system (written down, computerized to-do list, etc.) is wasted. By capturing all these in a trusted system, the user frees his mental resources and thereby his attention to focus on the here and now. Focusing on the next physical action to move a project ahead is the most effective way to get work done. Whether this step is to make a phone call, research some information or write an email, complex projects are just streams of actions completed in sequence, as efficiently as possible. Erik Couture, erikcouture@gmail.com
Bridging the Gantt - 11

                               Figure 3 - GTD Workflow. (Allen, 2002)

The concept of ‘contexts’ is vital to the GTD methodology. Contexts are metadata added to each

‘Next Action’, which indicate the location or resources required to accomplish the work. Contexts

could include @Computer or @Finance_Team (indicating a particular resource required to
accomplish a task), or @Home or @Datacenter (indicating a location at which the work needs to
occur). This is a powerful trigger for an automated system to bring forward the correct items to

Erik Couture, erikcouture@gmail.com
Bridging the Gantt - 12 the user’s attention. Contexts ensure tasks are only presented at a time and place where they can be completed; this feature allows the user to trust that the system will present the correct work at the correct time and alleviate the time-sucking curiosity of constantly checking and assessing email and to-do lists. Scheduling weekly (or more frequent) review time ties the whole process together by forcing a review of outstanding work. This allows the user to process and organize any unhandled tasks, review current tasks and reprocess as needed and perform a mid/long range goal-check to ensure you’re on track to attain any set goals. 4.2. Linkages to Project Time Management Often individuals who have formal Project Management training struggle with understanding its relationship with personal task management (Sáez, 2012). They are used to full task decomposition, assigning each task deadlines and resources and often presenting these visually in a Gantt chart as the central communication tool for their plan. This philosophy gets confused when these same individuals attempt task management such as GTD. They may try to formulate a GTD environment with PM tools, or vice versa. Either approach is unlikely to meet much success. While personal time management techniques exist to allow the individual to approach all the tasks in their lives more effectively, further discussion will highlight the work-related aspects and how personal time management can be leveraged for the benefit of the individual’s performance of work Project-related tasks. Though personal and project time management were conceived with different goals, they could be seen as differing primarily in scale. Both approaches start with the end in mind, analyze the problem, formulate a plan, assign resources and track work done. GTD places significant emphasis on defining “what done looks like”. This concept will instantly sound familiar to a PM as an equivalent to a milestone or the completion of a Work Element. Workers (and managers) need very precise and clear goals; each step in the completion of a task must have a definite point where it is considered complete. Erik Couture, erikcouture@gmail.com
Bridging the Gantt - 13
5. Bridged Time Management (BTM)
Time management involves both planning and execution. Gantt charting has proven strengths as
a planning tool but many shortcomings when used for in-depth execution tracking and
management. Personal time management systems (henceforth referred to generally as ‘GTD’) are
an excellent personal tool, but do not in most implementations integrate smoothly with PM,
creating an additional burden on the manager and employee to ‘translate’ PM work elements and
milestones/timelines to actionable GTD ‘Next Actions’. ‘Bridged Time Management’, is proposed
as a methodology for integrating PM and GTD in a transparent and effective manner which
should mutually support the goals of each.
5.1. BTM Requirements
The development of any new process presupposes some level of requirements analysis. The
following general parameters shape the development of BTM:
BTM should support and integrate with both PM and GTD processes,
BTM should not impose significant additional overhead to PM and GTD processes,
BTM should not broadly address all the shortfalls of the Gantt chart, but focus on integrating
it with any required modifications with GTD,
BTM should automate as much of the inter-process communication as possible,
BTM should extend the traditional Gantt visualization, not replace it; and
BTM should provide reviewable, measurable views and outputs to support both the project
manager and individuals’ needs.
5.2. BTM Principles
BTM must be built on the basic premise that planned outcomes and planned actions should not be
conflated. The former provides vision, guidance and progress tracking. The latter are the
actionable items that move the project forward. “Outcomes are the rudder and actions are the
Erik Couture, erikcouture@gmail.comBridging the Gantt - 14
oars.” (Tufte, 2013). A common failure is to combine these two distinct categories and thereby
lose the respective value they each necessarily bring to time management.
To be clear, WBS’ and their visual extrapolations, Gantt charts, are deliverable/outcome focused
(PMI, 2006). Conversely, task management is action focused. In other words, WBS are the ends,
tasks are the means to those ends.
As an example:
o WBS 3.2.1 - End-user license agreement
Task 1 - Create EULA stakeholder meeting agenda
Task 2 - Schedule EULA stakeholder meeting
Task 3 - Conduct EULA stakeholder meeting
Task 4 - Draft EULA
Task n - …
o WBS 3.2.n - …
When developing a novel tool or process, the question of its audience must be considered. Who
will be using the system? Who will be primarily inputting data into it, and who will be primarily
referring to it for its outputs? Will outputs of the system be used for reporting to senior
management, and if so what are their needs? This paper will propose a system that is focused on a
PM-led system that is guided by middle management and largely interacted with by the end-user.
The system is conceptually flexible enough to allow varying views on the data, depending on the
requirement.
5.2.1. Contexts
GTD’s concept of contexts is hugely powerful. BTM needs to be fully enabled to receive, analyze
and apply contexts to each individual’s tasks. A few simple examples will demonstrate the
principle.
Both Alice and Bob are working on different tasks related to the same Project. Bob has
associated @Alice as a context on a Next Action, as he needs to show her a document. A bi-
weekly meeting, unassociated to the Project, brings Bob to Alice’s building on Monday
Erik Couture, erikcouture@gmail.comBridging the Gantt - 15
afternoon. He should be alerted automatically on Friday to drop in and see Alice. This could
be weeks before a ‘scheduled start-date’ on any time oriented Gantt chart would have
otherwise triggered him, and he might have had to reactively do the task, rather then handling
it more effectively at the right moment and context, keeping the Project moving.
Bob is planning holidays in a week. His calendaring system automatically updates the BTM
system that triggers an action on any Context to which he is associated (@Bob,
@Design_Group, @Work, etc.). Certain colleagues who need absolutely inputs from Bob
have their next actions re-prioritized automatically. Bob himself should receive a list of what
next actions others need him for, what actions he himself needs to conclude before departing,
and what actions he can take home, if necessary (!@Work, @Computer, @Phone, etc.).
5.2.2. Objects
Einstein is paraphrased as having said, “Everything should be made as simple as possible, but no
simpler”. Similarly, “Tasks should be decomposed to the lowest possible level, and no lower.” If
every simple task is decomposed to the minutest detail, the system will become overly taxing on
the user. BTM Action Packs (BAP) are proposed as pre-defined, but easily editable packages of
known work. The concept of reusable ‘code’ should be familiar to anyone with an object-oriented
programming background. Every organization has hundreds of processes and standard operating
procedures. If each individual needed to effectively re-generate these within GTD each time a
familiar task came up, the overhead would be substantial. Action Packs are a mechanism for
codifying series’ of Next Actions. These could be the 10 steps of an organizational change
management workflow, or the process for testing a new Firewall. Each action pack would be built
collaboratively in a wiki-like manner to allow the last person who uses it to save any changes that
have occurred as part of the new process. System learning algorithms could be used in software
to analyze ongoing non-BAP activities and automatically suggest new BAPs for observed
repetitive work. For example, if a person or group is noted as outlining the same process multiple
times, the system could prompt them in a manner akin to email address ‘auto-fill’ in common
email software. A simple keyboard shortcut or macro could be employed to initiate a BAP, or one
Erik Couture, erikcouture@gmail.comBridging the Gantt - 16 could be initiated automatically on behalf of another user’s task. If Bob creates a task “Get document approved by the CISO”, the system could create a project in the CISO’s GTD with the BAP preset for the n-steps of the document approval process. It is possible that employees who work in very structured roles might be able to work entirely within BAP, though those employees’ high level of repetition may obviate the need for them to participate in the BTM in the first place. As an example, a person employed in shipping and receiving who packs and sends boxes all day won’t likely receive much value from BAP since he likely has a fairly small number of possible actions which are already organized in a reasonably efficient manner. 5.2.3. Velocity The concept of velocity is borrowed from the Agile software development methodology. Velocity is a metric that tracks the speed at which work is being done, based on other similar work done recently. While the utility of this metric may differ on the implementation (not all actions are expected to take the same amount of time), combined with BAPs, a velocity assessment can quickly highlight changes in performance of specific routines. The manager could then review these in the form of alerts and decide whether intervention is necessary. As an example, if the project requires the installation of 10 servers, the scheduling for the 7th would be automatically influenced by the time it actually took to install the first 6, perhaps with a weighted average favoring the most recent 3 servers to better reflect current conditions. Erik Couture, erikcouture@gmail.com
Bridging the Gantt - 17

                          Figure 4 - Example Agile velocity chart (Cheng, 2009)
In a semi-automated BTM system, the velocity metric at the individual and organizational levels

would be used to help ‘pace’ activities and dynamically adjust timelines, deadlines and

dependencies.

5.2.4. Visualization and Reporting

The question of how to visualize BTM is really one of audience; a visualization needs to bring
forth the information required by the viewer to enable his decision making process, while hiding
superfluous detail. Gantt charts may still prove useful for senior management and the project
manager and as the updating of tasks and progress will be largely automated, this time-centric
view can continue to provide big-picture views on overall risks to the critical path or high level
dependencies which require senior-level coordination. These Gantt charts would however benefit
from the increased dynamic nature and accuracy brought to them via the BTM techniques
described.
The second portion of BTM visualization is automatically generated, customizable multi-variable

graphing based on combined inputs from each employee’s GTD system. Schedule Performance,

for example, can be assessed in real time by management to see if employees are on track to
achieve the required deadlines. This view, combined with aggregate velocity charts could provide

Erik Couture, erikcouture@gmail.com
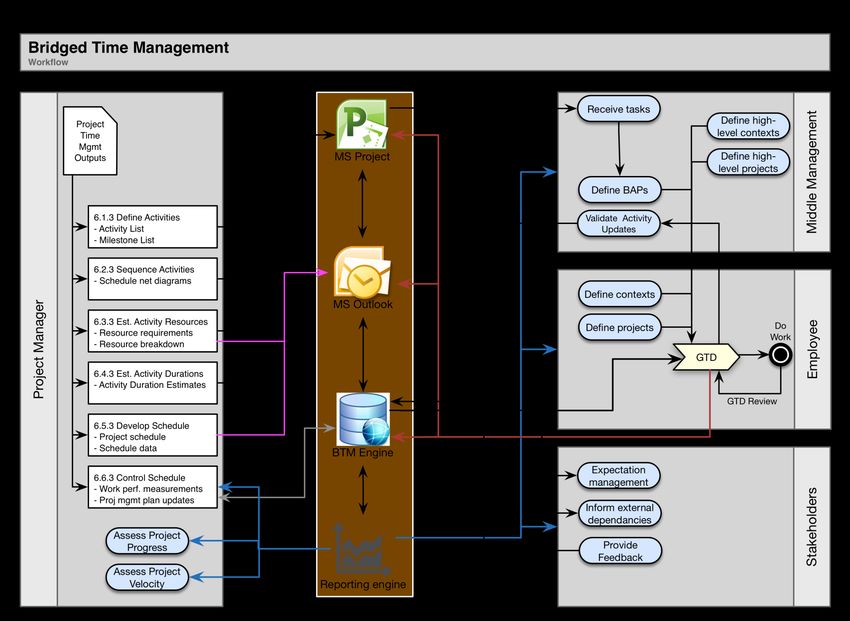
Bridging the Gantt - 18 crucial decision-making insight for senior management to influence the project. Management could easily get a report of ‘stuck tasks’; actions which have not been accomplished in the expected amount of time. Context sensitive visualization could reveal a number of useful planning points: the fact that @Bob is on 15 people’s Next Actions list, could imply he is overtasked (or under performing). The opportunities for useful visualization and reporting are limitless when accurate, up to date data and trending is fed into a well conceived visualization and reporting dashboard. 5.2.5. Tying it together BTM software algorithms could be devised which would fluidly adjust the triggering of a next action, based on feedback from the current velocity of key BAPs. For example, if the last three policies written by the Policy department have taken 3 days more then the norm, the system would trigger Bob to engage them 3 days sooner then it would have otherwise. Email is often the hub of activity for knowledge workers. Systems have already been developed for close integration of Microsoft Outlook and Google’s Gmail (among others) with GTD. Outlook, in particular, is quite expandable and a plugin supporting Visual Basic routines could be developed to integrate Outlook as a BTM/GTD tool with MS Project as a PM tool. Automated bi- directional data passage is critical to reducing the need to update the Project plan/Gantt chart manually; changes to BTM could trigger real-time changes in the plan (though the project manager may want to review and accept these so he’s aware of the impact on his plan). Erik Couture, erikcouture@gmail.com
5.3. Proposed BTM Workflow
Bridging the Gantt - 20

6. Conclusion
Overreliance on the Gantt chart as a planning and execution tool has been shown to be a
significant risk, particularly for small/medium-sized projects without dedicated project staff. This
paper has demonstrated some of the specific shortcomings of that approach and proposed a future
stream of Time Management aimed at integrating macro-level Project management with micro-
level task management. This proposed approach, Bridged Time Management; leverages current
best practices from several proven time management processes and integrates them to superior
effect for the small/medium-sized organization. The automation and feedback algorithms at the
heart of BTM could help significantly increase productivity and while providing far more
accurate and timely performance reporting to the project manager and all other users and
stakeholders.

Erik Couture, erikcouture@gmail.com
Bridging the Gantt - 21

7. References
Advantages of Gantt charts. (n.d). In Answers. The Q & A Community. Retrieved November 19,
     2013 from http://wiki.answers.com/Q/Advantages_of_gantt_chart_and_how_it
     _different_form_other_chart
Allen, D. (2002). Getting things done: the art of stress-free productivity. New York, NY:
     Cleveland: Simon & Schuster Audio.
Bloch, M., Blumberg, S., Laartz, J. (2012). Delivering large-scale IT projects on time, on budget,
     and on value. Retrieved from
     http://www.mckinsey.com/insights/business_technology/delivering_large-
     scale_it_projects_on_time_ on_budget_and_ on_value
Booker, G. (2007). Earned Value and the Drucker Challenge. Retrieved from
     http://www.projectsatwork.com/content/Articles/234573.cfm
Bowen, R. (2013).When Gantt Charts Aren't the Answer. Retrieved from
     http://www.brighthubpm.com/project-planning/52723-disadvantages-of-gantt-charts/
Brooks, F. P., Jr. (1995). The mythical man-month: Essays on software engineering (Anniversary
     ed.). Reading, Mass.: Addison-Wesley Pub. Co.
Cheng, R. (2009). One More Agile Blog. Retrieved from:
     http://www.onemoreagileblog.com/2009/07/common-agile-metrics.html
Gantt chart. (n.d.). Wikipedia. Retrieved November 19, 2013 from
     http://en.wikipedia.org/wiki/Gantt_chart
Gcek, Sreejith. (2008). Life beyond Gantt charts. Retrieved from
     http://pmkarma.blogspot.ca/2008/10/life-beyond-gantt-charts.html
Ghosh, Pragati. (2013). What are the Advantages and Disadvantages of Gantt Charts? Retrieved
     from http://www.shareyouressays.com/116916/what-are-the-advantages-and-disadvantages-
     of-gantt-charts
Gordon-Thaxter, Nicola. (2013). Advantages & Disadvantages of a Gantt Chart. Retrieved from
     http://www.ehow.com/info_8045114_advantages-disadvantages-gantt-chart.html
Gupta, S. (2013). Turning Planning Art into Science. Industrial Management magazine.
     September 2013.

Erik Couture, erikcouture@gmail.com
Bridging the Gantt - 22
Hyde, J. (2011). Gantt charts are a waste of time. Retrieved from
http://www.publicsectorpm.com/2011/08/gantt-charts-are-a-waste-of-time/.
Leek, J. (n.d). Project Management Graphics (or Gantt Charts) [Online forum comment].
Retrieved from http://www.edwardtufte.com/bboard/q-and-a-fetch-msg?msg_id=000076
Matchware. (2013). Gantt chart Template: Business Plan. Retrieved from:
http://www.matchware.com/en/templates/gantt-chart-template-business-plan.php
Microsoft Corporation. (2013). WBS Based on Microsoft Project template for IT infrastructure
Deployment Plan. Recovered from: http://office.microsoft.com/en-us/templates/it-
infrastructure-deployment-plan-TC001018447.aspx
Project Management Institute (PMI). (2006). A guide to the project management body of
knowledge (PMBOK guide). Newtown Square, Pa: Project Management Institute.
Sáez, F. (2012). GTD is not Project Management. Retrieved from
http://facilethings.com/blog/en/gtd-is-not-project-management.
Green, T.R.G., Petre, M. (1996). Usability Analysis of Visual Programming Environments: A
‘Cognitive Dimensions’ Framework, Journal of Visual Languages & Computing, Volume 7,
Issue 2, June 1996, Pages 131-174, http://dx.doi.org/10.1006/jvlc.1996.0009.
Tufte, E. (n.d). Project Management Graphics (or Gantt Charts) [Online forum comment].
Retrieved from http://www.edwardtufte.com/bboard/q-and-a-fetch-msg?msg_id=000076
Erik Couture, erikcouture@gmail.comLast Updated: June 15th, 2020
Upcoming SANS Training
Click here to view a list of all SANS Courses
SANS Amsterdam August 2020 Part 1 Amsterdam, NL Aug 03, 2020 - Aug 08, 2020 Live Event
SANS FOR508 Canberra August 2020 Canberra, AU Aug 17, 2020 - Aug 22, 2020 Live Event
SANS Amsterdam August 2020 Part 2 Amsterdam, NL Aug 17, 2020 - Aug 22, 2020 Live Event
SANS Virginia Beach 2020 Virginia Beach, VAUS Aug 31, 2020 - Sep 05, 2020 Live Event
SANS Philippines 2020 Manila, PH Sep 07, 2020 - Sep 19, 2020 Live Event
SANS London September 2020 London, GB Sep 07, 2020 - Sep 12, 2020 Live Event
SANS Baltimore Fall 2020 Baltimore, MDUS Sep 08, 2020 - Sep 13, 2020 Live Event
Threat Hunting & Incident Response Summit & Training 2020 New Orleans, LAUS Sep 10, 2020 - Sep 17, 2020 Live Event
SANS Munich September 2020 Munich, DE Sep 14, 2020 - Sep 19, 2020 Live Event
SANS OnDemand OnlineUS Anytime Self Paced
SANS SelfStudy Books & MP3s OnlyUS Anytime Self PacedYou can also read


