Sarine Technologies Ltd - Corporate Presentation November 2015 - SGX.com
←
→
Page content transcription
If your browser does not render page correctly, please read the page content below
Sarine Technologies Ltd.
Corporate Presentation
November 2015

                           1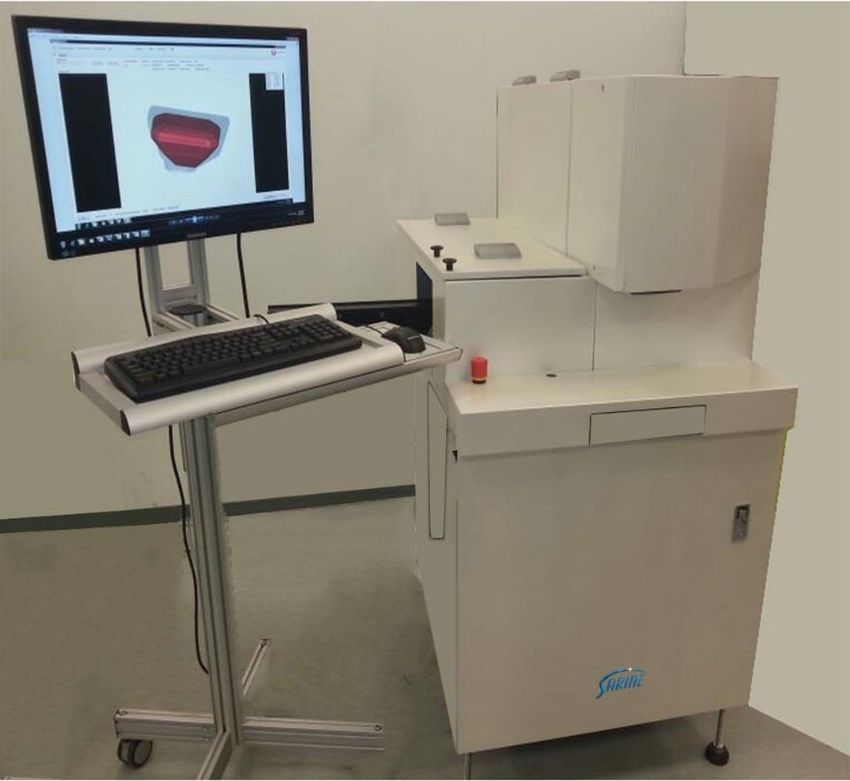
Disclaimer
This presentation may contain statements regarding the business of Sarine Technologies Ltd and its subsidiaries
(the “Group”) that are of a forward looking nature and are therefore based on management’s assumptions about
future developments. Such forward looking statements are typically identified by words such as ‘believe’, ‘estimate’,
‘intend’, ‘may’, ‘expect’, and ‘project’ and similar expressions as they relate to the Group. Forward looking
statements involve certain risks and uncertainties as they relate to future events. Actual results may vary materially
from those targeted, expected or projected due to numerous factors.

Potential risks and uncertainties include such factors as general economic conditions, foreign exchange
fluctuations, interest rate changes and regulatory developments. Such factors that may affect the Group’s future
financial results are detailed in our listing prospectus / circulars, listed in this presentation, or in the management
discussion and analysis section of the company’s result report and filing with the SGX. The reader is cautioned to
not unduly rely on these forward-looking statements. We do not undertake any duty to publish any update or
revision of any forward looking statements. We will announce all material information about the Group on the
SGXNET in accordance with the rules of the SGX-ST Listing Manual.

The information contained in this presentation has not been independently verified. No representation or warranty
expressed or implied is made as to, and no reliance should be placed on, the fairness, accuracy, completeness or
correctness of the information or opinions contained in this presentation. Neither Sarine Technologies nor any of
its affiliates, advisers or representatives shall have any liability whatsoever for any loss arising, whether directly or
indirectly, from any use or distribution of this presentation or its contents.

This presentation is for information only and does not constitute an invitation or offer to acquire, purchase or
subscribe for shares in Sarine Technologies.

                                                                                                                       2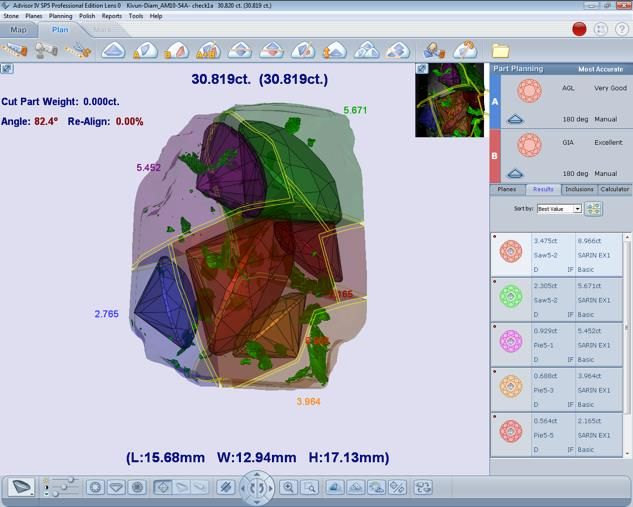
Agenda
Company Overview
Products Update
Results Update
Appendix - Industry Overview and Sarine’s Competitive
Positioning
3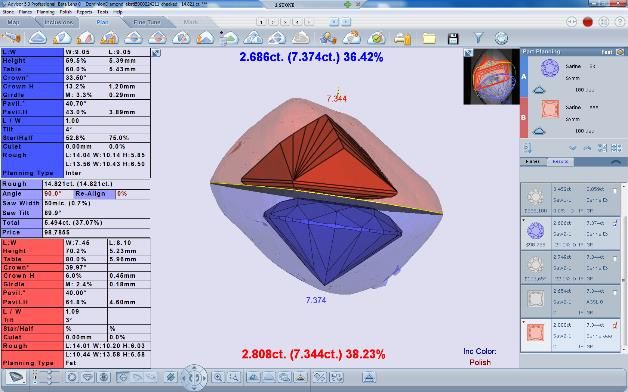
Company Overview

                   4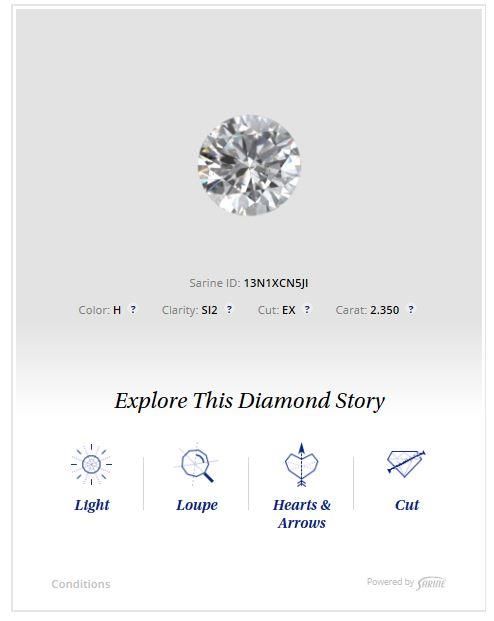
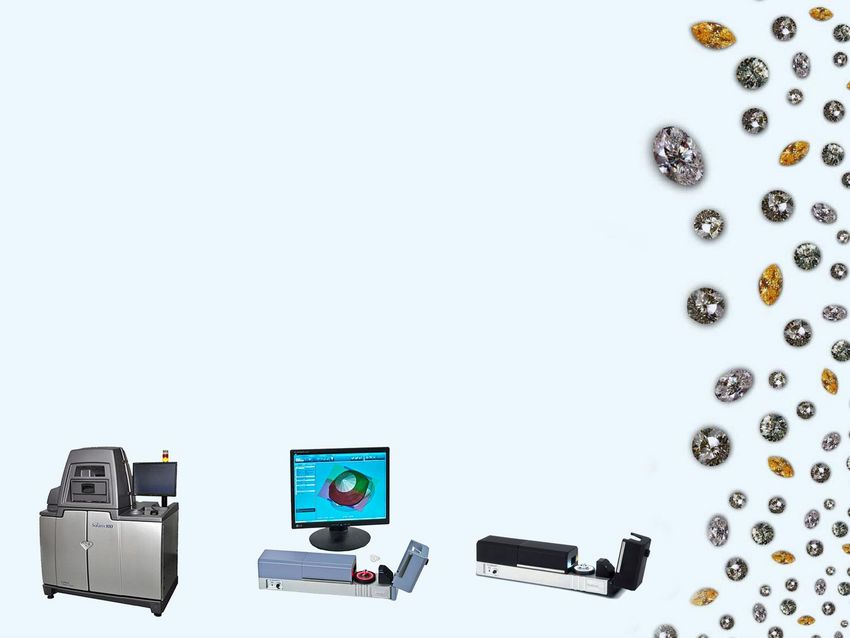
Sarine Technologies
 Sarine Technologies, through its proprietary systems and technologies, is a
 global leader in the development and provider of solutions for the entire diamond
 value chain, from rough diamonds evaluation, planning, manufacturing and
 finishing to polished diamonds assessment, grading and trade

                                                           Polishing &
                                                                                Laser       Visualisation
    Inclusion                           Sawing &               Cut
                       Planning                                              Inscription     & Grading        Trade
    Mapping                             Shaping             Finishing

                      DiaExpert Eye /
                      DiaExpert Atom                          DiaScan S+
                                                                              DiaScribe
 Galaxy / Solaris /
                                          Strategist &                                         Sarine Light
     Meteor
                                        Quazer III Green
                                         Laser System
                         DiaMark-Z                             Axiom

 Established in Israel in 1988 and listed on the Main Board of the Singapore

  Inclusion Mapping                                                                            Sarine Loupe   Profile
                          Advisor           Allegro         Instructor 3.0    Inscription
                                                                                Viewer

                                                                                                                        5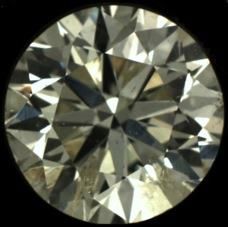
Inclusion Mapping Technologies
Before GalaxyTM
Technology Suppliers Disadvantages
Needs windows opened in stone
Done by expert personnel
Manual
Inclusion Sarine and others Limited success on complicated inclusions
Charting Limited to larger inclusion sizes
Very long (hours/days per stone) process
Expert personnel required - not all inclusions easily detected, often
many “false positives”
X-Ray Others
Relatively long process (hour +)
High cost
Automated Inclusion Mapping Technology with Galaxy
How opaque becomes transparent No need to pre-process the rough diamond (no “windows”)
Supports most types of stones (even thin mineral-coating)
Automatic; little user-expertise required
Identifies all types and most sizes of inclusions
Relatively fast operation (minutes)
Cost-effective
6
5-Year Results Summary (2010 – 2014)

(US$’000)                              2010             2011              2012     2013     2014

Revenues                             45,663           57,803             63,750   76,369   87,770

Gross Profit                         29,350           38,281             43,388   54,583   61,903

Net Profit                            11,111          17,366             20,755   23,888   27,230

Gross Profit Margin                   64.3%            66.2%             68.1%    71.5%    70.5%

Net Profit Margin                     24.3%            30.0%             32.6%    31.3%    31.0%
Cash and investments (no
                                     28,270           33,946             36,787   33,059   45,497
debt)

EPS (US cents, fully diluted)*         3.30             5.12              6.03     6.87     7.70

Annual Dividend (US cents)*            1.60             2.60              4.50     6.00     5.00
                                 *Adjusted for bonus issue in May 2012

                                                                                                    7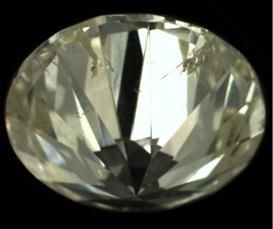
Proven Track Record of Product Innovation
2008 & Prior 2009 thru 2012 2013 thru 2015
DiaMensionTM GalaxyTM GalaxyTM XL DiaExpertTM GalaxyTM Ultra &
DiaExpertTM & SolarisTM Atom MeteorTM
DiaMensionTM DiaExpert TM DiaMensionTM Sarine ProfileTM
DiaMarkTM HD Nano 6.5 Axiom
DiaScanTM S+ DiaMobileTM QuazerTM II
XL
StrategistTM QuazerTM III
DiaScribeTM
Sarine LightTM
InstructorTM
QuazerTM AllegroTM
• DiaMark TM HD
Sarine LoupeTM
ColibriTM
8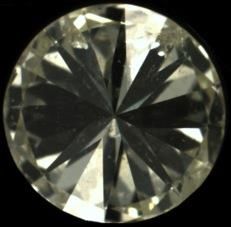
Products Update

                  9
DiaMensionTM Axiom / InstructorTM
DiaMensionTM Axiom
Quantum leap in proportion measurement and symmetry grading of
polished diamonds
Adopted by industry leaders (e.g., Tiffany) and by leading gemological
labs (e.g., GSI)
New Cut and Symmetry grading standards a new business opportunity
The InstructorTM software product
For the ongoing quality control of the actual polishing process as the
polished diamond is faceted
Unique capability of providing instructions on necessary corrective actions
and/or possible asymmetric enhancements
These products are expected to continue to drive the growth of the Group’s
polished diamond grading product line
10GalaxyTM Family Rollout
Optimal Planning with
No real competition for Group’s inclusion GalaxyTM Inclusion Mapping
mapping systems in the market. Note unique StrategistTM &
QuazerTM III pie-cut sawing
Total installed base of GalaxyTM family of
products just over 200 as at 30 September
2015
MeteorTM, Sarine’s inclusion mapping
system for rough stones of 20-85 points
launched; with throughput doubled it
addresses market segment where 50
million stones are polished – 4 times Pre-inclusion Mapping
GalaxyTM and SolarisTM segments State-of-the-Art
GalaxyTM Ultra gaining traction at expense
of competition’s high-end M-Box
11Sarine ProfileTM
Imaging technologies are gaining traction as
an essential marketing tool in the polished
diamond trade
Instead of a dry tabular non-intuitive report,
Sarine ProfileTM utilises all the benefits of
Sarine’s diverse cutting-edge technologies to
“show and tell” the stone with graphic and
video displays
Product launched 2015 with focus now on
pilot programs in U.S. and China/HK
GSI, one of world’s leading gem labs, has
adopted full Sarine ProfileTM into its polished
diamond grading and education services
Derivative technologies with enhanced value
propositions both for wholesale and retail
trade in work for Q4 2015 beta launch
12Sarine LightTM
Perfect Stone
With increasing demand for quality and branded diamonds, light High Clarity, Colour and Cut
performance parameters - brilliance, fire, scintillation/sparkle and grades
symmetry, are becoming key consumer-oriented criteria
2013: Sarine LightTM light performance grading report launched in
Japan with CIMA, a leading bridal diamond jewellery chain; CIMA
confirms Sarine LightTM has enhanced its positioning as high-end Low Clarity
retailer and contributed to higher sales.
Subsequently, adopted by leading Belgian diamond manufacturer
for quality assurance and sorting and by retail customers in the
US, India and Taiwan
Low Colour
2015: Integration of Sarine LightTM, Sarine LoupeTM and displays
of a polished diamond’s Cut and Hearts & Arrows to create
consumer-oriented diamond “story” – the Sarine ProfileTM
Leading US retailers adopting Sarine LightTM; moving away from
lesser competing products Low Cut
Development of new derivative functionality for Sarine Light TM in
progress with beta launch planned for Q4 2015
13Sarine LoupeTM
A unique imaging and inspection system that captures a polished diamond, including its
internal features, in simulated three dimensions
Enables buyers to view the polished stone from a multitude of angles and at varying
magnifications without having it in hand; with new derivative enhancements to imaging,
will significantly simplify the B2B buying process of polished diamonds while reducing
costs and time involved for both buyers and sellers
Sarine LoupeTM imaging services opened in India, Israel and New York. Brinks has
adopted it as an add-on service offered in Los Angeles and Hong Kong
Integrated into Sarine ProfileTM with optional levels of imaging and magnifications
Empowers online and enhances in-store polished diamond selling experience
Sarine LoupeTM Imagery of Included Stone
14AllegroTM
The AllegroTM system processes
gemstones (excluding diamonds) and
transforms the rough stone directly into a
cut and shaped (unfinished) gem with high
speed and accuracy
New product addresses new market with
proven Sarine technologies; market for
gemstones independent of and larger in
volume than that of diamonds (albeit lower
dollar value)
AllegroTM’s capabilities will be offered as
an inexpensive per-stone service and will
expand the recurring revenue base
Initial service centre to open in Jaipur,
India, mid-November; Service centres
expected to open in Thailand and South
America in 2016
15Going Forward
Given the immediate tangible benefits of Sarine’s unique technology and the
ongoing lack of competition, the Group is confident of extending the market
penetration of the GalaxyTM family of inclusion mapping systems
Inclusion mapping systems market penetration enhances demand for Sarine’s
planning products and contributes to the consolidation of the Group’s leading
market share for manufacturing products
New products such as Sarine LightTM, Sarine LoupeTM, Sarine ProfileTM and
similar services (as complementing bundles or standalone) address the
wholesale and retail trade of polished diamonds – a significant new market for
the Group with substantially larger potential for recurring revenue
Gemstone processing product, AllegroTM, addresses new market (gemstones
manufacturing) with significant potential to create additional recurrent income
stream for the Group
16Growth Drivers for Recurring Revenue
Important Catalysts to Future Growth
Deliveries of additional GalaxyTM family systems for rough diamond inclusion
scanning and mapping to customers
Increased adoption and roll-out of new products and services based on
digital trade visualisation solutions - Sarine LightTM , Sarine LoupeTM and
Sarine ProfileTM
Commercialisation of AllegroTM gemstones processing services
Benefits to Sarine
Expand Sarine’s presence to the trade segment of the diamond industry as
well as manufacturing market for other gemstones
Broaden the Group’s revenue base into polished diamond trade and
gemstones market
Increase the recurrent portion of the revenue stream for the Group
17Results Update
18Results Highlights
9M 2015 Group revenue and profitability declined to US$36.1m and
US$1.2m, respectively, as business conditions remained challenging:
o Disproportionate rough to polished diamond prices
o High polished inventories resulting in significantly reduced quantities of new rough
diamonds entering the midstream
o Lesser availability of credit to some diamond manufacturers
With only 1 GalaxyTM family system delivery in Q3 2015, total
installed base remained at just over 200 as at 30 September 2015;
recurring revenue accounted for half of 9M 2015 revenue
Group revenue of US$9.5m and net loss of US$1.2m in Q3 2015
Balance sheet remains strong as at 30 September 2015 with cash
and equivalents of US$31.8m
19
199M 2015 Results Summary
9M 2015 9M 2014
69.5
70
60
49.7
50
(US$ m)
40 36.1
30 27.8 28.0
24.4 23.3
20
10
3.5 3.3 2.1
(1.2) (4.6)
0
-10
Revenue Gross Profit Operating Profit Pre-tax Profit Tax Net Profit
%
(48%) (51%) (88%) (88%) (74%) (91%)
change
20Q3 2015 Results Summary
Q3 2015 Q3 2014
25
20.4
20
15 14.2
(US$ m)
9.5
10
6.8 6.8
6.0 5.7
5
0
(0.7) (0.9) (0.5) (1.1)
(1.4)
-5
Revenue Gross Profit Operating Profit Pre-tax Profit Tax Net Profit
%
(53%) (58%) NM NM (53%) NM
change
21Revenue Breakdown by Geography
Region 9M 2015 9M 2014 % Chg % Share
(US$’ 000) (US$’ 000) (9M 2015)
India 25,399 56,088 (55%) 70%
Africa 1,675 2,872 (42%) 5%
Europe 1,882 1,340 + 40% 5%
N. America 1,110 1,007 + 10% 3%
Israel 2,401 3,966 (40%) 7%
Other 3,589 4,177 (14%) 10%
Total 36,056 69,450 (48%) 100%
22Strong Balance Sheet (debt free)
(US$ millions) 30 Sep 2015 31 Dec 2014
Non-Current Assets 23.4 20.5
- Property, plant & equipment 12.0 11.5
- Intangible assets 8.2 6.8
Current Assets 56.6 71.6
- Inventories 10.9 10.1
- Trade receivables 10.5 13.5
- Cash & bank deposits 31.8* 45.5
Non-current Liabilities 0.2 0.2
Current Liabilities 9.9 12.3
- Trade payables 2.0 2.8
Shareholders’ Equity 69.9 79.6
* Decrease in cash & bank balances mainly due to US$12.2m dividend payment, US$1.3m share buy-
back and US$3.0m payment to licensor of software utilised in the Galaxy family of products
23Dividend
US cent/share 2015 2014 2013 2012
Interim 1.50 2.00 1.50 1.25
Special interim - 1.00 2.50 2.00
Final - 2.00 2.00 1.25
Total - 5.00 6.00 4.50
24Appendix
Industry Overview and Sarine’s Competitive
Positioning
25Diamond Industry Value Chain
De Beers concentrates ~ 40% of rough diamonds
Miners worldwide; Russia; Botswana; Australia; Canada;
Zimbabwe; others
India accounts for ~ 90% of all stones;
Manufacturers Southern Africa (S. Africa, Botswana and Namibia) and
China other manufacturing centres
Gemmological
Strategic customers setting industry standards
Laboratories
Wholesalers Belgium, Israel, USA, Hong Kong
• USA > 40% of global retail diamond market
Retailers • Hong Kong is second largest market (~25%)
• Chains gaining in importance over shops
26Diamond Industry Value Chain
Our products increase profits at
all stages of the diamond trade from purchase
of rough stones to sale of polished diamonds
Value of Market in US$ in 2014
$16.5 $16.7 $22.3 $78.5
billion billion billion billion
Rough
Rough Polished Retail Sales
Diamond
Diamond Diamond of Diamond
Mining
Sales Output Jewellery
Output
27Sarine’s Value Proposition
Challenges
• Increase industry players’ sustainable profitability
• Satisfy consumer concerns on issues of quality and beauty
Sarine’s Solutions
• Maximise polished value yield from rough diamonds, while reducing
risk and cutting costs
• Grade quality and beauty of polished diamonds according to 4Cs and
light performance
• Solutions to affirm and enhance marketing and branding
Sarine’s Expertise
Proprietary precision mechanics, optics, electronics, laser and colour
technology with sophisticated software in computerised systems
28Competitors
Diamond Planning & Laser Sawing &
Grading Products Cutting Products
OctoNus (Russia) Synova (Switzerland)
High-end rough planning and polished evaluation equipment- High-end, fast, safe green lasers; extremely expensive ($600K -
offers services and trying to gain traction, without success so $1M price tag)
far, with Immersion Glass inclusion mapping system; teamed
Soenen (Belgium)
with Lexus in India for sales
Quazer copy; very low market presence
Sahajanand Technologies (Surat, India)
Laxmi (India)
Former Sarine distributor in India- markets rough planners for
Low-cost/low-end green laser without shaping capabilities
low and medium range applications; announced in Dec. 2014
intent to offer competing inclusion mapping system (so far no S.O.S. (India)
launch) Mainstream infra-red (IR) laser supplier
Sahajanand Laser Technology (Ahmedabad, India) Sahajanand Technologies (India)
Low-end rough planning equipment with minimal market Low-end/low-cost IR laser; broadest presence
presence; has been trying, unsuccessfully so far, to launch
Nebula inclusion mapping system Sahajanand Laser Technology (India)
Low-end/low-cost IR laser; wide presence
OGI Systems (Israel)
Price player with diminishing international presence; OGI Systems (Israel)
announced in Dec. 2014 intent to offer competing inclusion Very limited market presence with a laser
mapping system (so far no launch)
Combined market share of competitors for diamond planning & grading products is still
smaller than Sarine’s (~70+%)
29Thank You
Q&A
30You can also read