SASSEUR REIT - Growth in a Sunrise Industry - First Listed Outlet Mall REIT in Asia - SGX
←
→
Page content transcription
If your browser does not render page correctly, please read the page content below
SASSEUR REIT – Growth in a Sunrise Industry
First Listed Outlet Mall REIT in Asia

CLSA Group Call Investor Presentation
                                        18 May 2021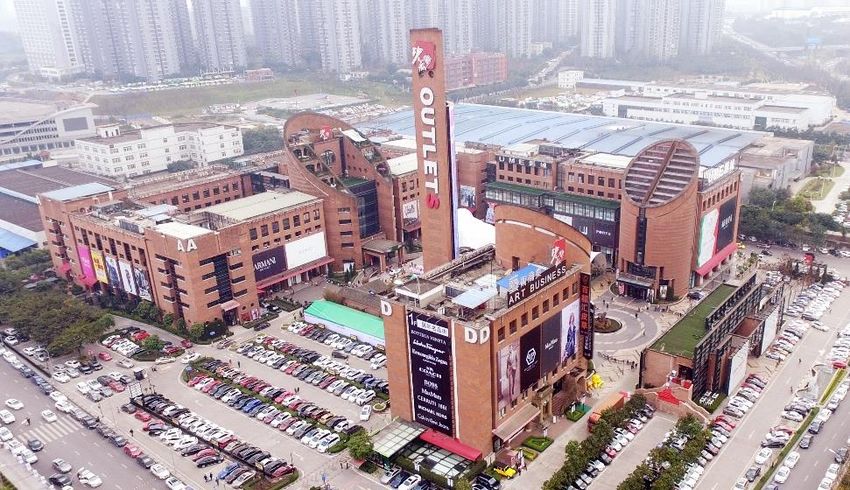
Disclaimer

 Not for release, publication or distribution in or into the United States, Canada, Japan or the People’s Republic of China.

 This presentation shall be read in conjunction with Sasseur REIT’s financial results announcement dated 12 May 2021
 published on SGX Net.

 This presentation is for information only and does not constitute or form part of an offer, invitation or solicitation of any offer to
 purchase or subscribe for any securities of Sasseur REIT in Singapore or any other jurisdiction nor should it or any part of it
 form the basis of, or be relied upon in connection with, any contract or commitment whatsoever. The value of the units in
 Sasseur REIT ("Units") and the income derived from them may fall as well as rise. Units are not obligations of, deposits in, or
 guaranteed by, the Manager, DBS Trustee Limited, as trustee of Sasseur REIT, Sasseur Cayman Holding Limited, as sponsor
 of Sasseur REIT or any of their respective affiliates. An investment in the Units is subject to investment risks, including the
 possible loss of the principal amount invested. Investors have no right to request that the Manager redeem or purchase their
 Units while the Units are listed. It is intended that unitholders of Sasseur REIT may only deal in their Units through trading on
 Singapore Exchange Securities Trading Limited (the "SGX-ST"). Listing of the Units on the SGX-ST does not guarantee a
 liquid market for the Units. The past performance of Sasseur REIT is not necessarily indicative of the future performance of
 Sasseur REIT.

 This presentation may contain forward-looking statements that involve risks and uncertainties. Actual future performance,
 outcomes and results may differ materially from those expressed in forward-looking statements as a result of a number of
 risks, uncertainties and assumptions. These forward-looking statements speak only as at the date of this presentation. No
 assurance can be given that future events will occur, that projections will be achieved, or that assumptions are correct.
 Representative example of these factors include (without limitation) general industry and economic conditions, interest rate
 trends, costs of capital and capital availability, competition from similar developments, shifts in expected levels of rental
 revenue, changes in operating expenses, property expenses, governmental and public policy changes and the continued
 availability of financing in the amounts and the terms to support future business.

 Investors are cautioned not to place undue reliance on these forward-looking statements which are based on the current view
 of management on future events.                                                                                                          2
Content

   Section 1   Key Investment Highlights

   Section 2   Overview of PRC’s Outlet Market

   Section 3   About Sasseur REIT

   Section 4   About Sasseur Group

   Section 5   Entrusted Management Agreement (“EMA”) Model

   Section 6   1Q 2021 Financial Results

   Section 7   Capital Management

   Section 8   Portfolio Update

   Section 9   Investment Merits

                                                              3
Key Investment Highlights

     Retail Outlet – A Sunrise Industry                                                           Sasseur - Leading Outlet Operator

              Fast-growing retail outlet sector
              projected to become world’s                                                                Leading privately-owned outlet mall
              largest by 20301                                                                           operator

               Growing middle-class population                                                           Deep understanding of local retail
               & spending power                                                                          market & diverse brand relationships

               Exposure to high-growth tier-2                                                            2 ROFR and 12 pipeline projects for
               PRC cities                                                                                potential acquisition

(1) Source: China Insights Consultancy
(2) Defined as the sales revenue opportunity available in the outlet industry after considering information such as economic development, population size, residents’
disposable income and outlets penetration

                                                                                                                                                                        4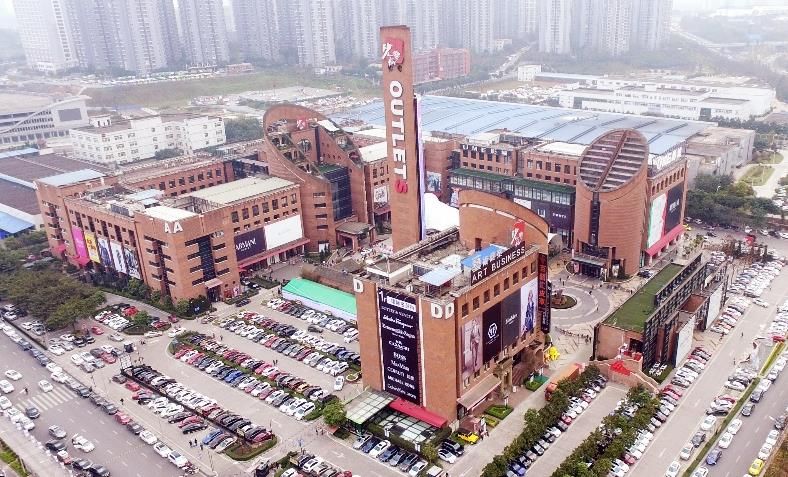
Growth of PRC Outlet Market

           Between 2015 to 2019, the number of outlets which surpassed
                  RMB >1 billion sales had more than doubled

                    16                                   34
                                                       outlets
                   outlets

                Total Sales                          Total Sales
              RMB >30 Billion                      RMB >70 Billion
                  Year 2015                            Year 2019

         Source: Outletscn 奥特莱斯网                                         5
Projected Growth of PRC Outlet Market

                                                                              Large Supply Gap Presenting              Young Industry with Room
 Retail Market Growth Projection
                                                                                  Upside Opportunity                      for Further Growth

                China Retail Sales                                                China’s Outlet Industry                   China’s Outlet Industry
                   (RMB billion)                                                       (RMB billion)                             (RMB billion)
                                                                                                            Supply
                                                                                                                                              US$96.2 US$91.5
                                                                                                             gap
                                        145                                                                   0.5
                       CAGR:
                                                                                     CAGR:
                       24.2%                                                         24.2%                                            CAGR:
                                                                                                                                      17.9%
                                      12,035                                                                                                                    USA
                                                                                 Supply                                                                609
                        19.8%                                                                    144.9                                           640            Outlet
           49                                                                     gap                                                                           Industry
                                                                                  30.6
         4,884                                                                                                          CAGR:
                         8.4%                                                                                           24.2%
                                        502
           335                                                                    49.1
                         5.6%                                                                                                       145
          1263                         1,655
                                                                                                                      49
          2016                         2021E                                                                         2016          2021E         2030E
                                                                                                                                               2030E
                                                                                  2016           2021E
                Outlets                  Retail Mall
                Online Platform          Department Store

                                                                                                                     Outlet Industry Year 2030 Projection
 A young industry – outlet market size is                                      Supply gap represents market
                                                                                                                                 PRC vs U.S.A
only approximately 1% of online platform                                      opportunity for the outlet industry
                                                                                                                            US$96.2B vs US$91.5B

                                                                                                                                                                      6
    Source: China Insights Consultancy - Independent Market Research Report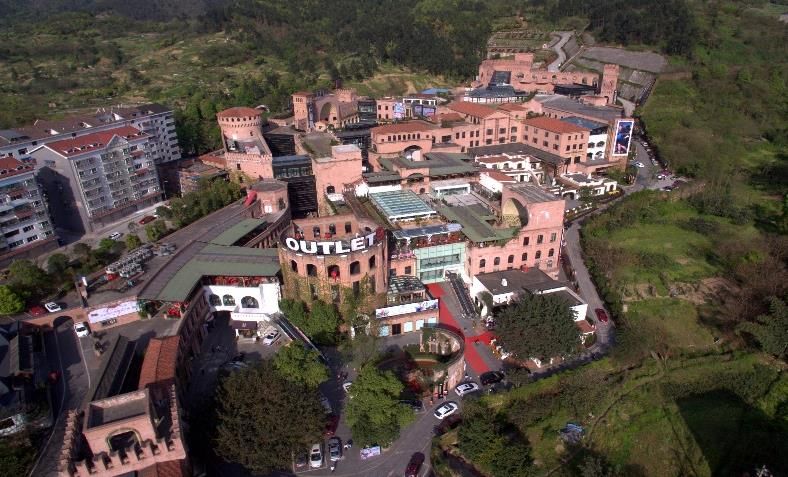
PRC’s Outlet Fundamentals Remain Attractive

           Fast Growing Middle                                                                                High Demand for
                                                                       Rising Affluence
            Class Population                                                                                   Luxury Brands

                                                                                     ~850M
                                                                                                               Annual Spending
                                                                       ~500M
              12.1%                                                                                          US$111
                      CAGR
                                                                                                                    Billion

           Projected to grow                                             2018          2030                  Chinese consumers
          12.1% annually from                                       Chinese population                      purchase more than a
           2015 to reach 216                                        with annual income                        third of the world’s
            million in 20211                                           > US$10,0002                              luxury goods3

1. Source: China Insights Consultancy - Independent Market Research Report
2. World Bank, Legal & General IM Estimates                                                                                          7
3. Business Times Article “Covid-19 has trapped US$111 billion of luxury spending in China”, 9 July 2020.
About Sasseur REIT

                      First
                Outlet Mall REIT
                 listed in Asia

                                   8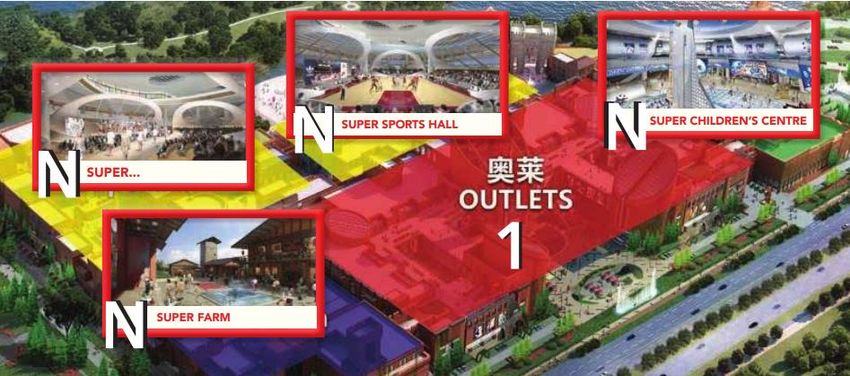
Sasseur REIT Structure
                                    Chairman Xu                               L Catterton Asia                         Ping An Real Estate

                                  Sasseur Cayman

                                        100.0%                                                                                 Public

                                  Cayman HoldCo            57.84%                                                             42.16%

                                   REIT Manager                                   Sasseur                                     Trustee
                                                                                   REIT
                                                                                    100%

                     100.0%                                                      SG HoldCo

                                                            Bishan Offshore                         Hefei Offshore          Kunming Offshore
Offshore
                                                               HoldCos                                HoldCos                  HoldCos

                                                                  100.0%                                100.0%                    100.0%
Onshore
                                 Entrusted                    Bishan PRC                             Hefei PRC               Kunming PRC
                                 Manager                        HoldCo                                HoldCo                   HoldCo
                                                   15.0%
                                  Entrusted                       85.0%
                                 Management
                                                             Chongqing
                                 Agreements
                                                            PRC HoldCo (1)

                                                                  100.0%             100.0%             100.0%                    100.0%

                                                              Chongqing             Bishan              Hefei                   Kunming
                                                               Outlets              Outlets            Outlets                   Outlets

 (1) Holds 40% interest in Chongqing West Outlets Brand Discount Commercial Co., Ltd. and Shanghai Pacific Rehouse Service Chongqing Co., Ltd.. Remaining 60% interest is   9
 held by Shanghai Pacific Rehouse Service Co. Ltd., an independent third party unrelated to the Sponsor (Sasseur Cayman Holding Limited) or Sasseur REIT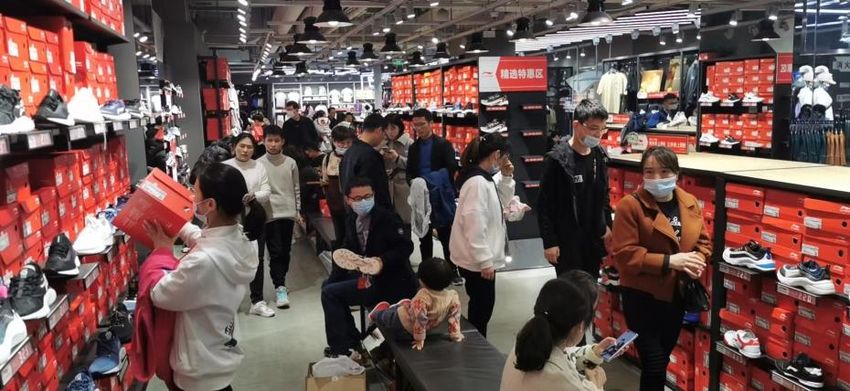
About Sasseur Group – Strong Sponsor
                                 Introduction to Sasseur Group
                                                                                                                                                        Changchun

                ▪   Founded in 1989, Sasseur is one of the leading premium
                    outlet groups in the People’s Republic of China (“PRC”), that
                    focuses on the development and operation of retail outlet
                                                                                                               Lanzhou
                    malls in the PRC                                                                                                         Yangzhou
                                                                                                                         Xi’an               Nanjing
                                                                                                                                    Hefei
                ▪   Sasseur manages 13 outlet malls in 12 major Chinese cities
                                                                                                               Bishan                          Hangzhou
                                                                                                               Chongqing
                ▪   Leverages on the founder’s passion for art and culture to                                                     Changsha
                                                                                                                                 Guiyang     Xiamen
                    develop and design all of Sasseur’s outlet malls, thus
                    offering a unique lifestyle experience for its customers                                     Kunming                                32 years of history
                                        Founded by Vito Xu                                                             Supported by Strategic Shareholders

                                           ▪ Vito Xu is the founder and chairman of                                                             ▪ Largest pan-Asian consumer-focused
                                             Sasseur with a wealth of experience in the                                                           private equity firm that operates within
                                             fashion industry.                                                                                    a global L Catterton platform
                                           ▪ In 1992, he entered the clothing industry                                                          ▪ Manages over USD 1.6 billion AUM
                                             and created his own women’s wear                                                                     (USD 2.6 billion with co-investments)(1)
                                             fashion line – Sasseur
                                           ▪ In 2008, he built the first Sasseur outlet in                                                      ▪ Affiliate of the Fortune 500 company
                                             Chongqing, an art piece that has won                                                                 Ping An Insurance
                                             numerous awards                                                                                    ▪ Professional real estate investment,
                                           ▪ Recipient of numerous prestigious awards                                                             development and management
                                                                                                                                                  platform of Ping An Insurance
                                                                                                                                                ▪ AUM of approximately RMB 420 billion
                                                                                                                                                  (USD 60 billion)(2)
(1) Provided by L Catterton Asia on 19 September 2017                                                                                                                                        10
(2) Extracted from Ping An Real Estate website (http://realestate.pingan.com/realestate/html/about.html) on 2 January 2020
About Sasseur Group – Strong Sponsor
Highly Recognised Enterprise One of the Leading Operators in China’s Outlet Industry
▪ 2020 China Top 10 Influential Commercial Enterprise ▪ 13 Outlets Under Management, 5 More in the Pipeline
Award
▪ Among the outlets in operation, 5 outlets achieve sales
▪ 2020 Chongqing Top 100 Enterprise – Ranked 34th Place above RMB 1 billion in 2019
with Revenue Over RMB 10 Billion
▪ 1,700 International and Local Brands
▪ 2020 China Top 500 Enterprise in Service Industry –
Ranked 304th place ▪ >55 Million Outlet Visitors in 2019
▪ China Commercial Real Estate Operation and Innovation ▪ 4.2 Million VIP Members across All Outlets
Award Source: Sasseur Group 2019 Performance Figures
2019 Sales Revenue
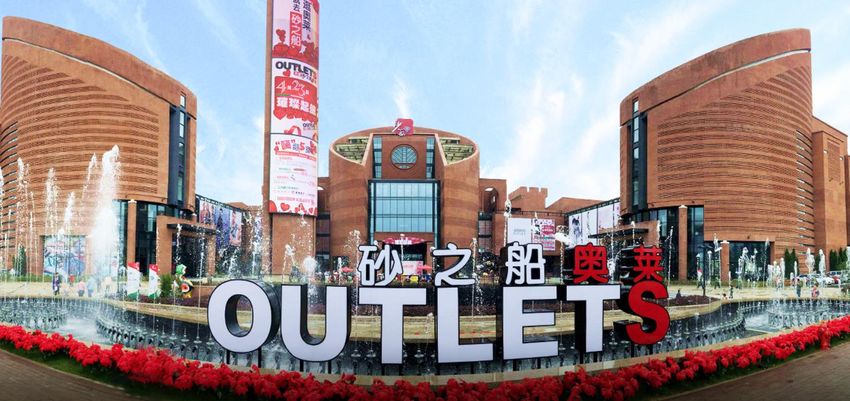
> RMB 2.5 Billion > RMB 1.5 Billion > RMB 1.5 Billion > RMB 1.0 Billion > RMB 1.0 Billion
Sasseur (Chongqing) Outlet Sasseur (Nanjing) Outlet Sasseur (Xi’an) Outlet Sasseur (Hefei) Outlet Sasseur (Guiyang) Outlet
11Sponsor’s Unique “Super Outlet” Business Model
“1” represents the outlet mall business platform and “N” reflects the various
lifestyle options offered in each of the outlet malls
Unique lifestyle experience based on a combination of art in the design and
decoration of its outlet malls, and as a one-stop shopping and lifestyle
experience, provides resilience against competition from e-commerce
A x (1+N) x DT
12Sponsor’s Unique “Super Outlet” Business Model
Integrated destination shopping combining “1+N” business model in the design
1 and operation of Sasseur REIT’s outlet malls
Enhances resilience to competition from online retail platforms by providing a
2 unique lifestyle shopping experience
3 Robust and proactive brand management
4 Alignment of interest with tenants through sales-based leases
5 More than 2.25 million VIP members across Sasseur REIT’s portfolio
13Sasseur – Leading Private Outlet Specialist in PRC
Leading private outlet specialist in PRC Benefits of being a private outlet specialist
Applicable
Outlet Operator Different Types of Outlet Operators in China Not applicable
Outlets
Operators category
Operational Brand Understanding Financial
Experience Resources of Local Market Strength
Local Private
Sasseur 砂之船 13 Local Private
Outlet Specialist Outlet
Specialists
Beijing Capital Real Estate
13
Grand 首创 Company SOE Retail
Groups
Shanshan 杉杉 Conglomerate 9 Real Estate
Companies
SOE Retail International
Bailian 百联 7
Group Outlet
Specialists
Wangfujing Real Estate
SCITECH Company 7 Mitigated by Sasseur’s access to strategic partners
王府井赛特 (L Catterton Asia & Ping An Real Estate)
International
RDM 6
Outlet Specialist
Source: Company Website 14Outlet’s Competitive Edge Against Other Retail Models
Outlets Department Store Shopping Mall Online Platform
Luxury and high-end
Product Mix Middle to high-end brands Middle to high-end brands Low priced products
brands
Pricing Strategy Large Discounts Normal Normal Low
Consumer Experience ✓ (small area with compact ✓ (no in-store shopping
layout) experience)
Location Suburbs City Center City Center -
Segment Middle Class Mass Market Mass Market Mass Market
Possibility of counterfeit
Authenticity ✓ ✓ ✓
goods
Brand Owners Customers
▪ Advantages Over Online ▪ Better Shopping Experience
Outlet Malls’
▪ Higher Profit Margin Competitive ▪ Product Authenticity
▪ Quicker Payback Period Edge ▪ High Discounts
▪ Enhanced Inventory Management ▪ Access to a Wide Range of Products
Why outlet is generally not impacted by e-commerce
▪ Product mix - per transaction via online platform ~ RMB200 vs per transaction at the outlet malls ~ RMB800/1000 => minimal product overlap
▪ Economics – online sales of outlet brands incur ~ 20% commission vs 10-16% commission at the outlets.
▪ Authenticity – 10X penalty / reward for selling by merchants / reporting by customers, of fake goods ensure no fakes goods at outlet
15
Source: China Insights Consultancy - Independent Market Research ReportEntrusted Management Agreement (EMA) Model
SASSEUR
SASSEUR(KUNMING) OUTLETS
(BISHAN) OUTLETSEntrusted Management Agreement Model
Business Model REIT Income Model
Outlet Sales Gross Revenue EMA Resultant Rent EM Base Fee Residual
Outlets Variable Component
(% of Sales)
Chongqing 4.0%
FC Bishan 4.5%
~10-16% Hefei 5.5%
Commission Kunming 5.0%
VC
EM Performance Fee
▪ GR = Total rental receivable + ▪ EMA Resultant Rent (“RR”) ▪ EM Base Fee: Up to ▪ EM Performance Fee:
Income from permissible comprises FC and VC 30% of GR to the 60% x (GR - RR - EM Base Fee)
investments ▪ REIT paid EMA Resultant Rent Entrusted Manager ▪ Payment to REIT:
before EM Base Fee 40% x (GR - RR - EM Base Fee)
▪ VC is pegged to the Sales of
the Outlet
The EMA Model aligns the interest of the Operating Manager with the REIT.
171Q 2021 Financial Results
SASSEUR (KUNMING) OUTLETS1Q 2021 Key Highlights
Sasseur REIT share price has recovered 70%
from a low of $0.525 in April 2020 to $0.890 in March 2021
1Q 2021 1Q 2020 Y-o-Y1
EMA Rental Income2 Sales
Occupancy
RMB 1,136.6
S$32.3 million S$25.3 million 27.8% 93.5%
million
Distributable Income
S$23.6 million S$16.0 million 47.8%
Distribution Per Unit3 Weighted
Average Aggregate
1.759 SG cents 1.334 SG cents 31.9% Leverage
Lease
NAV Per Unit Expiry4 27.6%
2.6 years
92.22 SG cents 92.58 SG cents (0.4%)
1. Y-o-Y comparison refers to 1Q 2021 vs 1Q 2020
2. Excluding straight-line accounting adjustments
3. For 1Q 2021, Sasseur REIT elected to distribute 90% of the distributable income to Unitholders
4. Weighted average lease expiry by net lettable area
19Financial Results
SASSEUR (CHONGQING LIANGJIANG) OUTLETS
201Q 2021 DPU Increased 31.9% vs 1Q 2020
Change Change
1Q 2021 4Q 2020 1Q 2020
% %
Fixed Component
105.5 102.4 +3.0 102.4 +3.0
(RMB mil)
Variable Component
51.9 56.7 -8.5 24.8 +109.4
(RMB mil)
EMA Rental Income1
157.4 159.1 -1.1 127.2 +23.7
(RMB mil)
EMA Rental Income1, 2
32.3 32.3 +0.1 25.3 +27.8
(S$ mil)
Distributable Income
23.6 23.3 +1.3 16.0 +47.8
(S$ mil)
DPU (SG cents) 1.759 1.935 -9.1 1.334 +31.9
1. Excluding straight-line accounting adjustments.
2. Using the average SGD:RMB rate for the period 1Q 2021 4.8730, 4Q 2020 4.9223, 1Q 2020 5.0339.
21Healthy Balance Sheet
S$ mil 31 Dec 2020 31 Mar 2021
Investment properties 1,651.1 1,670.5
Cash and short-term deposits 155.9 154.2
Other assets 51.2 33.7
Total Assets 1,858.2 1,858.4
Loans and borrowings 504.3 499.5
Other liabilities 248.5 241.1
Total Liabilities 752.8 740.6
Net Assets 1,105.4 1,117.8
NAV per unit (cents) 1 91.40 92.22
Aggregate Leverage 27.9% 27.6%
1. Based on units in issue and issuable of 1,209,412,000 and 1,212,114,636 as at 31 December 2020 and 31 March 2021 respectively.
22Distribution Details
Distribution Period 1 1 January to 31 March 2021
Distribution Per Unit1 1.759 Singapore cents
1. Based on 90% distribution pay-out ratio
Distribution Timetable
Notice of Books Closure Date 12 May 2021
Ex-dividend Date 10 June 2021
Books Closure Date 11 June 2021
Distribution Payment Date 25 June 2021
23Sasseur REIT Yield vs Other Asset Classes
1
Sasseur REIT Distribution Yield 8.0%
2
Average of the 43 S-REITs and Property Trust 5.8%
2
STI Index 3.3%
CPF Ordinary Account Interest Rate 2.5%
MAS Benchmark Govt Bond 10 Year 3 1.7%
4
Singapore Fixed Deposit Rate 0.2%
Notes:
1. Distribution yield based on annualised DPU and closing price of S$0.890 as at 31 March 2021
2. Based on 12M Average Dividend Yield
3. Based on 10 Year Yield
4. 12M Bank fixed deposit rates from MAS as of 31 March 2021
Source: Bloomberg, SGX, Central Provident Fund (CPF) Board, data as of 31 March 2021 24Capital Management
SASSEUR (HEFEI) OUTLETS
25Prudent Capital Management
Aggregate leverage at 27.6% provides debt headroom for acquisition
Average Interest Weighted
Aggregate
Debt Coverage Average Cost
Leverage of Debt
Maturity Ratio
31 Mar 2021 31 Mar 2021 1Q 2021 1Q 2021
27.6% 2.0 years 7.5 times 3.3% p.a.
31 Dec 2020 31 Dec 2020 1Q 2020 1Q 2020
27.9% 2.2 years 4.7 times 4.3% p.a.
Loan Facilities Onshore Offshore
Currency RMB SGD USD
Outstanding ~SGD 271 million SGD 214 million USD 20 million
Quantum1 (RMB 1.32 billion) (~RMB 1.04 billion) (~RMB 0.13 billion)
Maturity March 2023 March 2023 March 2023
Floating Rate 5-year LPR Singapore SOR USD LIBOR
1. Based on SGD:RMB exchange rate of 4.8768 as at 31 Mar 2021
26Prudent Capital Management
Debt Facilities (SGD million)
Debt Headroom1 Debt Headroom1
823 834
Offshore Debts2 Offshore Debts2
Aggregate 247
Aggregate
241
Leverage Leverage
27.9% 27.6%
Onshore Debts2 Onshore Debts2
271 271
31 December 2020 31 March 2021
50% Limit3 50% Limit3
1. Debt headroom is computed based on total assets and assuming a corresponding increase in total assets with new debts raised.
2. Debt amounts are translated using exchange rates as at each period end.
3. 50% leverage limit is based on MAS’s leverage limit.
27Debt Maturity Profile
Weighted average debt maturity is 2.0 years
S$ million
Debt Maturity
503
3 6
2021 2022 2023
28Portfolio Update
SASSEUR (HEFEI) OUTLETSPortfolio Summary
Portfolio
Valuation* : 8,142 mil
NLA : 312,844 sqm
Occupancy ^ : 93.5%
Hefei Outlets
*Based on independent valuation as at
31 Dec 20 by JLL (RMB million). Valuation : 2,758 mil
^Occupancy for 1Q 2021 NLA : 144,583 sqm
Occupancy : 95.2%
Chongqing Liangjiang
Chongqing Bishan Kunming Outlets Outlets
Outlets
Valuation : 1,593 mil Valuation : 2,982 mil
Valuation : 809 mil
NLA : 70,067 sqm NLA : 50,885 sqm
NLA : 47,308 sqm
30
Occupancy : 96.1% Occupancy : 100%
Occupancy : 81.0%1Q 2021 Outlet Sales Summary
Outlet sales are 112.6% higher than 1Q 2020 but 5.8% lower than 1Q 2019
1Q 2021 1Q 2021 vs 1Q 2021 vs 1Q 2021 vs
Outlets Sales 1Q 2020 1Q 2019 4Q 2020
(RMB’mil) (%) (%) (%)
Chongqing Liangjiang 560.5 +141.1 -8.0 -11.1
Chongqing Bishan 111.3 +114.6 -10.8 -15.5
Hefei 244.2 +90.2 +0.5 -11.5
Kunming 220.6 +81.1 -3.7 +5.9
Portfolio 1,136.6 +112.6 -5.8 -8.8
1. 1Q 2021: 01 Jan 2021 - 31 Mar 2021
2. 4Q 2020: 01 Oct 2020 - 31 Dec 2020
3. 1Q 2020: 01 Jan 2020 - 31 Mar 2020
4. 1Q 2019: 01 Jan 2019 - 31 Mar 2019
31
SASSEUR (HEFEI) OUTLETSPortfolio Occupancy
4 Outlets enjoy stable occupancy
100.0% 100.0%
94.9% 95.2% 95.8% 96.1% 93.5% 93.5%
81.4% 81.0%
4Q20 1Q21 4Q20 1Q21 4Q20 1Q21 4Q20 1Q21 4Q20 1Q21
重庆两江 重庆璧山 合肥 昆明 项目组合
Chongqing Liangjiang Chongqing Bishan Hefei Kunming Portfolio
32Weighted Average Lease Expiry (WALE)
Deliberate short lease to optimise tenant mix
Lease Expiry by NLA & Gross Revenue WALE by :
80.0%
NLA 2.6 years
69.2%
70.0%
Gross Revenue 1.0 years
60.0%
50.8%
50.0%
40.0%
30.0% 26.1%
20.0% 16.5% 15.5%
10.0% 6.6% 7.1% 8.2%
0.0%
2021 2022 2023 2024 & Beyond
by NLA by Gross Revenue
As at 31 March 2021
33
SASSEUR (HEFEI) OUTLETSVIP Members - Growth by Outlets
Total VIP members increased 6.8% in 1Q 2021 to reach 2.25 million
Members in ‘000
2500
2,252
2,108
2000
1500
1000
737 681
483
500 351
0
Chongqing Liangjiang Chongqing Bishan Hefei Kunming Total
2017 2018 2019 2020 1Q2021
34Well Diversified Trade Mix
Breakdown of NLA1 by Trade Sector Breakdown of Revenue2 by Trade Sector
Lifestyle & Accessories 1.8% Kids-centric Centres Anchor Tenants 0.9%
Ad-hoc Outlets
Entertainment 3.5% Lifestyle & Entertainment 1.2% 1.2%
0.5% Ad-hoc Outlets 0.7%
Children 4.1% Accessories 2.4%
Shoe & Leather F&B 3.1%
Goods 4.7%
Shoe & Leather Goods
4.4%
Kids-centric
Centres 6.4% Children 5.7%
Fashion 35.1%
F&B 6.7%
Fashion 43.9%
Sports 16.0%
Sports 10.2%
Anchor Tenants International
11.7% Brands 15.4% International
Brands 20.6%
Fashion, Sports and International Brands
60.7% 80.5%
1. As percentage of the portfolio’s net lettable areas as at 31 Mar 2021 35
2. As percentage of the portfolio’s gross revenue as at 31 Mar 2021Exciting Promotional Activities to draw Shoppers
36Chongqing Liangjiang Outlets
Sales
RMB 'Mil Chongqing
750 673
609 630
561 580 593
600
480
450 396
300 233
150
-
1Q 2Q 3Q 4Q
2017 2018 2019 2020 2021
Year Commenced Operations Sep 2008
Outlet Members
GFA (sqm) 73,373 (‘000)
800 737
NLA (sqm) 50,885 671 66
635
650 586 36
49
Occupancy Rate (%, 31 Mar 21) 530
100 486
514 57
500 28 16
406 79
No. of Tenants (31 Mar 21) 384 341 65
350 302 635 671
39 586
514 530
+39 Space, Coach, Adidas, 486
Top Brands/Tenants 200 202
406
FILA 302 341
Car Park Lots 500 50 100
2018 1Q2019 2Q2019 3Q2019 4Q2019 1Q2020 2Q2020 3Q2020 4Q2020 1Q2021
37
Valuation (RMB mil, 31 Dec 20) 2,982 Existing NewChongqing Bishan Outlets
Sales
RMB 'Mil Bishan
150
125 127 132
111 114
106
100
93
79
52
50
-
1Q 2Q 3Q 4Q
2017 2018 2019 2020 2021
Year Commenced Operations Oct 2014 Outlet Members
GFA (sqm) 68,791 (‘000)
351
350 326
NLA (sqm) 47,308 301 26
284 25
256 263 17
231 21
Occupancy Rate (%, 31 Mar 21) 250 25 7
81.0 204
182 26
155 23 326
27 284 301
150 256 263
No. of Tenants (31 Mar 21) 201 28 204 231
155 182
127
Nike, +39 Space, Adidas, 50
Top Brands/Tenants
FILA, Maniform 2018 1Q2019 2Q2019 3Q2019 4Q2019 1Q2020 2Q2020 3Q2020 4Q2020 1Q2021
Car Park Lots 400
Existing New
38
Valuation (RMB mil, 31 Dec 20) 809Hefei Outlets
Sales
RMB 'Mil Hefei
400
338
286
300 273 276
243 244
218 223
200
128
100
-
1Q 2Q 3Q 4Q
2017 2018 2019 2020 2021
Year Commenced Operations May 2016 Outlet Members
GFA (sqm) 147,316 (‘000)
750 681
646
NLA (sqm) 144,583 650 35
573 72
522
550 478 52
Occupancy Rate (%, 31 Mar 21) 95.2 440 43
450 38
352 88
No. of Tenants (31 Mar 21) 346 350 291 61
646
249 573
42 478 522
250 203
46 440
Nike, Adidas, +39 Space, 352
Top Brands/Tenants 150 67 249 291
Coach, FILA 203
136
50
Car Park Lots 1,566 2018 1Q2019 2Q2019 3Q2019 4Q2019 1Q2020 2Q2020 3Q2020 4Q2020 1Q2021
39
Valuation (RMB mil, 31 Dec 20) 2,758 Existing New SASSEUR (HEFEI) OUTLETSKunming Outlets
Sales
RMB 'Mil Kunming
250 238 237
229 221
208
200 180 188
143
150
122
100
50
-
1Q 2Q 3Q 4Q
2017 2018 2019 2020 2021
Year Commenced Operations Dec 2016 Outlet Members
GFA (sqm) 88,257 (‘000)
550
466 483
NLA (sqm) 70,067 446 17
450 417 20
390 29
374 27
16
Occupancy Rate (%, 31 Mar 21) 96.1 350 322 52
242 80
250 446 466
No. of Tenants (31 Mar 21) 245 177 65 374 390 417
159 322
150 18
242
Nike, Adidas, +39 Space, 63 177
Top Brands/Tenants 159
Coach, Li-Ning, FILA 50 96
2018 1Q2019 2Q2019 3Q2019 4Q2019 1Q2020 2Q2020 3Q2020 4Q2020 1Q2021
Car Park Lots 2,000
Existing New 40
Valuation (RMB mil, 31 Dec 20) 1,593 SASSEUR (HEFEI) OUTLETSPotential Pipelines
• All acquisitions must be yield accretive
• Reduce concentration risk, explore other parts of the World
Changchun
• 7 out of 12 Pipeline Properties are in operation
Shijiazhuang
ROFR Properties Lanzhou Xi’an
Nanjing &
Yangzhou
Shanghai
Nanjing II Suzhou
Xi’an Guiyang Changsha Hangzhou
Guiyang Xiamen
Opening Date Sep 2017 Dec 2017
Shenzhen
GFA (sqm) 141,708 193,520
Car Park Lots c.2,000 c.1,000
Opening Soon
Pipeline Properties
Nanjing Hangzhou Changchun Changsha Lanzhou Yangzhou Xiamen Suzhou Nanjing II Shijiazhuang Shanghai Shenzhen
Opening May Jun Sep Dec Dec Sep Nov Sep Apr Sep
~ 2022 ~ 2022
Date 2015 2011 2017 2018 2019 2020 2020 2021 2022 2022
GFA (sqm) 149,875 45,873 172,128 210,600 ~100,000 114,650 74,987 ~77,843 ~100,000 ~83,000 ~109,000 ~150,000
Car Park
c.8,000 c.5,000 c.4,000 c.2,084 c.2,500 c.1,200 c.1,500 c. 1,500 c. 1,100 c. 3,500 c.2,500 c.2,200
Lots
41Investment Merits
42
SASSEUR (KUNMING) OUTLETSKey Milestone and Awards
FTSE EPRA NAREIT Global Emerging Market Index Inclusion1
1 2 3
Most Promising REIT in Best Retail REIT (Platinum) Best REIT Deal in
Asia Best CEO (Platinum) Southeast Asia 2018
By: Fortune Times REITs Pinnacle Best Investor Relations (Gold) By: Alpha Southeast Asia 12th Annual
Awards 2018 By: 6th Asia Pacific REITs Awards 2019 Best Deal & Solution Awards 2018
4 5 6
Best Retail REIT (Platinum)
REIT Company of The Best CEO (Platinum)
Best Commercial REIT
Year – Singapore 2019 Best Investor Relations (Platinum) Asia 2020
By: International Investor Magazine By: 7th Asia Pacific REITs Awards 2020 By: Capital Finance International
1. Since 23 December 2019.
43Investment Merits
Market Leadership: Sasseur Group is one of the largest outlet operator in
1 China, with 13 outlets and over 13 years of operating experience
Unique Art-Commerce Busines model : Full alignment of interests of tenants,
2 REIT unitholders, the REIT and entrusted managers, with the potential for
sharing upsides
Proactive Asset Management Strategy : Focus on asset enhancement and
3 organic growth and yield accretive acquisitions
Resilient Retail Segment : High growth sector offering attractive value-for-
4 money branded products that cater to the rising aspirations and demand of
the expanding Chinese middle class
Strong Partnerships: Longstanding and strong business relationships with
5 leading premium international and local retail brands
44Why Sasseur REIT ?
EMA Model
Strong
Growth
Potential
13
Outlets
Leading
Resilient Outlet
Retail Operator
Segment in China
Sasseur
Strong
REIT
Interest Attractive Ongoing AEI
Alignment Valuation
through
EMA 8.0% Yield
Leveraging on Strong Model Growth
Sponsor Support Potential
Chongqing Hefei
✓ 2 ROFR, 12 pipelines AEI &
Acquisition
45Thank You
For enquiries, please contact:
Ms Wong Siew Lu, CFA, CA (Singapore)
Head, Investor Relations and Corporate Affairs
Email: wongsl@sasseurreit.com
Tel: +65 6360 0290
Address: 7 Temasek Boulevard, #06-05, Suntec Tower One,
Singapore 038987You can also read