Schroder European Real Estate Investment Trust - Half-year results presentation - 2018 Jeff O'Dwyer: SEREIT Manager Andrew MacDonald: Head of Real ...
←
→
Page content transcription
If your browser does not render page correctly, please read the page content below

Schroder European Real Estate Investment Trust
Half-year results presentation - 2018
Jeff O’Dwyer: SEREIT Manager                                                    12 June 2018
Andrew MacDonald: Head of Real Estate Finance
                                                Marketing material for professional investors and advisers only.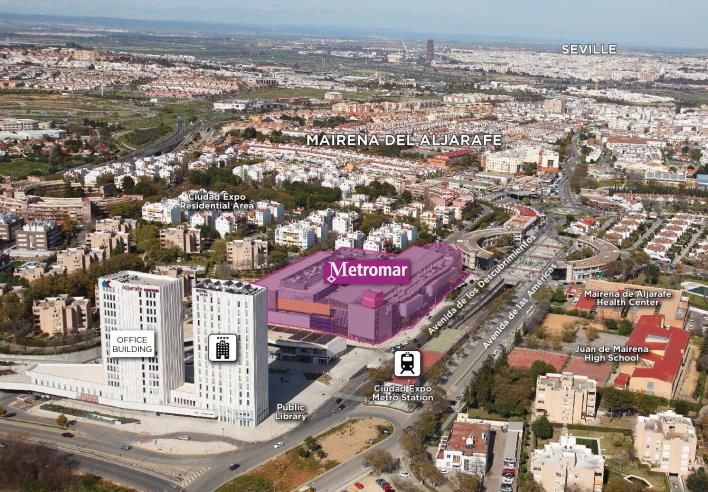
Contents page

01   Highlights

02   Portfolio and asset management

03   Markets

04   Financial highlights

05   Summary

1

Highlights
The European growth city strategy
Achieved full investment, target dividend in growing European cities

             Investment                                          Finance                                  European markets                    Growth strategy
•   Full investment – c.€20m Dutch                  •   Profit increased 157% driven                •   Markets: Broad based economic    Dividend: Achieved IPO target of
    data centre acquisition at 10% NIY                  by valuation and net income                     recovery:                        5.5% on Euro IPO issue price2
    taking portfolio to c. €237m1
                                                    •   EPRA earnings grown to
                                                                                                    -   GDP / sentiment improving
                                                                                                                                         Pipeline: Mixture of single asset and
•   85% of portfolio located in                         €6.5m – increased from €2.6m                -   Employment increasing            portfolio opportunities to redeploy
    fastest growing cities across 10                    for 2017 interim period                     -   Voids falling                    Casino proceeds
    investments in western Europe                                                                   -   Rents increasing
                                                    •   Quarterly dividend 1.85 cents
                                                                                                    -   Price growth continues
                                                                                                                                         Accretive growth: Grow portfolio
•   Occupancy over 97%, 6.7 yrs lease                   p.s., fully covered by net income                                                through earnings enhancing
    length                                                                                          -   Modest development pipeline      acquisitions
                                                    •   4.9% NAV increase to
•   6 new lettings / re-gears achieved                  €187.1m (139.9 cents p.s)                   •   Megatrends: Urbanisation,        Scale benefits: Improves
    across c. 5,000 sqm and €3.9m                                                                       infrastructure, demographic      diversification, liquidity and cost
    lease surrender premium                         •   NAV total return of 6.1% over                   change                           economies
                                                        six months to Mar 18
•   Contracted sale of two retail                                                                   •   Market presence: Deep local
    investments at a 10% premium to                 •   28% LTV at interest cost of                     market knowledge and access of
    Dec 2017 value                                      1.3% and duration of c. 6.4                     Schroder European teams
                                                        years

Past performance is not a guide to future performance and may not be repeated. The value of investments and the income from them may go down as
well as up and investors may not get back the amounts originally invested.
Source: Schroders, June 2018 1Portfolio market value is based on 31 March 2018. 2Yield based on IPO issue price in Euro

3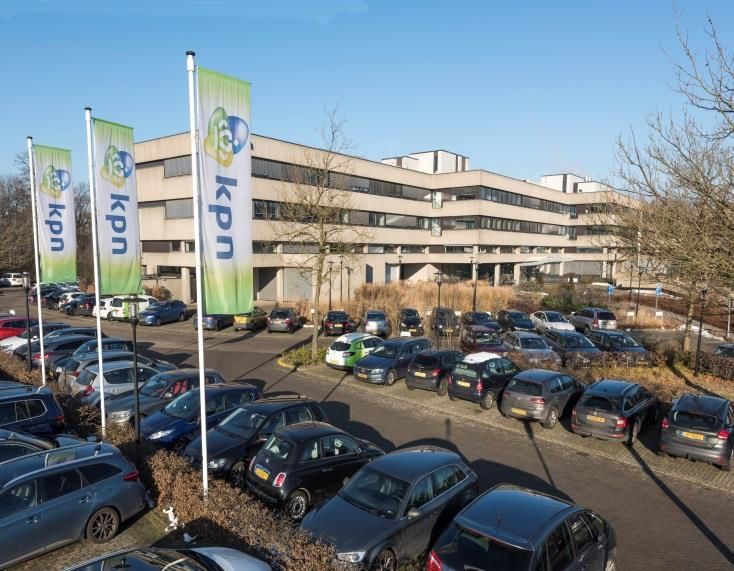
Portfolio and asset management
Portfolio evolution
Invested €237m1 across 10 assets in France, Germany, Spain and Neth.
Berlin, Germany                           Stuttgart, Germany                       Frankfurt, Germany                       Rennes, France      Seville, Spain
Retail Warehouse                          Office                                   Retail                                   Retail              Retail

Jan 2016                                                                                                                                                                  2018

                                                                                                                                                                 €237m1
€0

Paris, France                             Hamburg, Germany                         Biarritz, France                         St. Cloud, Paris,   Apeldoorn,
Office                                    Office                                   Retail                                   France              Netherlands
                                                                                                                            Office              Data centre / mixed use

Source: Schroders, June 2018. For illustrative purposes only and should not be viewed as a recommendation to buy or sell.
1Portfolio market value is based on 31 March 2018 including Rennes & Biarritz at contracted option price

5
Portfolio overview
Ten institutional grade assets located in target growth markets
 City                         Country        Sector        Valuation           No.           Contracted        WAULT to          Void
                                                                             Tenants           rents            expiry
                                                               €m                                    €m              Yrs           %
Paris (B-B)                   France        Office            42.1                 4                2.4              3.1
Paris (SC)                    France        Office            35.2               11                 3.5              5.0          3%
Biarritz                      France        Retail            23.9                 9                1.3              9.9          1%
Rennes                        France        Retail            20.9                 1                0.9              10.2
France Subtotal                                              122.1              25                  8.0              5.8          1%
Berlin                        Germany       Retail            26.0                 1                1.6              7.8
Hamburg                       Germany       Office            16.0               18                 0.5              2.8          31%
Stuttgart                     Germany       Office            15.6                 4                0.8              7.6          0%
Frankfurt                     Germany       Retail            11.5                 6                0.7              6.3
Germany Subtotal                                              69.0              29                  3.7              6.7          7%
Seville                       Spain         Retail            26.0               47                 2.0              7.6          4%
Apeldoorn                     Netherlands Mixed               20.2                 1                2.4              8.8
Total Portfolio                                              237.3              102                16.1              6.7          3%
                 Country allocation                                          Property allocation                                                 Sector allocation
                                                                                            5%
                         9%                                                         7%                                                                    8%
                                                                                                 18%
                                                                                   7%
                   11%
                                                                                   9%                                                                              46%
                                                                                                     15%
                                 51%                                               9%
                   29%                                                                                                                              46%
                                                                                                   11%
                                                                             10%            11%

                                                                Paris B-B)     Paris (SC)        Berlin    Seville
                                                                Biarritz       Apeldoorn         Rennes    Hamburg                         Office         Retail         Mixed
        France    Germany      Spain    Netherlands
                                                                Stuttgart      Frankfurt
   Source: Schroders, June 2018. Data as of 31 March 2018. For illustrative purposes only and should not be viewed as a recommendation to buy or sell.
6 Percentages in charts based on value
Management of breaks and lease expiries
Asset business plans being executed
    Lease expiry to earliest termination

Source: Schroders, June 2018. Data as of 31 March 2018. Forecast risk warning: Please see the information slide at the end of this presentation.
For illustrative purposes only and should not be viewed as a recommendation to buy or sell.

7
Transactions over the period
Data centre purchase / Sale of retail
                                                                        Apeldoorn, The Netherlands purchase
                                                                        Purchase Price            c. €20m / €835 psm / 10% NIY
                                                                        Location                  Apeldoorn – central Netherlands c. 1 hour drive east of Amsterdam
                                                                                              •    Data centre / mixed use investment built in 1970 and refurbished in 06 / 15
                                                                                              •    Strategic location in the Netherlands (central, strong ICT labour pool)
                                                                                              •    Long term (c.9 years) indexed linked income to KPN
                                                                        Description           •    Attractive net initial yield of approximately 10% and a capital value per sqm
                                                                                                   substantially less than replacement cost
                                                                                              •    Large site area of over 3.5 hectares. Immediate surrounds include a mixture of
                                                                                                   medium density residential, light industrial, retail and offices

                                                                        Strategy                         Re-gear lease                Longer term alternate use

                                                                        Rennes & Biarritz, French retail sale
                                                                        Sale Price                10% premium to last independent valuation
                                                                        Locations                 Casino hypermarkets in Rennes and Biarritz, France
                                                                                              •    Purchase in June 2016 of two grocery anchored retail investments at a net initial
                                                                                                   yield of 5%
                                                                        Description           •    Long term lease provided stable income with limited active asset management
                                                                                              •    JV partner (Casino Group) exercised purchase option at a strike price reflecting a
                                                                                                   10% premium to last independent valuation

                                                                        Strategy                  Re-deploy proceeds into higher yielding investments that enhance diversification

8 Source: Schroders, June 2018. Stocks shown are for illustrative purposes only and should not be viewed as a recommendation to buy or sell.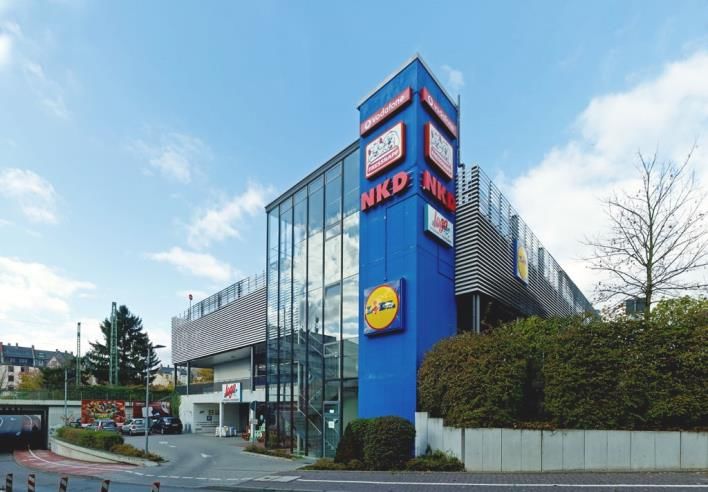
2017/18 asset management
Successful delivery increased occupancy and rental income
Asset management initiatives
                                                                          •   Re-gearing of c.25% of the office area with the merging of Fila Assistance
                                           Paris,                             and Garantie Assistance. Revised lease reflects a 4/6/9 year term at an
Saint Cloud              Office
                                           France                             annual rent 13% above ERV
                                                                          •   Commencement of renovation of lift lobbies, with completion due H2 2018

Boulogne-                                  Paris,
                         Office                                           •   New lease for communications antenna on a 12 year term
Billancourt                                France

                                           Hamburg,                       •   Conclusion of a €3.9m lease surrender premium with City BKK,
City Sud                 Office
                                           Germany                            representing 4.7 years of annual rent

                                                                          •   Removed under-performing restaurant and added a new burger specialist
                                                                          •   Advancing scope of works that will improve centres signage, wayfaring,
                                           Seville,
Metromar                 Retail                                               lighting and general vibrancy
                                           Spain
                                                                          •   Finalised new lease with leisure specialist Urban Planet on an historically
                                                                              non income producing space totalling 1,200 sqm

Source: Schroders, June 2018. For illustrative purposes only and should not be viewed as a recommendation to buy or sell.

9
Asset Management
SEREIT is due to deliver short, medium and long-term opportunities
2018 2021 2022 2022/23 2025+
Improve centres signage, Alten expiry – target re-gear Re-development potential at Stuttgart to benefit from 2025 expiry of initial term at
wayfaring, lighting and prior (6,861 sqm) at Boulogne Billancopurt improved infrastructure from Hornbach, Berlin - 4 hectare
vibrancy at Metromar due Boulogne Billancourt the completion of site with alternate use
Q3 2018. Design under way ‘Stuttgarter 21’ potential
Lease surrender premium Grand Paris Transport
regarding City BKK in improvements St Cloud, Paris
Hamburg (5,468 sqm)
completed
Refurbishment program for
lift lobbies at Boulogne
Billancourt due end Q2 2018
Completion of key lettings –
Urban Planet and ex.
Massimo Dutti at Metromar
St Cloud (Paris) – re-gearing / transport Metromar – improving vibrancy / tenancy mix Hamburg – City BKK lease surrender Berlin – 4 hectares in growth corridor
Source: Schroders, June 2018. Forecast risk warning: Please see the information slide at the end of this presentation.
10Continental European investment
Senior team
Duncan Owen
Global Head of Real Estate
Mark Callender Andrew MacDonald Philipp Ellebracht
Jeff O’Dwyer
Head of Real Estate Head of Real Estate Head of Real Estate Product,
Pan European Fund Manager
Research Finance Europe
France Germany Switzerland Nordics Italy
Thomas Guyot Nils Heetmeyer Roger Hennig Eva Granlund Svicom
Local Asset Management Teams
Offices Retail Industrial
Support from legal, accounting, operations, risk and client servicing teams based
in London, Jersey and Luxembourg
Source: Schroders, June 2018.
11Markets
Focus on growth – cities not countries
Major cities and regions predicted faster economic growth

Average GDP Growth 2018-2022, % pa

     3.0

     2.5

     2.0

     1.5

     1.0

     0.5

                                                                                                                                                                                   Rome
                                   Copenhagen

                                                                                      Finland

                                                                                                                               Dusseldorf
              Sweden

                                      Denmark

                                                                                                                                  Munich
           Stockholm

                                                Manchester

                                                                   Madrid

                                                                                                        Zurich

                                                                                                                                   Berlin
                         Oslo

                                                       UK

                                                                                                                                                                        Belgium
                                                                                                                 Netherlands

                                                                                                                                                                Paris
                       Norway

                                                                    Seville

                                                                     Spain

                                                                                      Helsinki

                                                                                                                                Germany
                                                                 Barcelona

                                                                                                                                Frankfurt
                                                                                                   Switzerland

                                                                                                                                Hamburg

                                                                                                                                                                                   Milan
                                                                                                                 Amsterdam

                                                                                                                                                                        Brussels
                                                   London

                                                                                                                                Stuttgart

                                                                                                                                                              France

                                                                                                                                                                                    Italy
Source: Oxford Economics, Schroders. April 2018. For illustrative purposes only and should not be viewed as a recommendation to buy or sell.
The forecast should be regarded as illustrative of trends. Actual figures will differ from forecasts. Please refer to Important Information regarding forecasts

13
Exposure to higher GDP growth, winning centres
SEREIT portfolio located in highest growth regions of Western Europe
SEREIT’s Investment Universe SEREIT’s portfolio vs. Investment Universe
Outer ring shows SEREITs
direct exposure as a
% of value
15%
3%
19%
Inner ring
shows average
for investment 51%
universe
26%
85%
Fastest Growing Regions
Second Quartile
Third Quartile
Slowest Growing Regions
Source: Oxford Economics, Schroders. May 2018 -Total of 10 assets. Investment universe consisting of 845 NUTS3 regions in countries shown on map. Data based on Oxford Economics’ GDP growth
forecasts end-2017–end 2022 as at March 2018.
14European market fundamentals remain supportive
Key highlights
Economic sentiment in the EU & Eurozone Take-up, 12m rolling Totals, ‘000 sq m
100 = long-term average
12,000 Sweden
120 11,000
115 10,000 Robust Eurozone backdrop
110 9,000 Iberia
105
100 8,000
95 7,000 BeNeLux Ongoing recovery, strong
90 6,000
85 5,000 Italy sentiment and economic
80 4,000
75 3,000 growth
70 EU28 Eurozone 2,000 UK and
65 1,000 Ireland
60 0 France Unemployment falling –
strong growth in office
Jan-07
Jan-08
Jan-09
Jan-10
Jan-11
Jan-12
Jan-13
Jan-14
Jan-15
Jan-16
Jan-17
Jan-18
Jul-07
Jul-08
Jul-09
Jul-10
Jul-11
Jul-12
Jul-13
Jul-14
Jul-15
Jul-16
Jul-17
Germany
employment, increasing
Office completions & net additions
consumer spending
ILO-Unemployment rates (%) Office completions, million sq m Net-Additions (% of Stock)
14.0
Forecast 7 Forecast
3.5
Germany Supply level moderate with
12.0 6 3.0 low vacancy
France
10.0 5 2.5
Italy
Ongoing positive rental
4 2.0 growth forecasts
8.0
3 1.5 Spain
6.0
2 1.0
No threat from extreme
Benelux
4.0 levels of debt
1 0.5
Nordic
2.0
0 0.0 Yields low – but rational
2005 2007 2009 2011 2013 2015 2017 2019 2021
1993
1995
1997
1999
2001
2003
2005
2007
2009
2011
2013
2015
2017
2019
2021
Net Additions
Germany France Italy (lhs)
Netherlands Sweden
Source: European Commission, Oxford Economics, JLL, PMA, Schroders. May 2018.
Note forecasts should be regarded as illustrative of trends. Actual figures will differ from forecasts. See Important Information regarding forecasts.
Countries mentioned for illustrative purposes only and not a recommendation to buy or sell.
15Multiple investment opportunities
Deploying capital and growing in line with strategy
Opportunity Country Sector Pricing Yield Profile Comment
Logistics Warehouse 16,700 sqm facility let to a leading food
manufacturer expiring 2025. Located in
South west,
1 Status: In exclusivity. Signing Logistics €9m 6.8% Core industrial area 50kms from Geneva and
France
targetted June with completion 110km from Lyon. Rack rented at €40/sqm
August pa
Aubervilliers Good urban light industrial location to the
Paris district, Light
2 €13m 5.5% Core+ north of Paris, c. 1km from Stade de France.
France Industrial
Status: Final bids due end June Mixed use location including residential
Creteil Multi let office building located in the south
Paris district, east of Paris and considered to be an
3 Office €15m 5.75% Core+
Status: Under review France improving region with infrastructure
enhancements
Two light industrial assets located in and
Utrecht Utrecht, Light around Utrecht. Multi tenanted with a
4 €10m 6.9% Core+
Netherlands Industrial WAULB of c 8 years. Modern construction
Status: In exclusivity
having been developed in the last 10 years.
Venray Long leased freehold logistics investment
Venray/Venlo,
5 Logistics €10m 6.0% Core located in the Venray/Venlo region – the
Status: In exclusivity Netherlands
premier Dutch distribution location
Total c. €60m
Source: Schroders, June 2018. For illustrative purposes only and should not be viewed as a recommendation to buy or sell.
16Financial review
Financial highlights for 6 months to 31 March 2018
Real estate performance driving NAV and earnings growth
Interim profit grown by 157% to €10.8m
   – Driven by valuation uplift, growth in rental income and Hamburg surrender premium

NAV increased by 4.9% to €187.1m (139.9 cents per share)
  – NAV total return of 6.1%

EPRA earnings grown to €6.5m (4.8 cents per share)
  – Increase from 2.0 cents p.s. for 2017 interim period and 3.2 cents p.s. for 6 months ending 30 Sept 2017
  – Includes 1.4 cents per share in respect of surrender premium at Hamburg

Quarterly dividend of 1.85 cents p.a., achieving IPO dividend target of 5.5% yield on Euro IPO issue price
  – Total dividends in respect of interim period of 3.7 cents p.s., representing 68% increase on prior interim period
     and 23% increase on 6 months to 30 September 2018
  – Dividend fully covered from net income

Overall LTV of 28% at a weighted average interest rate of 1.3% and a weighted duration of c. 7 years

Approximately €45m of investment capacity (including debt) post Casino supermarket sale in July
Past performance is not a guide to future performance and may not be repeated.
Source: Schroders, June 2018 and www.XE.com
Source: Schroders, June 2018.

18
NAV movement for 6 months to 31 March 2018
6.1% NAV total return
€m cps Comments
NAV as at 1 October 2017 178.3 133.3
Transaction costs of investments (1.3) (1.0) Transaction costs for Apeldoorn investment
Largest movements were:
• Casino supermarkets: +€4.1m, reflecting the agreed sale
Unrealised gain in real estate valuation 6.2 4.7 price, due to complete at end of July;
• St. Cloud, Paris: +€1.3m from lease regearing and
strengthening market
Capital Expenditure (0.1) (0.1) Capex at Seville and St. Cloud
Includes €1.9m positive impact on net income from receipt of
part of the surrender premium at the Hamburg asset.
EPRA earnings 6.5 4.9
Underlying EPRA earnings increased as portfolio has grown.
Amortisation of finance costs, change in fair value of interest
Non-cash items (0.5) (0.4)
rate cap, deferred tax etc
Only the dividend in respect of the Jul – Sept 2017 period is
Dividends paid (2.0) (1.5) recognised in the NAV movement. The Oct – Dec 2017 dividend
of €2.5m was paid post period end in April 2018.
NAV as at 31 March 2018 187.1 139.9
Source: Schroders and www.xe.com. Numbers based on proportionally consolidated basis and therefore represent SEREITs share of joint ventures.
19Income statement
Acquisitions and asset management generating income growth
6 mths to 6 mths to 6 mths to
31 Mar 2018 (€m) 30 Sept 2017 (€m) 31 Mar 2017 (€m)
Net rental and related income 6.7 6.5 4.9
Surrender Premium 2.4 0.0 0.0
Total Fees and Expenses (1.7) (1.7) (1.9)
Net finance costs (0.4) (0.4) (0.3)
Tax (0.5) (0.1) (0.1)
Underlying EPRA earnings 6.5 4.3 2.6
Growth in annualised gross rental income
€million
€16.1m
15 €14.3m
€12.0m
12
9
6
3
0
31-Mar-17 30-Sep-17 31-Mar-18
Paris - Boulogne Berlin Hamburg Stuttgart Frankfurt Rennes / Biarritz Paris - St. Cloud Seville Apeldoorn
Past performance is not a guide to future performance and may not be repeated.
20 Source: Schroders. June 2018. Numbers based on proportionally consolidated basis and therefore represent SEREIT’s share of joint ventures.
For illustrative purposes only and should not be viewed as a recommendation to buy or sell.Fully covered dividend
New investments driving dividend increase
– Dividend of 1.85 Euro cents per share declared in respect of quarter Jan – Mar 2018
– IPO target achieved - Represents annualised Euro dividend yield of 5.5% on Euro equivalent IPO issue price1
– Converted at Eur:GBP FX rate as at 31 Mar 2018, dividend equates to annualised 6.5% yield on GBP IPO issue price
of 100 pps
– Dividend approximately 100% covered from recurring income from portfolio
– Excludes the impact of receipt of €2.4 million in respect of part of Hamburg surrender premium
– Including the Hamburg surrender premium receipt the dividend is 172% covered from net income
– Progressive dividend policy, sustainable from recurring income
– Dividends in respect of the 6 month interim period total 3.7 Euro cents per share
– Compares to dividends of 3.0 Euro cents p.s. for 6 months to 30 Sept 2017 and 2.2 Euro cents p.a. for 6 months to
31 March 2017
– In exclusivity and negotiation on new investments to replace lost Casino income post 31 July sale
– Casino supermarket disposal will decrease net income by approximately €1.7m p.a. from August onwards
– Dividends declared in Euro and payable in Euro, GBP or Rand (for South African investors)
Source: Schroders, June 2018. 1Yield based on the Euro equivalent of the issue price as at admission. This is a target only and there can be no guarantee that this target will be met.
21Debt financing
Current borrowing rates accretive to income returns
Loans summary as at 31 March 2018 Loans by country Loans by maturity
Loan Loan Amount LTV Maturity Interest Rate
Hamburg/Stuttgart €14.0m 48% June 2023 0.85% 16% 19%
42% 37%
Frankfurt / Berlin €16.5m 46% June 2026 1.31%
Casino Supermarkets €18.2m 45% July 2023 1.35%
42%
44%
Seville €11.7m 45% May 2024 1.76%
St. Cloud €13.0m 38% Dec 2024 1.30% France Germany Spain 2023 2024 2026
Total €73.4m 28%1 6.4 Years 1.31%
Debt strategy
– Portfolio gearing capped at 35% LTV; loans targeted against assets where most accretive and may be up to 50% LTV
– 100% of interest rate exposure either fixed or capped; borrowing rates expected to remain low in Europe
– New loan drawn against St.Cloud office in December 2017 at an interest rate of 1.30% to finance Apeldoorn acquisition
– Eight of the ten assets have gearing against them; one Paris office and the Apeldoorn office are currently ungeared
– Casino supermarket sale will result in buyer taking over SEREIT’s share of the associated loan; reduces SEREIT LTV to 23%
– Different loan maturities to spread refinance risk
– Likely to draw further debt against future acquisitions, taking gearing towards 35% LTV
1. LTV based on GAV of overall company. Source: Schroders, June 2018. Countries mentioned for illustrative purposes only and not a recommendation to buy or sell.
22Summary and outlook
The Company investing in European growth cities
Delivering investment performance; Well positioned for future growth

–    High quality c. €235m portfolio located in growth cities and regions across France, Germany, Netherlands and Spain

–    Strong income profile with over 97% occupancy and long term leases

–    Investment and asset management activities and strong market have delivered growth in profits

–    Annualised Euro dividend yield grown to 5.5% p.a. based on IPO issue price, driven by growth in net income

–    Low cost, long duration debt financing at 28% LTV – accretive to income return

–    Robust Eurozone economic backdrop; low unemployment and positive economic confidence

–    Investor and occupier activity in target markets remains strong; high rental growth

–    Megatrends (e.g. urbanisation, infrastructure investment) support long-term focus on growth cities

–    Identified pipeline of assets covering single assets and portfolios for reinvestment of sale proceeds, c.€45m

–    Targeting new investments to support growth ambitions and benefits such as diversification and liquidity

Source: Schroders, December 2017.

24
Schroder European Real Estate Investment Trust
Discrete yearly performance
                                                             Q1 2017–                 Q1 2016–   Q1 2015–   Q1 2014–          Q1 2013–
                                                             Q1 20184                 Q1 20174   Q1 20164   Q1 20154          Q1 20144

Share Price Total Return (GBP)1                                    7.1%                  3.3%          -           -                 -

NAV Total Return (Euro)2                                           9.8%                  2.1%          -           -                 -

NAV Total Return (converted to GBP)3                              13.4%                  9.4%          -           -                 -

Past performance is not a guide to future performance and may not be repeated. The value of investments and the income from them can
go down as well as up and you may not get back the amount originally invested.
¹Source: Schroders, Datastream, bid to bid price with net income reinvested in GBP.
²Source: Schroders, NAV to NAV (per share) plus dividends paid.
³Source: Schroders, NAV to NAV (per share) plus dividends paid. Converted into GBP.
4Performance data does not exist for periods before launch in December 2015.

Schroder European Real Estate Investment Trust – risk factors:

The trust may be concentrated in a limited number of geographical regions, industry sectors, markets and/or individual positions. This
may result in large changes in the value of the fund, both up or down, which may adversely impact the performance of the fund.

The Company may borrow money to invest in further investments, this is known as gearing. Gearing will increase returns if the value of
the assets purchased increase in value by more than the cost of borrowing, or reduce returns if they fail to do so.

The trust can be exposed to different currencies. Changes in foreign exchange rates could create losses.

The dividend yield is an estimate and is not guaranteed.

25
Appendices
Appendix 1 – Market research
Very strong Eurozone economic sentiment
Sentiment at mid-2007 peak levels and above long-term averages
Economic sentiment in the EU & Eurozone Economic Sentiment by country
100 = long-term average (Seasonally Adjusted Data) Index. 100 = long-term average
120 125
115
110 120
105
115
100
95 110
90
85 105
80
100
75
70
95
65 EU28 Eurozone
60 90
Jan-11
Jan-12
Jan-07
Jan-08
Jan-09
Jan-10
Jan-13
Jan-14
Jan-15
Jan-16
Jan-17
Jan-18
Slowakia
Malta
Lithuania
Austria
Bulgaria
France
Spain
Greece
Eurozone
EU
Hungary
Netherlands
Germany
Finland
Sweden
Italy
Latvia
Croatia
Slovenia
Czech Rep
Estonia
UK
Cyprus
Belgium
Denmark
Portugal
Poland
Luxembourg
Romania
Source: European Commission, Schroders, April 2018– last reading Mid-March 2018
For illustrative purposes only and should not be viewed as a recommendation to buy or sell.
28Labour markets continue to recover
Unemployment falling – strong growth in office employment
Office employment: Forecast growth in absolute ILO-Unemployment rates (%)2
employment between end-2017 to end-20221
Luxembourg 14.0
Stockholm
Berlin
Oslo
12.0
Amsterdam
Cologne
Frankfurt
Madrid 10.0
Lyon
Hamburg
Munich
Copenhagen 8.0
Paris
Lisbon
Stuttgart 6.0
Dusseldorf
Milan
Manchester
Rotterdam 4.0
Vienna
Barcelona
Brussels
2.0
Helsinki
2005
2006
2007
2008
2009
2010
2011
2012
2013
2014
2015
2016
2017
2018
2019
2020
2021
2022
London
0.0% 2.5% 5.0% 7.5% 10.0% 12.5% 15.0% 17.5% 20.0% Germany France Italy Netherlands Sweden
1Source:PMA, Schroders. April 2018. 2Source: Oxford Economics, Schroders. April 2018
The forecast should be regarded as illustrative of trends. Actual figures will differ from forecasts. Please see the information slide at the end of this presentation.
29European occupier activity remains high
Broad based occupier demand
Take-up, 12m tolling Totals, ‘000 sq m
12,000
11,000
10,000 Sweden
9,000
Iberia
8,000
BeNeLux
7,000
6,000 Italy
5,000
UK and Ireland
4,000
France
3,000
2,000 Germany
1,000
0
Source: JLL, Schroders. April 2018. Country figures based on major markets. For illustrative purposes only and should not be viewed as a recommendation to buy or sell.
30Office development remains subdued
Building activity supportive of rental growth
Office completions,
million square metres Net-Additions (% of Stock)
7 Forecast
3.5
6 3.0
5 2.5
4 2.0
3 1.5
2 1.0
1 0.5
0 0.0
2020
1993
1994
1995
1996
1997
1998
1999
2000
2001
2002
2003
2004
2005
2006
2007
2008
2009
2010
2011
2012
2013
2014
2015
2016
2017
2018
2019
2021
2022
Germany France Italy Spain Benelux Nordic Net Additions (lhs)
Source: PMA, Schroders. April 2018. Net-Additions for Europe ex. UK . Country figures based on major markets. For illustrative purposes only and should not be viewed as a recommendation to buy
or sell. Note forecasts should be regarded as illustrative of trends. Actual figures will differ from forecasts. See Important Information regarding forecasts.
31Modern Grade A office space remains scarce
Lack of new, grade A space creates opportunity for refurbishments
14
Vacancy as % of overall stock Q1 2018
12
10
8
6
4
2
0
Hamburg
Munich
Edinburgh
Berlin
Frankfurt/M
The Hague
Lyon*
Dublin
Brussels*
Glasgow
Utrecht
London City
Paris*
Milan
London WE
Luxembourg*
Madrid**
Dusseldorf
Barcelona**
Amsterdam
Rotterdam
Manchester
Vacancy Rate Grade A Vacancy Rate
Source: JLL, May 2018
*Paris, Brussels, Luxembourg and Lyon based on vacancy in newly completed stock
**Barcelona and Madrid estimated
For illustrative purposes only and should not be viewed as a recommendation to buy or sell.
32Appendix 2 – Portfolio information
SEREIT portfolio
Paris office investment – Boulogne Billancourt
Opportunity Fully let office building with reversion potential
Location Jean Jaurès 221, 92100 Boulogne Billancourt (Paris), France
Tenure Freehold – co-ownership
Asset Description Established market in Paris’ Western Crescent
Good location within Boulogne-Billancourt
Metro line 9 and Paris ring road nearby
Built in 1989, flexible T-shaped floor plates (ca. 800 sqm)
100%-let to ALTEN, a technology consulting and engineering company
until 31 March 2021
WAULT 3.1 years (from 1/4/2018) and 3.1 years to break
Pricing €37.5m / NIY 5.7% / €5,522 psm
Current Value €42.1m as at 31 March 2018
Investment Medium duration lease term with a strong covenant tenant present in
Rationale the building since 1998 – provides time to consider refurbishment
Conservative rent level (€312 / ‘office’ sqm/pa) offering a good
alternative to La Défense in a more attractive environment
Area where people live and work; supply constrained
Boulogne-Billancourt is an established market (1.2m sqm of office
stock, the second largest market in the Western Crescent) with average
take-up over 100,000 sqm/pa
Potential to create value and significant reversion potential (c. 30%) by
redeveloping the property at lease expiry
Source: Schroders, June 2018. Maps – http://maps.stamen.com. For illustrative purposes only and should not be viewed as a recommendation to buy or sell.
34SEREIT portfolio
Berlin retail warehouse investment – Mariendorf
Opportunity Long let retail warehouse in a growing Berlin region
Location Großebeerenstraße 30, 12107 Berlin, Germany
Tenure Freehold
Asset Description DIY retail unit in Mariendorf, 10 km south of Berlin City Centre
Asset comprises 3 parts: a DIY unit, a garden centre and a trade counter, let to
Hornbach, with a total lettable area of 16,800 sqm
Urban location, surrounded by medium density residential and commercial
accommodation. A separately owned Aldi supermarket adjoins the site; small
potential residential site within ownership
Large site of over 4 hectares
Let to Hornbach Baumarkt AG until 2026
WAULT 7.8 years (from 1/4/2018) and 7.8 years to break
Pricing €24.25m / NIY 6.2% / €1,443 psm
Current Value €26.0m as at 31 March 2018
Investment Characteristics consistent with our house view of targeting institutional grade
Rationale real estate in growth cities
Hornbach Baumarkt is the one of the strongest DIY operators in Germany;
sector has witnessed some consolidation
Long income stream in defensive segment at an attractive cash yield
Land value is relatively high (c. 20-30% of value) underpinning residual value
Potential for residential conversion in the long run
Small residential site at the rear; opportunity to redevelop
Exploring potential to acquire Aldi supermarket alongside
35 Source: Schroders, June 2018. Maps – http://maps.stamen.com. For illustrative purposes only and should not be viewed as a recommendation to buy or sell.SEREIT portfolio
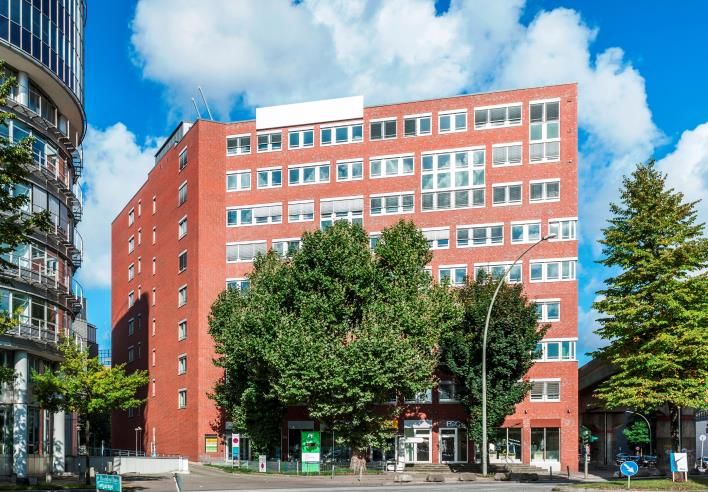
Hamburg office investment
Opportunity Fully let, multi tenanted office property on the edge Hamburg CBD
Location Hammerbrookstraße 94, 20097 Hamburg, Germany
Tenure Freehold
Asset Description Core office investment in Hamburg’s Centre South office sub-market. This
area continues to improve through new retail, residential and office
development; mixed use location
Good micro location, alongside public transport and main arterial roads.
Hammerbrook S-Bahn station (lines S3 & S31) located within 250m, one
stop to central station
Varied office sub-market, catering for private and public sector occupiers.
Increasingly become a back office location; rents at 50% discount to CBD
Modern asset built in 2005. Ground floor retail with strong convenience
offer with office space above
WAULT 2.8 years (from 1/4/2018) and 2.8 years to break
Pricing €14.4m / NIY 6.9% / €2,063 psm
Current Value €16.0m as at 31 March 2018
Investment Sub market is improving and increasingly becoming a place where
Rationale people want to live and work
Highly liquid lot size that appeals to both institutional and private
investors
High yielding investment with favourable unexpired lease term and an
acquisition price in line with replacement cost
Opportunity to re-gear head lease with BKK
Source: Schroders, June 2018. Maps – http://maps.stamen.com. For illustrative purposes only and should not be viewed as a recommendation to buy or sell.
36SEREIT portfolio
Stuttgart office investment
Opportunity Fully let, core office investment anchored by Government tenant
Location Neckarstrasse 121, 70190 Stuttgart, Germany
Tenure Freehold
Asset Description Core office investment centrally located in Stuttgart, the political, economic
and cultural centre of Baden-Württemberg, Germany’s third largest state by
population
Strong micro location close to central station and Schlossgarten park. The
sub-market has a range of government occupiers including various courts of
justice and ministries
Originally constructed in 1960 and comprehensively refurbished in 2005 with
a total lettable area of 5,832 sqm and parking for 71 cars
Efficient floor plate of c. 750 sqm, divisible in two for either cellular or open-
plan offices. Good specification.
Currently 100% occupied with the main tenant being the Federal State of
Baden-Württemberg (81%) with a lease expiry in July 2026
WAULT 7.6 years (from 1/4/2018) and 7.3 years to break
Pricing €14.4m / NIY 5.0% / €2,478 psm
Current Value €15.6m as at 31 March 2018
Investment Characteristics consistent with our house view of targeting institutional grade
Rationale real estate in growth cities
Stuttgart is one of Germany’s top 7 office markets; very low vacancy
Excellent covenant strength providing long term, secure cash yield
Highly liquid lot size that appeals to both institutional and private investors
Source: Schroders, June 2018. Maps – http://maps.stamen.com. For illustrative purposes only and should not be viewed as a recommendation to buy or sell.
37SEREIT portfolio
Frankfurt retail investment
Opportunity Multi let convenience retail centre anchored by Lidl supermarket, located
in a growing urban area of Frankfurt am Main
Location Lorscher Straße 41, 60489 Frankfurt/Rödelheim, Germany
Tenure Freehold
Asset Description Fully let, multi tenanedt convenience retail centre located in Rödelheim;
a growing suburb of Frankfurt am Main with good transport
connections and visibility to main highway
Built 2004 and modernised in 2015 to a high specification
4,525 sqm total rental space with more than 350 parking spaces. 1,600
sqm Lidl supermarket is considered to be the ideal size for new style
convenience/small basket retailing
All retail units have dedicated, secure delivery areas
Site area 8,097 sqm
WAULT 6.3 years (from 1/4/2018) and 6.3 years to break
Pricing €11.05m / NIY 5.6% / €2,478 psm
Current Value €11.45m as at 31 March 2018
Investment Well located, high quality building, catering for demand for
Rationale grocery/convenience stores from locals and commuters
Fully let with opportunity to change tenant mix and increase rental
income over the medium term
Income underpinned by c.11 year unexpired lease term with main
tenant Lidl
Plan to introduce drug store to improve footfall
Source: Schroders, June 2018. Maps – http://maps.stamen.com. For illustrative purposes only and should not be viewed as a recommendation to buy or sell.
38SEREIT portfolio
Paris (Saint Cloud) office investment
Opportunity Best premises in a large office complex at an extremely attractive price
Location Saint-Cloud, an upscale suburban city bordering Paris
Tenure / Built Freehold in a co-ownership / Built in the 1970s, well maintained since
Asset Description Ca. 15,800 sqm of office and storage areas located in ‘Les Bureaux de la Paris
Colline’, a well maintained 65,000-sqm office complex;
Entire building E and the four highest floors in building D i.e. the best
premises in the complex: located near the main entrance with the best views
of Paris and over Parc de Saint-Cloud;
Office area 100% let to 12 tenants with very high historical occupancy ratio (>
90%) at a defensive average rent of €215/sqm/year, but with high service
charges;
Office floor areas range from 700 to 1,500 sqm;
Very good accessibility to the property by car (A13 in front of the building)
and good accessibility using public transport (tramway, metro and bus
stations nearby). Premises includes 303 car spaces
WAULT 5.0 years (from 1/4/2018) and 1.7 years to break
Pricing c. €30m i.e. €1,959/sqm and 9.5% NIY
Current Value €35.2m as at 31 March 2018
Investment Acquisition at a discount to conservative estimate of intrinsic / long term
Rationale value given special situation (sale before year end)
5 largest tenants of good covenant account for 70%+ of rental income;
Largest shareholding stake in the co-ownership by far (22.4%).
Source: Schroders, June 2018. Maps – http://maps.stamen.com. For illustrative purposes only and should not be viewed as a recommendation to buy or sell.
39SEREIT portfolio
Metromar Shopping Centre - Seville
Opportunity Spanish recovery play via the acquisition of a dominant urban shopping centre
located in one of the fastest growing and most affluent suburbs of Seville,
Spain’s fourth largest city
Location Located in the south western Seville suburb of Mairena del Aljarafe. The centre
Central Seville
benefits from easy car access and is well serviced by public transport with
frontage to the only line that services this part of Seville with the city centre,
making the area a key growth corridor
Tenure / Built Freehold. Constructed in 2006 and acquired by UBS for €104m in 2007
Asset Description Urban shopping centre totalling 23,506 sqm servicing a catchment of 250,000
people within 15 minutes
Strong tenant mix centred on grocery, fashion (50%) and leisure. Recognised
as the fashion destination for its catchment and surrounding towns. Key
fashion brands include H&M, Mango and the majority of Inditex brands (Zara,
Bershka et al)
Strong like for like sales growth; +8% in 2015 and +4% in 2016 and a annual
footfall of c. 4 million. Reasonable rent/TO ratios
Good income diversification with over 50 occupiers
2,787 sqm of vacancy providing for upside potential
WAULT 7.6 years (from 1/4/2018) and 3.2 years to break
Pricing €25.5m and 6.2% NIY (50% interest)
Current Value €26.0m as at 31 March 2018
Investment Spain is in its early stages of recovery. Retail is expected to be a key
Rationale beneficiary of improved economic and consumer sentiment
Established and dominant centre within its trade area offering scope for
income growth potential
40 Source: Schroders, June 2018. Maps – http://maps.stamen.com. For illustrative purposes only and should not be viewed as a recommendation to buy or sell.SEREIT portfolio
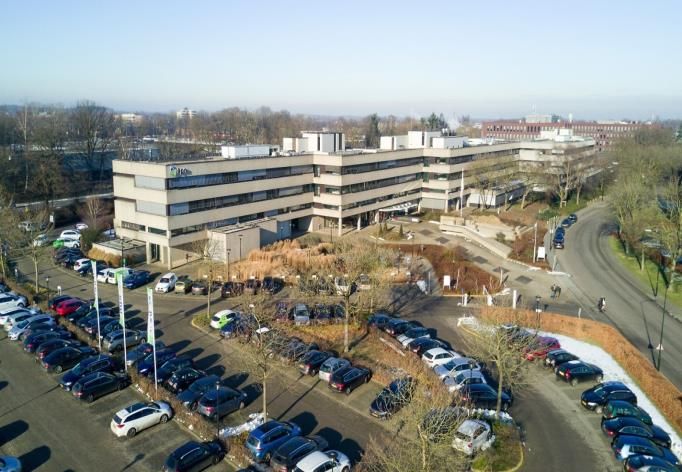
Data centre / office investment, Netherlands
Opportunity Opportunity to acquire a freehold office / data centre in Apeldoorn (NL), fully
leased to KPN till Dec ‘26, the largest telecom/IT service provider in the
Netherlands. Attractive yield and purchase price at a significant discount to
replacement cost
A-50
Location Apeldoorn (pop. c. 160k) is located in the centre of the Netherlands with good
infrastructure links to both the north/south (via the A-50) and the east/west
(via the A-1). Amsterdam is within an hour drive. The city is an important ICT Apeldoorn
employment centres in the Netherlands, catering for over 6,500 jobs in the
sector and growing
Tenure / Built Freehold – Constructed in stages between 1975-85. Renovated 2006, 2016 A-1
Asset Description 23,700sqm of GLA (56% office, 22% dataroom, 23% storage) across four
floors + basement.
Site area of 35,731sqm with 495 on site parking spaces (1:48sqm)
Strategic location for KPN – 1 of 10 locations for key data centres
Average rent of €101/sqm – discount to Apeldoorn prime
WAULT 8.8 years (from 1/4/2018) and 8.8 years to break
Pricing €19.8m / 9.9% NIY and €835/sqm
Investment Attractive inflation linked 9 year income stream, strong covenant
Rationale Good location: central Netherlands and at the intersection of the A-1 and
A-50, with strong alternate use potential
Apeldoorn expected to be a beneficiary of the trend of the relocation of
back-office functions (particularly ITC) to secondary cities (rents currently
stand at c. 30% of Amsterdam rents)
41 Source: Schroders, June 2018. Maps – http://maps.stamen.com. For illustrative purposes only and not a recommendation to buy or sellAppendix 3 – Financial information
Summary balance sheet
Simple balance sheet with low leverage

                                                                                        As at 31 Mar 2018 (€m)               As at 30 Sept 2017 (€m)
 Investment properties                                                                                              237.0                       211.6
 Cash                                                                                                                 24.9                        27.2
 External third-party loans                                                                                         (73.4)                      (60.4)
 Net current liabilities                                                                                             (1.4)                       (0.1)
 NAV                                                                                                               187.1                       178.3
 NAV per share €/£*                                                                                        €1.399 / £1.23              €1.333 / £1.18

Impact of sale of Casino supermarkets
–    Sale of Casino supermarket investments at the end of July will result in:
     – Reduction in property portfolio of €44.8m
     – Increase in net cash balance of €27.9m
     – Reduction in net debt balance of €18.2m

–    Resulting new investment capacity will be €45m - €50m, including debt

Source: Schroders. For illustrative purposes only and should not be viewed as a recommendation to buy or sell.
Numbers based on proportionally consolidated basis and therefore represent SEREITs share of joint ventures.
*FX rate of £1 : €1.138 as at 31 March 2018 (FX Rate: 30 Sept 2017 £ : €1.134) Source:www.xe.com.

43
Statement of comprehensive income
6 months to 6 months to
Period
31 Mar 2018 (€m) 31 Mar 2017 (€m)
Rental income 10.3 7.4
Other income (surrender premium) 2.4
Property operating expenses (3.9) (2.0)
Net rental and related income 8.8 5.4
Net valuation profit on investment property 6.4 1.6
Net change in fair value of financial instruments 0.0 0.2
Expenses (1.6) (1.9)
Finance costs – net interest payments (0.1) (0.5)
Share of profit / (loss) on joint venture 0.3 0.0
Profit before tax 13.7 4.8
Income Taxation (0.8) 0.2
Profit after tax 12.9 4.6
Attributable to owners 10.8 4.2
Non-controlling interests 2.1 0.4
Source: Schroders as at June 2018
44Underlying EPRA earnings
6 months to 6 months to
Period
31 Mar 2018 (€m) 31 Mar 2017 (€m)
Profit after tax 12.9 4.7
Excluding:
Net valuation profit / loss on investment property (6.4) (1.6)
Share of Joint Venture loss on investment property (0.2)
Deferred tax 0.4
Adjustment for Minority Interests net revenue (0.4) (0.4)
Finance costs – interest rate cap 0.1 (0.2)
EPRA earnings 6.4 2.5
Weighted average number of shares 133,734,686 131,811,609
Underlying EPRA earnings per share (pence) 4.8 1.9
Earnings excluding property revaluations, gains on disposals, deferred tax, derivative adjustments, and minority interests
Source: Schroders, June 2018.
45Schroder European Real Estate Investment Trust Plc
Discrete yearly performance
Q4 2016– Q4 2015– Q4 2014– Q4 2013– Q4 2012–
Q4 2017 Q4 2016 Q4 2015 Q4 2014 Q4 2013
Share Price Total Return (GBP)¹ +4.1 0.8 - - -
NAV Total Return (Euro) ² +7.3 -0.3 - - -
NAV Total Return (converted to GBP) ³ 11.7 15.4 - - -
Past performance is not a guide to future performance and may not be repeated. The value of investments and the income from them may go down as well as up
and investors may not get back the amounts originally invested.
¹ Source: Schroders, Datastream, bid to bid price with net income reinvested in GBP.
² Source: Schroders, NAV to NAV (per share) plus dividends paid.
³ Source: Schroders, NAV to NAV (per share) plus dividends paid. Converted into GBP.
Risk Factors:
– The trust may be concentrated in a limited number of geographical regions, industry sectors, markets and/or individual positions. This may result in large
changes in the value of the fund, both up or down, which may adversely impact the performance of the fund.
– The Company may borrow money to invest in further investments, this is known as gearing. Gearing will increase returns if the value of the assets purchased
increase in value by more than the cost of borrowing, or reduce returns if they fail to do so.
– The trust can be exposed to different currencies. Changes in foreign exchange rates could create losses.
– The dividend yield is an estimate and is not guaranteed.
46Important information For professional investors or advisers only. This material is not suitable for retail clients. Past performance is not a guide to future performance and may not be repeated. The value of investments and the income from them may go down as well as up and investors may not get back the amount originally invested. Schroders has expressed its own views and these may change. The data contained in this document has been sourced by Schroders and should be independently verified before further publication or use. This presentation is intended to be for information purposes only. The material is not intended as an offer or solicitation for the purchase or sale of any financial instrument. The information provided is not intended to constitute investment advice, an investment recommendation or investment research and does not take into account specific circumstances of any recipient. The material is not intended to provide, and should not be relied on for, accounting, legal or tax advice. Information herein is believed to be reliable but Schroder Unit Trusts Limited (Schroders) does not warrant its completeness or accuracy. No responsibility can be accepted for error of fact or opinion. Reliance should not be placed on the views and information in the document when taking individual investment and/or strategic decisions. Risk factors: The forecasts included in this document should not be relied upon, are not guaranteed and are provided only as at the date of issue. Our forecasts are based on our own assumptions which may change. We accept no responsibility for any errors of fact or opinion and assume no obligation to provide you with any changes to our assumptions or forecasts. Forecasts and assumptions may be affected by external economic or other factors. The trust may be concentrated in a limited number of geographical regions, industry sectors, markets and/or individual positions. This may result in large changes in the value of the fund, both up or down, which may adversely impact the performance of the fund. The Company may borrow money to invest in further investments, this is known as gearing. Gearing will increase returns if the value of the assets purchased increase in value by more than the cost of borrowing, or reduce returns if they fail to do so. The trust can be exposed to different currencies. Changes in foreign exchange rates could create losses. The dividend yield is an estimate and is not guaranteed. Issued in June 2018 by Schroder Unit Trusts Limited, 31 Gresham Street, London EC2V 7QA. Registered No: 4191730 England. Authorised and regulated by the Financial Conduct Authority. UK12914 47
Contact
Schroder Investment Management Limited,
31 Gresham Street, London EC2V 7QA.

schroders.com
You can also read