Scientific Visualization on the Cloud: the NEANIAS Services towards EOSC Integration - Springer
←
→
Page content transcription
If your browser does not render page correctly, please read the page content below
Journal of Grid Computing (2022) 20: 7
https://doi.org/10.1007/s10723-022-09598-y

Scientific Visualization on the Cloud: the NEANIAS
Services towards EOSC Integration
Eva Sciacca · Mel Krokos · Cristobal Bordiu · Carlos Brandt · Fabio Vitello ·
Filomena Bufano · Ugo Becciani · Mario Raciti · Giuseppe Tudisco ·
Simone Riggi · Eugenio Topa · Sami Azzi · Benjamin Kyd · Simone Mantovani ·
Laura Vettorello · Jiacheng Tan · Josep Quintana · Ricard Campos · Noela Pina

Received: 7 July 2021 / Accepted: 11 January 2022
© The Author(s) 2022, corrected publication 2022

Abstract NEANIAS is a research and innovation                We present the overall NEANIAS ecosystem archi-
action project funded by the European Union under            tecture, with an emphasis on its core visualization
the Horizon 2020 program. The project addresses              services, detailing their specifications and software
the challenge of prototyping novel solutions for the         development plan, and focusing on the underpinning
underwater, atmospheric and space research commu-            service-oriented architecture for their delivery. We
nities, creating a collaborative research ecosystem,         report on the underlying ideas and guiding princi-
and contributing to the effective materialization of         ples for designing such visualization services, out-
the European Open Science Cloud (EOSC). NEA-                 lining their current release status and future devel-
NIAS drives the co-design, implementation, delivery,         opment roadmaps towards Technological Readiness
and integration into EOSC of innovative thematic             Level (TRL) 8 maturity and EOSC integration.
and core services, derived from state-of-the-art assets
and practices in the target scientific communities.          Keywords Scientific visualization · Cloud services ·
                                                             Service oriented architectures · Big data · European
                                                             Open Science Cloud (EOSC)
The research leading to these results has received funding
from the European Commission’s Horizon 2020 research
and innovation programme under the grant agreement No.
863448 (NEANIAS).
                                                             E. Topa
E. Sciacca () · C. Bordiu · F. Bufano · U. Becciani · M.    ALTEC Spa, C.so Marche 79, 10146 Torino, Italy
Raciti · G. Tudisco · S. Riggi
INAF, Catania Astrophysical Observatory, Via S Sofia 78,     J. Tan
95123 Catania, Italy                                         School of Computing, University of Portsmouth,
e-mail: eva.sciacca@inaf.it                                  Buckingham Building, Portsmouth PO1 3HE, UK
F. Vitello
INAF, Institute of Radioastronomy, Via Gobetti 101,          S. Mantovani · L. Vettorello
40129 Bologna, Italy                                         MEEO S.r.l., Corso Ercole I d’Este 6/A - 44121
                                                             Ferrara, Italy
M. Krokos · B. Kyd · S. Azzi
School of Creative Technologies, University of Portsmouth,   J. Quintana · R. Campos
Eldon Building, Portsmouth PO1 2DJ, UK                       CORONIS Computing S.L., Carrer Pic de Peguera 11,
                                                             17003 Girona, Spain
C. Brandt
                                                             N. Pina
Jacobs University Bremen, gGmbH Campus Ring 1,
                                                             Ubiwhere Lda, Coimbra, Portugal
28759 Bremen, Germany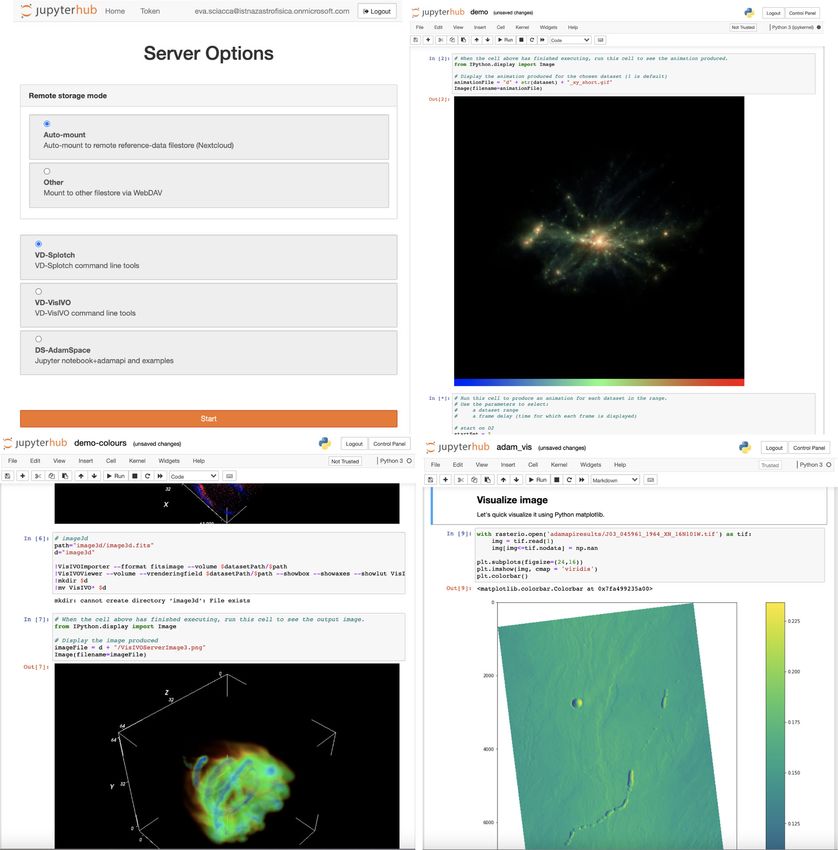
7 Page 2 of 18                                                                               J Grid Computing (2022) 20: 7

1 Introduction                                                   are built upon a comprehensive collection of reusable
                                                                 core services, designed to tackle fundamental techni-
The European Cloud initiative1 aims at providing sci-            cal or market-oriented data life cycle tasks. Due to
ence, industry and public authorities with world-class           their agnostic nature, utilization of such core services
infrastructures for big data storing, managing, trans-           extends well beyond the initial scope of NEANIAS
porting and processing, in the expectation of signifi-           for exploitation by other research communities in
cantly streamlining exploitation of open science prac-           academia and industry, as well as public authority bo-
tices.2 The initiative is built around two main pillars:         dies. This article describes the overall architecture,
the European Open Science Cloud (EOSC)3 which is                 specifications and software development plan of
a virtual environment for handling the large volumes             NEANIAS, describing thematic and core services and
of information generated by the big data revolution;             release status focusing on visualization.
and the European Data Infrastructure (EDI),4 which                  The paper organisation is as follows. Section 2 out-
underpins EOSC through the deployment of high-                   lines the main challenges of scientific visualization in
bandwidth networks and supercomputing resources,                 the underwater, atmospheric and space research sec-
enabling the access and processing of big data vol-              tors. Section 3 refers to the related works. The overall
umes in the Cloud.                                               architecture of the NEANIAS ecosystem is described
   The EOSC roadmap5 foresees the seamless feder-                in Section 4, where we discuss concepts relating to
ation of existing and future research data infrastruc-           the service-oriented architecture, REST10 (REpresen-
tures, as well as other large-scale scientific networks          tational State Transfer) paradigm, standards and inter-
and initiatives. Its vision envisages the adoption of a          operability, as well as logical architecture and generic
common policy framework to enable FAIR6 (i.e. Find-              service processing lifecycles. Section 5 focuses on
able, Accessible, Interoperable and Reusable) data to            core visualization services, summarising the tech-
be used and shared throughout the entire value chain             nologies adopted and including possible dependencies
for scientific, societal and industrial purposes. The            with other core services. The service delivery model is
NEANIAS7 project emerges in this context as an                   outlined in Section 6 discussing also services evalua-
ambitious research and innovation action specifically            tion. Section 7 outlines the current release status. We
addressing the prototyping of new innovative ser-                conclude with a summary of the work carried out so
vices8 for underwater, atmospheric and space research            far and brief insights into future developments.
thematic sectors. Starting from TRL 6 software solu-
tions, the project is developing, validating, delivering,
and maturing into TRL 8 a portfolio of cutting-edge              2 Scientific Visualization Challenges
thematic services9 for EOSC onboarding to fill current
research gaps and needs, engaging user communities               Visualization plays a fundamental role in almost every
and identifying novel business cases and opportuni-              scientific discipline facilitating qualitative and quan-
ties. Although there are evident differences among               titative data analysis, for new knowledge generation
the NEANIAS scientific sectors, its thematic services            and effective communication of end results. Suitable
                                                                 tools and approaches can boost scientific productivity
                                                                 significantly, e.g., by revealing hidden trends or intrin-
1 https://ec.europa.eu/digital-single-market/en/cloud
                                                                 sic patterns in the data, leading to fresh insights and
2 https://www.openaire.eu
                                                                 eventually, new scientific discoveries.
3 https://www.eosc-portal.eu
                                                                     The big data revolution is providing enormously
4 https://eudat.eu
                                                                 large, incredibly rich, and highly complex data vol-
5 https://ec.europa.eu/research/openscience/pdf/eosc strategic   umes that impose extremely challenging demands on
implementation roadmap short.pdf
6 https://ec.europa.eu/info/sites/info/files/turning fair into
                                                                 traditional visualization approaches (see e.g. [9, 14]).
reality 0.pdf                                                    The demands to address are efficiency, i.e. the abil-
7 https://www.neanias.eu/                                        ity to handle rapidly the underlying data complexity,
8 https://eosc-portal.eu/infraeosc-02-2019-prototyping-new-

innovative-services
9 https://catalogue.neanias.eu                                   10 https://restfulapi.net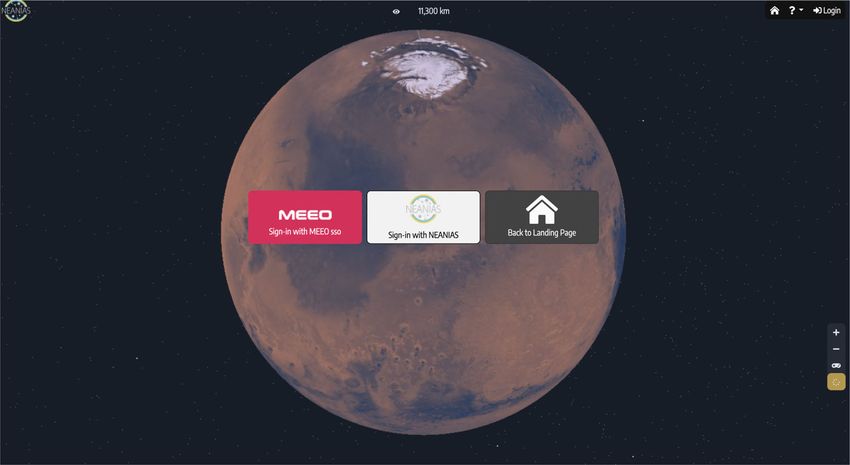
J Grid Computing (2022) 20: 7                                                                         Page 3 of 18   7

and intuition, i.e. the ability to reach suitable inter-      provide specific tools for generating large hierarchical
pretation by domain experts. The cluster of core visu-        tiled data structures for imaging and bathymetric maps
alization services being developed in NEANIAS (see            (see Section 5.1.3). We adapt state-of-the-art simpli-
Section 5) is founded firmly on these guiding prin-           fication approaches to efficiently work at tile level,
ciples to underpin a portfolio of thematic services11         for highly parallelizable rendering paying attention on
which are tailored to specific community challenges           ensuring 3D tile continuity in their hierarchy within
in the underwater, atmospheric and space research             the same level of detail.
sectors, as outlined below.
                                                              2.2 Atmospheric Services Technical Challenges
2.1 Underwater Services Technical Challenges
                                                              The atmospheric community includes a multitude of
The underwater community is multidisciplinary,                stakeholders e.g., urban air quality authorities that
encompassing among others archaeologists, environ-            monitor the concentration of gases and small particles
mental scientists, marine geologists, industrial energy       in the air, geologists who track gas fluxes from active
planners and engineers. The challenge is to deploy            faults or volcanoes and meteorologists who monitor
appropriately topographical and geological informa-           the evolution of physical variables to provide weather
tion of the seafloor for a variety of purposes e.g. as        forecasts. Such stakeholders are facing diverse chal-
diverse as marine habitat mapping, biodiversity stud-         lenges, e.g. in visualising and forecasting spatial
ies, tectonic plate analysis and fault detection, finding     distribution of pollution concentrations within urban
and protecting archaeological sites or even oil pipeline      areas. Typically, such concentrations are monitored
planning. The data context is underpinned by the              through local air quality stations, however, the in-situ
rapid growth of underwater mapping sensors which              measurements can only give information of pollutants
enables retrieving the shape of the Earth’s seafloor          for specific areas of measurements. Air quality mod-
at unprecedented levels of fidelity. Computationally-         elling methodologies are then essential, albeit very
efficient visualization of such datasets is needed for        challenging as concentration levels of atmospheric
underwater communities, by generating world-scale             pollutants arise as a result of local contributions (i.e.
multi-resolution triangulated irregular networks opti-        from specific emission sources) and include additional
mized for web-based visualization [6].                        background pollutant concentrations transported from
    The idea is to transmit the data and defer visualiza-     surrounding regions. The spatial distribution of the
tion on the user’s end, where the graphical hardware          emissions induced by local sources, especially road
of the client can be used focusing on striking a bal-         traffic, also depends on the wind conditions due to
ance between the amount of data transfers and efforts         buildings and urban canyon structures.
required for rendering. Then, level of detail tech-              The challenge is then to define spatial resolution
niques, able to change the complexity of the displayed        modelling approaches striking an appropriate bal-
data based on the point of view desired by the end user,      ance between the availability of input data with high
are suitable for deployment to focus on rendering the         detail and the ability to visualize pollutant concen-
part of the world falling in the user’s frustum with a        trations at a spatial resolution sufficient for urban
complexity that adapts to the distance from viewers.          air quality planning [7]. The underlying modelling
Although bathymetry can be visualized as raster 2D            system needs to take into account local emissions
maps, it provides information about the 3D relief of          modelling, weather predictions and urban air quality
the seafloor, and as such it is better interpreted via rich   modelling that includes local scale effects and trans-
3D visualizations. Transferring and visualizing 3D            port of pollutants from long distances. To address
data however is more involved since instead of images         such challenges, NEANIAS provides to the atmo-
triangle meshes are to be rendered. To cope with these        spheric community cloud services for high resolution
challenges, the NEANIAS visualization core services           mapping of pollutant concentrations on specific areas
                                                              (see Section 5.4). These services also provide weather
                                                              forecasts, enabling to visualise within pollution maps
                                                              several relevant parameters, e.g. temperatures and
11 https://docs.neanias.eu/en/latest/                         precipitations.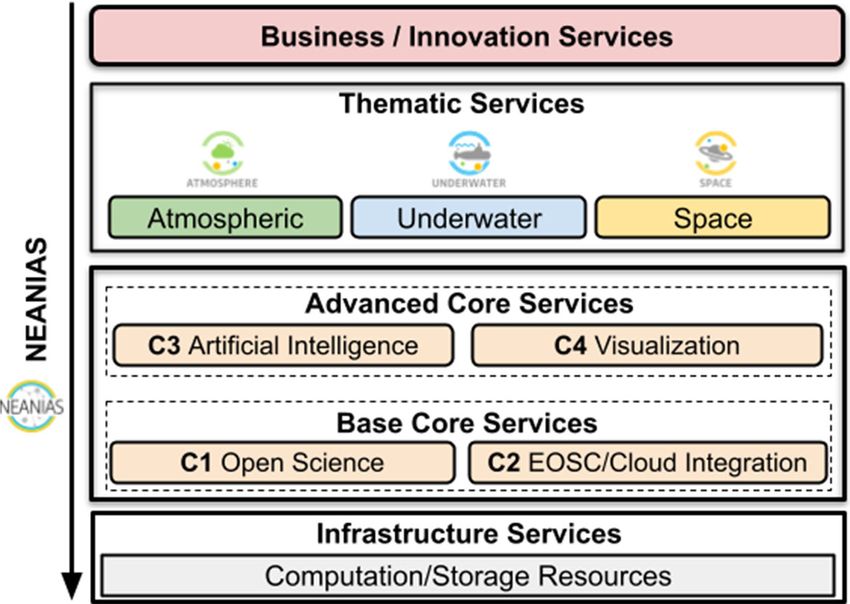
7 Page 4 of 18                                                                            J Grid Computing (2022) 20: 7

2.3 Space Services Technical Challenges                   survey of the European astrophysics community [4].
                                                          The demand for scalability arises from the contin-
The space community includes astrophysicists and          uously increasing size of datasets as efficient visu-
planetary scientists, who are facing a data explosion     alization mechanisms are impractical with standard
revolution fuelled by an increasing number of plan-       hardware, unless novel rendering strategies exploit-
etary exploration missions (e.g., the Perseverance12      ing next generation infrastructures are designed and
rover on Mars) and the upcoming deployment of new         deployed. Recent developments, e.g. CARTA,18 rely
state of the art observing facilities (e.g., the Square   on client-server architectures, in an attempt to allevi-
Kilometre Array - SKA,13 the Vera C. Rubin Observa-       ate this performance bottleneck, paving the ground for
tory,14 or the James Webb Space Telescope - JWST15 ).     successfully handling large data volumes from SKA
These instruments are expected to produce over-           and its pathfinders.
whelming amounts of data volumes, by mapping solar           To cope with these challenges, the NEANIAS
system bodies with an unprecedented detail, or per-       visualization core services provide tailored and scal-
forming new all-sky surveys with unparalleled sensi-      able visual discovery workflows to be exploited by
tivity and angular resolution [20]. Visual exploration    the Space Thematic Services, in order to meet the
and discovery mechanisms can be instrumental in           demands of the astrophysics community for advanced
dealing efficiently with this avalanche of large-scale    visual analytic solutions [4]. Additionally, the Open
datasets expected to be delivered from new instrumen-     Science, FAIR-compliant approach followed is espe-
tation and missions.                                      cially convenient in underpinning the standardiza-
   The main technical challenges for the space com-       tion and interoperability of astronomical archives and
munity are centered around data accessibility, inter-     databases. As an example, the ViaLactea Visual Ana-
operability and scalability. While the use of standard    lytics (VLVA19 ) service offers a complete visualiza-
data formats is accepted widely, e.g. FITS [24], obser-   tion solution with seamless access to multiple sur-
vatories usually maintain their own archive interfaces,   veys of the Milky Way (near-infrared to radio band)
relying on custom made (i.e. not always standardized)     including continuum maps and molecular data cubes,
search keywords. Such an heterogeneity constitutes an     that can be handled entirely by our Visual Discovery
important obstacle that may slow down the generation      framework (see Section 5.1).
of scientific results, especially for multiwavelength
astronomy –the study of astronomical objects com-
bining information acquired at various wavelengths–       3 Related Works
that requires simultaneous visualization of images
typically obtained with different instruments (and in     Despite the intrinsic differences among the underwa-
very different conditions). The International Virtual     ter, atmospheric and space research sectors, a series of
Observatory Alliance (IVOA16 ) has made significant       common requirements arise. Innovative visualization
progress in this direction towards a true standard-       tools and solutions must be able to (i) handle complex
ization of astronomical data access, providing query      and heterogeneous datasets, (ii) support multiple visu-
interfaces for multiple catalogues and data archives,     alization strategies (e.g., 2D and 3D renderings, pro-
and developing protocols for data access and exchange     jection techniques for higher dimensionality data) and
(e.g. the Table Access Protocol, or TAP17 ). However,     (iii) enable an intuitive and user-friendly data explo-
challenges remain, e.g. use of IVOA tools is still far    ration. Besides, the ever-growing size of the datasets
from being a preferred option as evidenced in a recent    underlines the need for moving from the traditional
                                                          standalone model to novel distributed approaches,
                                                          relying on cloud-based infrastructures able to meet
12 https://mars.nasa.gov/mars2020/                        the increasing demand for resources. In this sense,
13 https://www.skatelescope.org
14 https://www.lsst.org/
15 https://www.jwst.nasa.gov/                             18 https://cartavis.org/
16 https://ivoa.net                                       19 https://marketplace.eosc-portal.eu/services/space-vis-vialactea-
17 https://www.ivoa.net/documents/TAP/                    service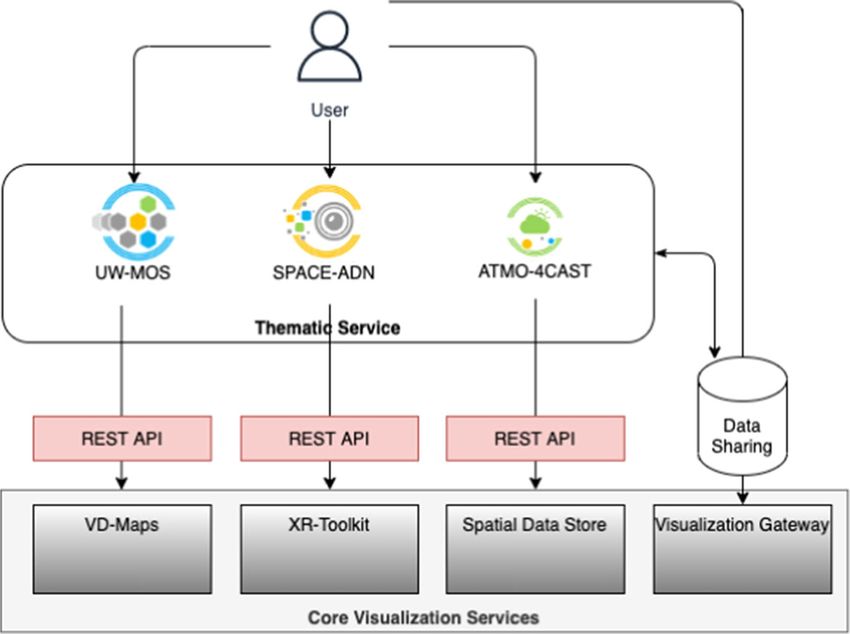
J Grid Computing (2022) 20: 7                                                                     Page 5 of 18    7

we have recently witnessed the blossoming of sev-         terms of achieving high performances over high-
eral solutions and frameworks that are steadily gaining   latency connections. VisIVO Science Gateway [3] is
prominence in diverse scientific visualization fields.    wrapped around WS-PGRADE/gUSE [11] integrat-
   ParaView [1] is a large scale parallel visualiza-      ing services for processing and visualizing large-
tion software, designed for effective exploitation of     scale multi-dimensional astrophysical datasets on Dis-
high performance infrastructures. A web enabled ver-      tributed Computing Infrastructures.
sion ParaViewWeb,20 can act as a Web Application by           Other cloud-based visualisation solutions are typ-
allowing users to remotely connect via web browsers       ically built upon bespoke frameworks which can be
to a ParaView server. The connection is enabled via       effective e.g. in the context of targeting single highly
the custom library wslink21 that connects JavaScript      focused applications but less useful in providing a rich
web clients to a Python web server through ALP            general purpose visualisation ecosystem. Core visu-
WebSockets. Furthermore, the in-situ library Paraview     alization services of NEANIAS offer such a visual
Catalyst [2] allows users to instrument their applica-    discovery platform based on JupyterHub26 allowing
tion for in-situ analysis, visualization, and computa-    users to write and execute code, to transform, analyse,
tional steering purposes.                                 and visualize datasets by supporting several high per-
   The Cactus computational framework [10] can sup-       formance visualisation services integrating seamlessly
port a web browser interface for insitu visualization     with cloud based mechanisms for authorisation and
and steering tasks. The user can instrument existing      authentication, storage allocation and sharing, logging
high performance applications with the Cactus API,        and accounting and open publication of resulting data
perform steering tasks and view visualization outputs     products, thus making it ready for onboarding the
through a web browser. The standard implementation        emerging EOSC ecosystem.
utilises an HTTPD22 web server, and forwards ports            Many of the aforementioned solutions certainly
to the user for remote access.                            represent a significant step forward for scientific visu-
   WebVis [27] is a multi-user, client-server, visual-    alization, being widely adopted in several fields. Still,
ization framework with a web-based client offering        they constitute a somewhat dispersed, heterogeneous
services in the cloud and is accessible via netbooks,     toolbox rather than a unified solution. Aspects such
smartphones, and other web-and JavaScript-enabled         as data access and sharing, or interoperability and
mobile devices. The client connects to a server via a     integration with other services and tools, are out of
back-end service built using the Google Web Toolkit23     the scope of existing visualization suites. NEANIAS,
and a Java web server, which communicate via a            with its visualization core services, intends to fill this
web service that forwards events and images to and        gap, by providing a set of easy-to-use, multipurpose
from the underlying rendering infrastructure nodes.       visualization frameworks built upon FAIR principles.
Client GUI interactions are forwarded to the server,      NEANIAS core visualization services represent a state
and images returned, through an EventBus using the        of the art solution for the visualization challenges
HTTP server push paradigm.                                of the big data era, facilitating straightforward data
   Remote frameworks that support web such as             access and sharing by taking advantage of the EOSC
FastX24 are seeing some success in real-world deploy-     cloud ecosystem and resources. Moreover, the core
ments, e.g. for the web visualization portal at the       visualization services are not just independent pieces
Texas Advanced Computing Centre25 which supports          of software, but can also be seamlessly integrated
web-based usage of Paraview. FastX offers a cloud-        with other tools by means of standard interfaces. This
capable display solution that is fully optimized in       ability allows for building complex visualization anal-
                                                          ysis workflows from scratch. Last but not least, core
                                                          visualization services, thanks to their domain-agnostic
20 ParaViewWeb:https://kitware.github.io/paraviewweb/     nature, can be easily exploited for purposes far beyond
21 wslink   library:https://github.com/kitware/wslink     their original scope, i.e., in domains not related to
22 https://httpd.apache.org/                              underwater, atmospheric or space research, such as
23 http://www.gwtproject.org                              healthcare or communications.
24 https://www.starnet.com/fastx/cloud
25 https://www.tacc.utexas.edu/vislab                     26 https://jupyter.org/hub
7 Page 6 of 18 J Grid Computing (2022) 20: 7
4 The Neanias Ecosystem stateless interactions, cacheable resources, layered
systems and uniform interfaces. When applied to web
The NEANIAS thematic services are being devel- services, these offer desirable properties, such as per-
oped as totally independent software components to formance, scalability, and modifiability, that enable
cater for specific community needs. Nevertheless, services to work on the Web optimally. We also sup-
there is an evident number of commonalities that port FAIR principles through the employment of tech-
connect them intrinsically, e.g., when considering end- nologies such as OpenAIRE’s Zenodo platform31 and
user workflows. We are exploiting such underlying the eInfraCentral32 service catalogue, as well as adher-
synergies to establish generic, cross-community core ing to standards and guidelines from international
services to amplify the potential of thematic services, community bodies, e.g. the Open Geospatial Consor-
pushing boundaries towards fully blown open science tium (OGC)33 and International Virtual Observatory
practices [21] and facilitating migration to EOSC con- Alliance (IVOA).34
cepts [19]. The NEANIAS core services are being The overall architecture of the NEANIAS ecosys-
developed under the umbrella of distinct and comple- tem follows a distributed and tiered approach (see
mentary clusters of specific functionalities for open Fig. 1). The model is composed of logical architecture
science lifecycles (C1 services27 ), EOSC integration blocks that cover specific functional or technolog-
(C2 services28 ), artificial intelligence (C3 services29 ) ical requirements and are appropriately exposed to
and finally, visualization (C4 services30 ). Abstracting other services (offered by NEANIAS or third-parties).
from thematic services underpinning concepts, the C3 Services themselves are also composite multi-tier sys-
and C4 clusters constitute the arrowhead of NEANIAS tems encapsulating loosely coupled microservices and
generic service offerings. C4 services in particular lightweight communication protocols for their inter-
provide support mechanisms for high performance nal operations. They provide appropriate abstractions
multidimensional data visualization solutions appli- of physical resources regarding computing, storage,
cable to a raft of diverse scientific scenarios (see and network capacity, e.g. virtual machines, con-
Section 5). tainer platforms, or storage programming interfaces.
The design principles of the NEANIAS ecosys- The NEANIAS thematic services encompass top-level
tem are centred around the pillars of a) delivering offerings underpinned by core services to cater for
a service-oriented architecture, while b) fully real- specific community needs in the underwater, atmo-
izing the REST paradigm [8], and c) adhering to spheric, space and business sectors (tailored to energy
FAIR principles [25] to manifest data compliant with and smart air quality) building use cases on top of
findable, accessible, interoperable and reusable mech- thematic services. Core services include base and
anisms. The service-oriented architecture is realized advanced offerings as follows:
through the use of microservices to enforce single-
– Base Core Services: This cluster of generic ser-
responsibility principles, allowing for component sep-
vices provides base tooling in the ecosystem to
aration, reuse, discoverability, and interoperability.
support open science lifecycles (C1) and integra-
REST design patterns for application programming
tion with EOSC and cloud resources (C2).
interfaces are well-established web standards com-
C1 services provide the tools for NEANIAS
monly employed in existing EOSC services to sat-
services to be discoverable, accessible and inte-
isfy architectural constraints such as client-server
grated with EOSC. The NEANIAS service cat-
alogue portal and programming interfaces are
based on the eInfraCentral catalogue and enable
27 NEANIAS C1 Services documentation: https://docs.neanias.
eu/en/latest/c1-services.html#c1-services
28 NEANIAS C2 Services documentation: https://docs.neanias.
eu/en/latest/c2-services.html#c2-services
31 https://zenodo.org/
29 NEANIAS C3 Services documentation: https://docs.neanias.
32 https://www.einfracentral.eu/
eu/en/latest/c3-services.html#c3-services
30 NEANIAS C4 Services documentation: 33 https://www.ogc.org/
https://docs.neanias.
eu/projects/c4-services/en/latest/ 34 http://ivoa.net/J Grid Computing (2022) 20: 7 Page 7 of 18 7
Fig. 1 Overall architecture
of the NEANIAS ecosystem
service providers to register and present their ser- Keycloak.37 The configuration management38
vices in a single project’s catalogue, which is service provides key value storage for storing ser-
compliant with EOSC guidelines. The NEANIAS vice configurations, allowing for integration at
data catalogue is built on top of Zenodo and en- bootstrap and runtime. The instance registry39
ables providers to publish their data as well as as- service supplies dynamic registration and service
sign persistent identifiers (PID) for digital assets, discovery, along with service location and health
making them unambiguously cited and hence uni- status information. The log aggregation40 and
vocally discoverable. Service providers are also accounting41 services provide seamless logging
able to access common UI and UX elements for and accounting functionalities by taking advan-
the presentation of their services and development tage of the ELK stack.42 Finally, cloud comput-
of uniformly coordinated user experiences for all ing services (supporting both Virtual Machines
services developed in the context of NEANIAS. through OpenStack43 and containers employing
Finally, thematic service providers can also create Kubernetes44 ) and data services for data deposit-
and maintain actionable data management plans ing, sharing and exploration are available.
through Argos35 OpenAIRE service. – Advanced Core Services: This cluster is built
C2 services encompass loosely coupled ele- upon base services for generic functionalities to
ments that enable the assembly of virtual infras- be exploited by the NEANIAS specific domains
tructures to serve other services, bringing them and beyond; these include support for artificial
closer to EOSC resources and processes, as well
as other research and cloud computing infrastruc-
tures. The authentication and authorisation infra- 37 https://www.keycloak.org/
structure36 (AAI) service offers an horizontal so- 38 https://docs.neanias.eu/projects/configuration-service/en/latest/
lution for authenticated access (across users and README.html
services), a centralized user management, and an 39 https://docs.neanias.eu/projects/instance-registry-service/en/
authorization policy definition, as well as an latest/README.html
40 https://docs.neanias.eu/projects/logging-service/en/latest/
identity federation. It is backed by the open
source identity and access management solution README.html
41 https://docs.neanias.eu/projects/accounting-service/en/latest/
README.html
42 https://www.elastic.co/what-is/elk-stack
35 https://argos.openaire.eu/splash/ 43 https://www.openstack.org/
36 https://docs.neanias.eu/projects/aai-service/en/latest/ 44 https://kubernetes.io7 Page 8 of 18 J Grid Computing (2022) 20: 7
Fig. 2 Overview of
NEANIAS C4 visualization
services
intelligence processing (C3) and advanced visual- accesses to the mechanisms exposed through the XR
ization solutions (C4). C3 services represent the toolkit and the spatial data store services.
elements of typical machine learning workflow C4 services identify underlying common needs and
lifecycles, initially a model needs to be designed synergies across user communities and apply cross-
and implemented. Whenever data loads exceed cutting glue and abstraction mechanisms to realize a
the capabilities of single workstations, model robust, modular, cross-sector and open source core
training is offloaded to distributed computational pool of methods and tools to support visualization
clusters. Depending on the model, different paral- services, leveraging on the resources available from
lelisation approaches can be followed and once a research infrastructures and EOSC-hub46 facilities.
model is trained, serving and deployment requires C4 services underpin a diverse range of multi-faceted
dedicated resources. Finally, the details of C4 visualization workflows, from 2D/3D spatio-temporal
visualisation services currently delivered within to composite 2D/3D visuals for complex, high dimen-
NEANIAS are discussed in the next section. sionality datasets, including computationally demand-
ing cross-reality applications, e.g. supporting mecha-
nisms for scalable visualization or production of assets
5 Core Visualization Services to enable advanced interaction mechanisms through
game engines and VR headsets.
The core visualization services in NEANIAS lie Handling of big data relies on offloading workflow
within the upper layer of the core services cluster in computations to distributed computational clusters.
the tiered system architecture described in Section 4. Depending on the tools deployed, different paralleliza-
They provide functionalities supporting different sce- tion approaches can be exploited to harvest optimally
narios when integrated with the higher-level thematic different types of underlying infrastructures, ranging
services. Each service can be viewed as a fundamen- from small-scale clusters (with or without GPUs) to
tal building block of a typical scientific visualization large-scale heterogeneous systems. Although the core
workflow; the focus is on visual discovery frameworks services developed in C4 allow customization to meet
(C4.1, VD - Section 5.1), science gateways (C4.2, NEANIAS specific community needs, they can be
VG - Section 5.2), Cross-Reality (XR) frameworks to generalized sufficiently to extend to other EOSC end-
support virtual reality (C4.3, XR - Section 5.3), and user communities far beyond their original scoping.
spatial data stores (C4.4, DS - Section 5.4).
The overall relationships and dependencies bet- 5.1 C4.1 - Framework for Visual Discovery (VD)
ween the services are depicted in the schema in Fig. 2.
The science gateway45 enables visualization work- C4.1 provides tools to support data-intensive comput-
flows based on the visual discovery framework and ing for visual scientific discovery, including research,
45 http://www.icsciencegateways.org/ 46 https://www.eosc-hub.euJ Grid Computing (2022) 20: 7 Page 9 of 18 7
Fig. 3 NEANIAS C4.1 Framework for Visual Discovery services and C4.2 Visualization Gateway diagram and integration with Base
Core services (C1 and C2) and C3 AI Services
training and outreach, on observational data, theoret- 5.1.2 VD-Splotch
ical simulations, and 2D/3D tiles and maps. High-
performance services are provided for: (1) visual ana- The VD-Splotch service makes available the suite of
lytics from multidimensional data tables (VD-VisIVO) tools provided by Splotch [15] for data processing
(see Section 5.1.1); (2) high-quality volume render- and visual discovery. Splotch supports very large-scale
ing of particle-based datasets exploiting a variety datasets and an array of diverse parallelization models
of parallel programming models (VD-Splotch) (see for fast, high-quality distributed volume rendering of
Section 5.1.2); and (3) creation of interactive 2D/3D particles, coming from numerical simulations in many
tilings and maps (VD-Maps) (see Section 5.1.3). file formats, e.g., smoothed particle hydrodynamics
Figure 3 shows the interdependencies and relation- from astrophysical simulations.
ships with the base core services in the NEANIAS
ecosystem. The first two visual discovery services 5.1.3 VD-Maps
VD-VisIVO and VD-Splotch are exposed to the end-
users via the Visualization Gateway while the third The VD-Maps service consists of a set of tools
one, VD-Maps is accessible through a specific web for visualization of large-scale, high-resolution maps,
UI based on C1 common UI components. All VD ser- either 2D (images), 2.5D (elevation/bathymetric maps)
vices are integrated with C2 services for AAI, logging, or 3D (3D meshes), provided in real-time through a
accounting, data sharing and computing access. Par- web application. A conversion service is included to
ticular details are summarized in the below sections. translate standard formats into OGC compliant hier-
archical data structures through a web visualization
5.1.1 VD-VisIVO viewer based on CesiumJS.47
The VD-VisIVO service offers a framework for data- 5.2 C4.2 - Visualization Gateway (VG)
intensive visual discovery and analysis through the
suite of tools provided by VisIVO [18]. VisIVO The VG service provides a flexible test bed for
is designed specifically for distributed computing designing, prototyping, realising and fully validating
environments (e.g. Cloud infrastructures) and pro- complex visualization solutions for customised data
vides mechanisms for exploration of large-scale data- exploration workflows. VG (see Fig. 3) is founded on
sets through highly customized 3D views of multidi-
mensional data tables from various sources. 47 http://www.cesium.com/cesiumjs/7 Page 10 of 18 J Grid Computing (2022) 20: 7
Fig. 4 NEANIAS C4.3
Toolkit for Cross Realities
services diagram and
integration with base core
services
the popular Jupyter Hub48 project which is chosen for components support interactive data exploration and
its ability to spawn notebook servers in the Cloud, thus navigation mechanisms, e.g., for advanced compar-
streamlining the usage for end users by avoiding ma- isons in multidimensional and multi-frequency data-
nual installation of software tools locally and eliminat- sets for research and public outreach. C4.3 services are
ing the necessity for complex software dependencies built upon extending existing components with a focus
and housekeeping mechanisms. The underlying phi- on providing services with enhanced realism, preci-
losophy of the Visualization Gateway is to focus on sion and usability along a number of aspects relating
usability and seamless embedding within the relevant to enriched user experience covering novel navigation
end-user workflows and to interlink not only with C4.1 mechanisms and seamless integration of large-scale
services but also with other NEANIAS core services, catalogues.
e.g. C3 for visualization of AI-powered solutions, As shown in Fig. 4, C4.3 exploits the framework
C4.3 to underpin powerful virtual reality solutions and for visual discovery developed in C4.1. C4.3 services
C4.4 to facilitate end-user data accessibility. The Visu- are envisaged to be interconnected seamlessly with
alization Gateway is deployed in a way that can be C4.2 to furnish complex visualization workflows and
fully embedded within the relevant workflows of end- C4.4 to underpin advanced data access. The compo-
user community activities, while exploiting a range nents implemented so far consist of a Data Connector
of diverse parallelisation models and infrastructure Service (DCS) for retrieving, in a generic way, data
accelerator capabilities for optimal performances. coming from different sources (individual files or
databases) and a Positioning Manager Service (PMS)
5.3 C4.3-Toolkit for Cross Reality (XR) providing the capability to retrieve specific data about
the position/rotation of particular objects at specific
C4.3 provides a toolkit underpinning an environment temporal instants. The latter uses Spice kernels.50 and
for designing, implementing and validating complex is tailored to astrophysics environments. However, the
visualization solutions exposed to end-users via Cross system will eventually support visualization of 3D
Reality (XR) mechanisms, particularly those based on data from other NEANIAS community sectors too,
Virtual Reality. To serve as a universal core service such as underwater or atmospheric.
for multiple users, popular software frameworks and
technologies have been selected based on a set of com- 5.4 C4.4 - Spatial Data Stores (DS)
ponents used by an existing TLR6 software solution
called Astra Data Navigator (ADN), e.g. the frame- C4.4 services provide a set of reference systems and
works provided by the game engine Unity.49 Such data structures to facilitate data referencing, access,
48 https://jupyter.org/hub
49 https://unity.com/ 50 https://naif.jpl.nasa.gov/naif/index.htmlJ Grid Computing (2022) 20: 7 Page 11 of 18 7
Fig. 5 NEANIAS C4.4
Spatial Data Stores services
diagram and integration
with base core services
and retrieval by other services, in a standardized man- high-level or temporary user products. PostGIS pro-
ner based on positional/location criteria, e.g. the planet vides support for geographic objects allowing location
Earth or other planetary bodies (see Fig. 5). queries to be run in plain SQL, following the OGC’s
Earth observational data, such as Copernicus guidelines. PostGIS enjoys further wide support from
datasets and products, are referenced in the ADAM51 various third-party open source and proprietary tools,
Data Access System (DAS), a software module that such as QGIS.56 The Spatial Data Store is a com-
manages a large variety of geospatial information sup- position of physical resources (i.e. NAS, S3 buck-
porting multiple data formats and different geogra- ets57 ) and tools (MongoDB, PostgreSQL/PostGIS,
phic, geometric and time resolutions. The DAS mod- and GeoServer) organized to provide OGC features
ule allows for accessing, visualizing, subsetting, com- and raster data through C2 data exploration, provided
bining, processing, and downloading multiple data by the ADAM platform, as well as low-level REST
sources at once. DAS also exposes OGC Open Search based programming interface mechanisms.
and Web Coverage Service (WCS 2.x) interfaces that
allow for discovering available datasets and subdivid-
ing them in any dimension with a single query. 6 Service Delivery and Evaluation
C4.4 services take advantage of Geoserver,52 Mon-
goDB,53 PostgresSQL54 and PostGIS55 systems A NEANIAS service represents one or more soft-
designed to handle spatial data storage and operations ware components that define a set of active resources
to query/retrieve such data sets from ADAM. ADAM i.e. resources that answer user requests [17]. Services
provides seamless full data cycle management func- follow the single responsibility principle, i.e. being
tionalities to explore the spatial distribution and tem- specialized in their role and responsible for a single
poral evolution of various geophysical and geospatial and typically complex task, often requested through
information, as well as to integrate and execute data a simple interface by the end-users. The software
processing functionalities at scale. MongoDB, on the underpinning a service is abstracted from users to
other hand, is designed to work with unstructured data, experience its functionality in a high-level interaction
text, numbers and vectors; it has applicability on spa- setting. In the context of a distributed architecture,
tial vector data - data representing polygons are used as it is typically used with cloud computing, inter-
to e.g. define observation footprints. Geoserver comes faces are often provided by URLs. Documentation
as a good alternative for small size, heterogeneous provides users with information and training about
data sets, as a volatile data storage system to publish service capabilities and its usage. In NEANIAS, ser-
vices are built on top of TRL6 software solutions –
i.e. software fully functional in its original domain –
51 https://adamplatform.eu intended to evolve towards TRL8, in our context, fully
52 http://geoserver.org/ operational in a cloud setting.
53 https://www.mongodb.com/
54 https://www.postgresql.org 56 https://www.qgis.org/en/site/
55 https://postgis.net/ 57 https://aws.amazon.com/s3/7 Page 12 of 18 J Grid Computing (2022) 20: 7
Fig. 6 NEANIAS service
inter-operability scheme,
showing the underpinning
of thematic services by core
services
6.1 Thematic Services Underpinning catalogues, such as Gaia;58 and the Atmospheric Fore-
cast (ATMO-4CAST) service makes extensive use of
As described in Section 4, NEANIAS core services the Spatial Data Store to generate accurate meteoro-
underpin the thematic services that enable specific logical forecasts.
domain tasks. Therefore, core services are generally
not delivered directly to the end users (except for 6.2 Releases and Deployment Management
the AI and visualization gateway), but instead, they
are consumed by the thematic services for multi- The development of NEANIAS services follows
ple purposes. To ensure the compatibility and inter- the Continuous Integration / Continuous Delivery
operability of the different services that compose (CI/CD) philosophy, in order to deliver updates and
the NEANIAS ecosystem, inter-service communica- new features to end users in a more frequent and effi-
tion is handled thorugh service contracts, in which cient way. Figure 7 depicts the typical lifecycle of a
each service defines its interface, resources and inter- NEANIAS service, from the development of new fea-
action patterns. In NEANIAS, service contracts (i) tures to the final release of a new version. This process
are, whenever possible, REST compliant, (ii) enforce can be divided into three major phases:
backwards compatibility among versions unless noted
otherwise, and (iii) follow widely adopted standards. – development: in this phase, code changes are
Such a standardization applies not only to the def- implemented, including new features –that extend
inition of service operations –e.g., endpoint naming the functionality of the service–, refactorings and
conventions–, but also data models and schemas, to bug fixes. New features are planned regularly,
ensure reusability and interoperability. according to the original design requirements of
Figure 6 shows a concrete example of the ser- the service, and the user feedback received.
vice interoperability scheme, in which three thematic – validation: in this phase, the service is exhaus-
services make use of some of the visualization core tively evaluated to ensure that it works as expected
services described in Section 5. From left to right, the and the design requirements are met. Validation
Seafloor Mosaicing from Optical Data (UW-MOS) comprises two aspects: testing and end-user ass-
service relies on the core service VD-maps to generate esment. Testing can be performed automatically
2D/3D tilings from seafloor imagery; the Astra Data to reduce bug finding costs. The employed CI/CD
Navigator (SPACE-ADN) seamlessly exploits the
58 https://gea.esac.esa.int/archive/
XR-toolkit to provide interactive navigation of stellarJ Grid Computing (2022) 20: 7 Page 13 of 18 7
Fig. 7 NEANIAS Services Release process steps
pipelines include unit and integration testing endpoint, i.e. the point through which it can be
stages, as provided by the NEANIAS Gitlab. On accessed. The way a service is provided – in other
the other hand, end-user assessment is performed words its interface to prospective users – varies; some
prior to release by groups of expert domain users, services collect information from others (e.g., for log
and involves: a) verifying of the correct imple- aggregation), others answer to queries (e.g. spatial
mentation, functionality and performance of each data stores), while others are less dynamic, openly
service component; b) verifying that communica- providing data content or guidelines (e.g. the web
tions among components are performed correctly; toolkit). Regardless of the nature of a particular ser-
and, finally, c) end-to-end testing to simulate vice or its interface, its documentation is nevertheless
end-user and administrator behaviours on the plat- fundamental, even for base core services. The idea is
form. Finally, at this stage, comprehensive doc- at all times to state clearly and persistently how to
umentation is produced in order to facilitate the properly use the service, and list comprehensively all
usage of the service. necessary dependencies required for its operation.
– publishing: this phase starts with the effective
deployment of the service. For deployment, NEA- 6.3 Service Evaluation
NIAS services follow the development, staging
and production model. First, newly implemented We are following a robust technical evaluation
code and features are deployed to a development protocol for all thematic services (and their under-
server, where basic testing takes place to spot lying core services) in NEANIAS, and in partic-
bugs, application misbehaviours and other poten- ular those providing visualization capabilities. This
tial issues. The most intensive testing occurs in involves an evaluation cycle for each service release
the staging server, by running comprehensive test (see Section 7) manifested in real-world production
suites to detect any remaining bugs, gathering per- environments, and carried out by cohorts of expert
formance metrics and finding whatever needs to community users from the different science domains:
be polished prior to final deployment to the pro- space, see [16]; underwater, see [26]; and atmospheric,
duction server, where the service is made avail- see [23].
able for real-world end users. Before this final Starting from thematic activities NEANIAS is now
stage, it is customary for the service provider to embarking on a larger scale service validation by
run a smoke test, covering the minimal set of func- external users from other community bodies for devel-
tionalities required for the application to work at oping further improvements and new functionalities in
a minimum, thus assessing its stability and allow- preparing the ground for EOSC onboarding on top of
ing for a quick rollback if necessary. After a first the core visualisation services while always ensuring
production deployment, NEANIAS services are their generic flavour.
published on the NEANIAS service catalogue,59
and consequently may be onboarded in the EOSC
marketplace.60 7 Service Release Status
A released service is defined chiefly by two
The first release made services available under the
aspects: its documentation and interface, and its access
NEANIAS development infrastructure [17]. Currently
all services are in their second release iteration with a
59 https://catalogue.neanias.eu/ final delivery expected by the end of NEANIAS - see
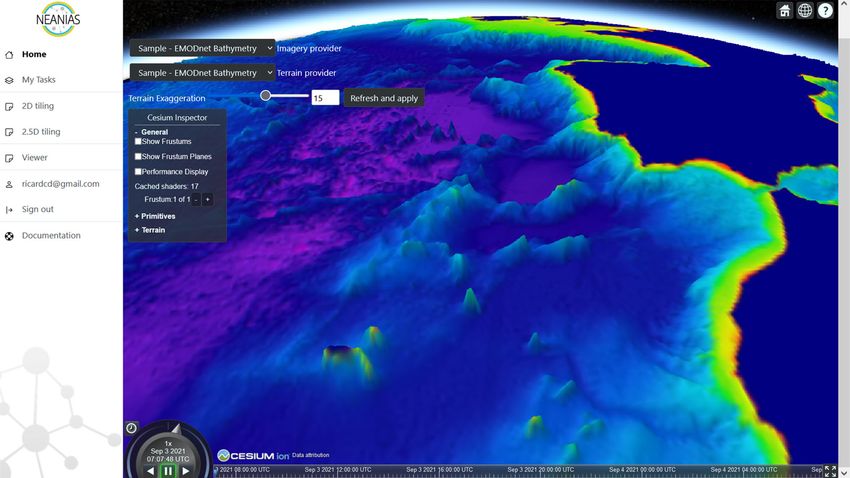
60 https://marketplace.eosc-portal.eu/ below for further details.7 Page 14 of 18 J Grid Computing (2022) 20: 7 Fig. 8 NEANIAS VD-Maps Service to process and visualize imagery for terrain-based hierarchical tiled maps VD-VisIVO is released as a Docker container61 Quantized Mesh Generator68 libraries are hosted sep- managed through GitLab62 and delivered via the arately in their respective repositories. NEANIAS container image registry. The source code The visualization gateway69 is based on Jupyter of VisIVO is freely available on GitHub,63 licensed Hub70 - its novelty is on showcasing a FAIR plat- under GNU, and includes demos and user manu- form integrating distinct visualization approaches into als. Similarly, VD-Splotch64 is also released as a an ecosystem allowing realization of complex sce- Docker container with software implementation man- narios through seamless integration mechanisms with aged through GitLab65 and delivery to end-users via common scientific workflows. The gateway was pro- the NEANIAS container image registry. totyped using KinD,71 originally in a local setting and Finally VD-Maps (see Fig. 8) is released as a prior to releasing within the GARR Container Plat- Docker container providing additional containers for form.72 The web interfaces are accessible via NEA- serving and visualizing the generated maps. The code NIAS AAI and offer separate notebook spawners for and instructions to build these containers are available each of the Visual Discovery Framework components through NEANIAS GitLab,66 the docker images are - these can be accessed on the notebook through inter- available in the registry while external dependencies active python demonstrations (see Fig. 9). Prior to such as the Cesium Terrain Builder67 and EMODnet spawning a notebook, the system offers the option 61 https://www.docker.com 62 https://gitlab.neanias.eu/c4-service/vd-visivo 63 https://github.com/inaf-oact-VisIVO/VisIVOServer 68 https://github.com/coronis-computing/emodnet qmgc 64 https://github.com/splotchviz/splotch 69 https://vis-gateway.neanias.eu/ 65 https://gitlab.neanias.eu/c4-service/vd-splotch 70 https://jupyter.org/hub 66 https://gitlab.neanias.eu/c4-service/vd-maps 71 https://kind.sigs.k8s.io 67 https://github.com/geo-data/cesium-terrain-builder 72 https://cloud.garr.it
J Grid Computing (2022) 20: 7                                                                           Page 15 of 18    7

Fig. 9 The NEANIAS Visualization Gateway main page (top left) showing sample notebooks integrating VD-Splotch (bottom left)
and Spatial DS (bottom right)

to mount the notebook to a Nextcloud73 store via                users can specify credentials for a different Nextcloud
WebDAV.74 For the purposes of demonstrating the                 store, or make use of the file uploading capability
basic functionality of the tools, a notebook mounts             of the notebook web interface to manually upload
by default to the NEANIAS Nextcloud store which                 their own datasets. The authentication service based
contains read-only reference datasets. Alternatively,           on Keycloak75 allows notebook access to authorized
                                                                users via the Jupyter Hub login page. Integration with
73 https://nextcloud.com
74 http://www.webdav.org                                        75 https://www.keycloak.org
7 Page 16 of 18 J Grid Computing (2022) 20: 7
Fig. 10 NEANIAS ADAM-Space platform exploring data from Mars underpinned by the Spatial Data Store service C4.4
NEANIAS accounting and logging services, using their long term maintenance and sustainability. The
filebeat76 to pass on Kubernetes logs, is currently PMS module offers a simplified utilization of the
underway. This will allow increasing reliability of the Spice toolkit81 to retrieve the correct positions for all
system as well as accounting for global usage of celestial objects present in rendered catalogue scenes
resources thus optimizing the current setup. Also link- - this is acheived by exploiting appropriate request
ages with Zenodo, toward Open Science integration parallelization mechanisms for optimizing overall per-
[12, 22], is being tested for ensuring results repro- formances.
ducibility. The spatial data store service is provided by
The XR toolkit has released the PMS77 and DCS78 the MEEO Cloud storage resources82 to host atmo-
modules enabling ADN to extend navigation mech- spheric and planetary science data. An OpenNebula83
anisms within the Hipparcos catalogue [13] (∼110K instance manages the MEEO Data Center virtualiza-
celestial objects) with the ultimate goal of provid- tion resources. Kubernetes is used for serving discov-
ing an interactive exploration solution for catalogues ery and access requests. The datasets and products
such as Gaia[5] (∼1.8 billion objects) and beyond. metadata are archived in a catalogue, and original
The novelty of our solution is in stark contrast to products are archived in physical volumes. The DS
existing VR solutions, (e.g. CosmoScout VR79 or service is accessed through the space service ADAM-
SpaceEngine80 ) which allow representation of stel- Space84 for exploration of data related to Mars (see
lar catalogues of limited sizes only, and are devel- Fig. 10) and from the ADAM-Platform85 for explo-
oped entirely from scratch (i.e. not based on robust ration of environmental data of the Earth.
game engine platforms), thus making cumbersome
76 https://www.elastic.co/guide/en/beats/filebeat/current/
filebeat-overview.html 81 https://naif.jpl.nasa.gov/naif/toolkit.html
77 https://pms.neanias.eu/ 82 www.meeo.it/cloud
78 https://dcs.neanias.eu/ 83 https://opennebula.io
79 https://github.com/cosmoscout/cosmoscout-vr 84 https://explorer-space.adamplatform.eu/
80 http://spaceengine.org/ 85 https://explorer.adamplatform.eu/J Grid Computing (2022) 20: 7 Page 17 of 18 7
8 Conclusions Open Access This article is licensed under a Creative Com-
mons Attribution 4.0 International License, which permits
use, sharing, adaptation, distribution and reproduction in any
The NEANIAS project addresses the prototyping of
medium or format, as long as you give appropriate credit to
new innovative solutions in EOSC, driving the co- the original author(s) and the source, provide a link to the Cre-
design, delivery, and integration of thematic and core ative Commons licence, and indicate if changes were made. The
services, derived from state-of-the-art research assets images or other third party material in this article are included
in the article’s Creative Commons licence, unless indicated oth-
and practices in three major sectors: underwater, atmo-
erwise in a credit line to the material. If material is not included
spheric and space research. The underlying ambition in the article’s Creative Commons licence and your intended use
is to create a collaborative research ecosystem promot- is not permitted by statutory regulation or exceeds the permit-
ing Open Science principles and practices, injecting ted use, you will need to obtain permission directly from the
copyright holder. To view a copy of this licence, visit http://
add-on value to the data and contributing to the effec-
creativecommons.org/licenses/by/4.0/.
tive materialization of the EOSC landscape services.
As a cornerstone of scientific discovery, data visu-
alization is crucial for unlocking new discoveries
References
and generating knowledge. The big data paradigm
sweeping in almost every scientific discipline requires 1. Ahrens, J., Geveci, B., Law, C.: Paraview: An end-user tool
innovative and efficient data visualization solutions. for large data visualization. The Visualization Handbook
717(8) (2005)
We have delved in this paper into the details of
2. Ayachit, U., Bauer, A., Geveci, B., O’Leary, P., Moreland,
NEANIAS core visualization services. We have sum- K., Fabian, N., Mauldin, J.: Paraview catalyst: Enabling
marized the scientific challenges to overcome in the in situ data analysis and visualization. In: Proceedings of
different research communities, the role of core ser- the First Workshop on In Situ Infrastructures for Enab-
vices within the NEANIAS system architecture, and ling Extreme-Scale Analysis and Visualization, pp. 25–29
(2015)
the main features provided by each visualization ser- 3. Becciani, U., Sciacca, E., Costa, A., Massimino, P.,
vice, specifically on visual discovery, visualization Pistagna, C., Riggi, S., Vitello, F., Petta, C., Bandiera-
gateway, cross-reality and spatial data stores. Finally, monte, M., Krokos, M.: Science gateway technologies for
we have reviewed the service delivery model and the the astrophysics community. Concurr. Comput.: Pract. Exp.
27(2), 306–327 (2015)
current software release status of the visualization core 4. Bordiu, C., Bufano, F., Sciacca, E., Riggi, S., Molinaro,
services. M., Vizzari, G., Krokos, M., Brandt, C.: Astronomical
The development of NEANIAS services is on going research in the next decade: Trends, barriers and needs
and is envisaged to be completed by the end of 2022. in data access, management, visualization and analysis.
Astronomical Data Analysis Software and Systems XXX
CI compliant progressive releases are being planned, proceedings, to be published (2020)
taking into account existing and newly gathered user 5. Brown, A., Vallenari, A., Prusti, T., De Bruijne, J., Babusi-
requirements. These releases will eventually push the aux, C., Bailer-Jones, C., Biermann, M., Evans, D.W., Eyer,
NEANIAS visualization services to TRL8, promoting L., Jansen, F., et al: Gaia data release 2-summary of the
contents and survey properties. Astron. Astrophys. 616, A1
open science practices by fully onboarding the entire (2018)
service portfolio into the merketplace of the EOSC 6. Campos, R., Quintana, J., Garcia, R., Schmitt, T., Spoelstra,
ecosystem. G., Schaap, M.A.D.: 3d simplification methods and large
scale terrain tiling. Remote Sens. 12(3), 437 (2020)
7. Dias, D., Pina, N., Tchepel, O.: Characterization of traffic-
Funding Open access funding provided by INAF - National related particulate matter at urban scale. Int. J. Transp.
Institute for Astrophysics within the CRUI-CARE Agreement. Develop. Integr. 3(2), 144–151 (2019)
8. Feng, X., Shen, J., Fan, Y.: Rest: An alternative to rpc for
web services architecture. In: 2009 First International Con-
Data Availability Statement Data sharing not applicable to
ference on Future Information Networks, pp. 7–10. IEEE
this article as no datasets were generated or analysed during the
(2009)
current study.
9. Franke, L., Haehn, D.: Modern scientific visualizations on
the web. Informatics 7(4) (2020). https://doi.org/10.3390/
Compliance with Ethical Standards informatics7040037. https://www.mdpi.com/2227-9709/7/
4/37
10. Goodale, T., Allen, G., Lanfermann, G., Massó, J., Radke,
Conflict of Interests The authors declare that they have no T., Seidel, E., Shalf, J.: The cactus framework and toolkit:
conflict of interest. Design and applications. In: International Conference onYou can also read