Scotiabank Mining Conference - November 30th - December 2, 2021 - Lundin Mining Corporation
←
→
Page content transcription
If your browser does not render page correctly, please read the page content below
Scotiabank Mining Conference
                                    November 30 th – December 2, 2021

TSX: LUN Nasdaq Stockholm: LUMI                                         Candelaria, Atacama Region, Chile
Cautionary Statements
Caution Regarding Forward-Looking Information and Non-GAAP Performance Measures
Certain of the statements made and information contained herein is “forward-looking information” within the meaning of applicable Canadian securities laws. All statements other than statements of historical facts included in this
document constitute forward-looking information, including but not limited to statements regarding the Company’s plans, prospects and business strategies; the Company’s guidance on the timing and amount of future production
and its expectations regarding the results of operations; expected costs; permitting requirements and timelines; timing and possible outcome of pending litigation; the results of any Preliminary Economic Assessment, Feasibility
Study, or Mineral Resource and Mineral Reserve estimations, life of mine estimates, and mine and mine closure plans; anticipated market prices of metals, currency exchange rates, and interest rates; the development and
implementation of the Company’s Responsible Mining Management System; the Company’s ability to comply with contractual and permitting or other regulatory requirements; anticipated exploration and development activities at
the Company’s projects; and the Company’s integration of acquisitions and any anticipated benefits thereof. Words such as “believe”, “expect”, “anticipate”, “contemplate”, “target”, “plan”, “goal”, “aim”, “intend”, “continue”, “budget”,
“estimate”, “may”, “will”, “can”, “could”, “should”, “schedule” and similar expressions identify forward-looking statements.

Forward-looking information is necessarily based upon various estimates and assumptions including, without limitation, the expectations and beliefs of management, including that the Company can access financing, appropriate
equipment and sufficient labor; assumed and future price of copper, nickel, zinc, gold and other metals; anticipated costs; ability to achieve goals; the prompt and effective integration of acquisitions; that the political environment in
which the Company operates will continue to support the development and operation of mining projects; and assumptions related to the factors set forth below. While these factors and assumptions are considered reasonable by
Lundin Mining as at the date of this document in light of management’s experience and perception of current conditions and expected developments, these statements are inherently subject to significant business, economic and
competitive uncertainties and contingencies. Known and unknown factors could cause actual results to differ materially from those projected in the forward-looking statements and undue reliance should not be placed on such
statements and information. Such factors include, but are not limited to: risks inherent in mining including but not limited to risks to the environment, industrial accidents, catastrophic equipment failures, unusual or unexpected
geological formations or unstable ground conditions, and natural phenomena such as earthquakes, flooding or unusually severe weather; uninsurable risks; global financial conditions and inflation; changes in the Company’s share
price, and volatility in the equity markets in general; volatility and fluctuations in metal and commodity prices; the threat associated with outbreaks of viruses and infectious diseases, including the COVID-19 virus; changing taxation
regimes; reliance on a single asset; delays or the inability to obtain, retain or comply with permits; risks related to negative publicity with respect to the Company or the mining industry in general; health and safety risks; exploration,
development or mining results not being consistent with the Company’s expectations; unavailable or inaccessible infrastructure and risks related to ageing infrastructure; actual ore mined and/or metal recoveries varying from
Mineral Resource and Mineral Reserve estimates, estimates of grade, tonnage, dilution, mine plans and metallurgical and other characteristics; risks associated with the estimation of Mineral Resources and Mineral Reserves and the
geology, grade and continuity of mineral deposits including but not limited to models relating thereto; ore processing efficiency; community and stakeholder opposition; information technology and cybersecurity risks; potential for
the allegation of fraud and corruption involving the Company, its customers, suppliers or employees, or the allegation of improper or discriminatory employment practices, or human rights violations; regulatory investigations,
enforcement, sanctions and/or related or other litigation; uncertain political and economic environments, including in Brazil and Chile; risks associated with the structural stability of waste rock dumps or tailings storage facilities;
estimates of future production and operations; estimates of operating, cash and all-in sustaining cost estimates; civil disruption in Chile; the potential for and effects of labor disputes or other unanticipated difficulties with or
shortages of labor or interruptions in production; risks related to the environmental regulation and environmental impact of the Company’s operations and products and management thereof; exchange rate fluctuations; reliance on
third parties and consultants in foreign jurisdictions; climate change; risks relating to attracting and retaining of highly skilled employees; compliance with environmental, health and safety laws; counterparty and credit risks and
customer concentration; litigation; risks inherent in and/or associated with operating in foreign countries and emerging markets; risks related to mine closure activities and closed and historical sites; changes in laws, regulations or
policies including but not limited to those related to mining regimes, permitting and approvals, environmental and tailings management, labor, trade relations, and transportation; internal controls; challenges or defects in title; the
estimation of asset carrying values; historical environmental liabilities and ongoing reclamation obligations; the price and availability of key operating supplies or services; competition; indebtedness; compliance with foreign laws;
existence of significant shareholders; liquidity risks and limited financial resources; funding requirements and availability of financing; enforcing legal rights in foreign jurisdictions; dilution; risks relating to dividends; risks associated
with acquisitions and related integration efforts, including the ability to achieve anticipated benefits, unanticipated difficulties or expenditures relating to integration and diversion of management time on integration; activist
shareholders and proxy solicitation matters; and other risks and uncertainties, including but not limited to those described in the “Risk and Uncertainties” section of the Annual Information Form and the “Managing Risks” section of
the Company’s MD&A for the year ended December 31, 2020, which are available on SEDAR at www.sedar.com under the Company’s profile. All of the forward-looking statements made in this document are qualified by these
cautionary statements. Although the Company has attempted to identify important factors that could cause actual results to differ materially from those contained in forward-looking information, there may be other factors that
cause results not to be as anticipated, estimated, forecast or intended and readers are cautioned that the foregoing list is not exhaustive of all factors and assumptions which may have been used. Should one or more of these risks
and uncertainties materialize, or should underlying assumptions prove incorrect, actual results may vary materially from those described in forward-looking information. Accordingly, there can be no assurance that forward-looking
information will prove to be accurate and forward-looking information is not a guarantee of future performance. Readers are advised not to place undue reliance on forward-looking information. The forward-looking information
contained herein speaks only as of the date of this document. The Company disclaims any intention or obligation to update or revise forward‐looking information or to explain any material difference between such and subsequent
actual events, except as required by applicable law.

This presentation may contain certain financial measures such as adjusted earnings, adjusted loss, EBITDA, free cash flow, net cash, net debt, adjusted operating cash and cash costs which have no standardized meaning within
generally accepted accounting principles under IFRS and therefore amounts presented may not be comparable to similar data presented by other mining companies. This data is intended to provide additional information and
should not be considered in isolation or as a substitute for measures or performance prepared in accordance with IFRS.
                                                                                                                                                                                                                                                  2
Note: All dollar amounts are in US dollars unless otherwise denoted.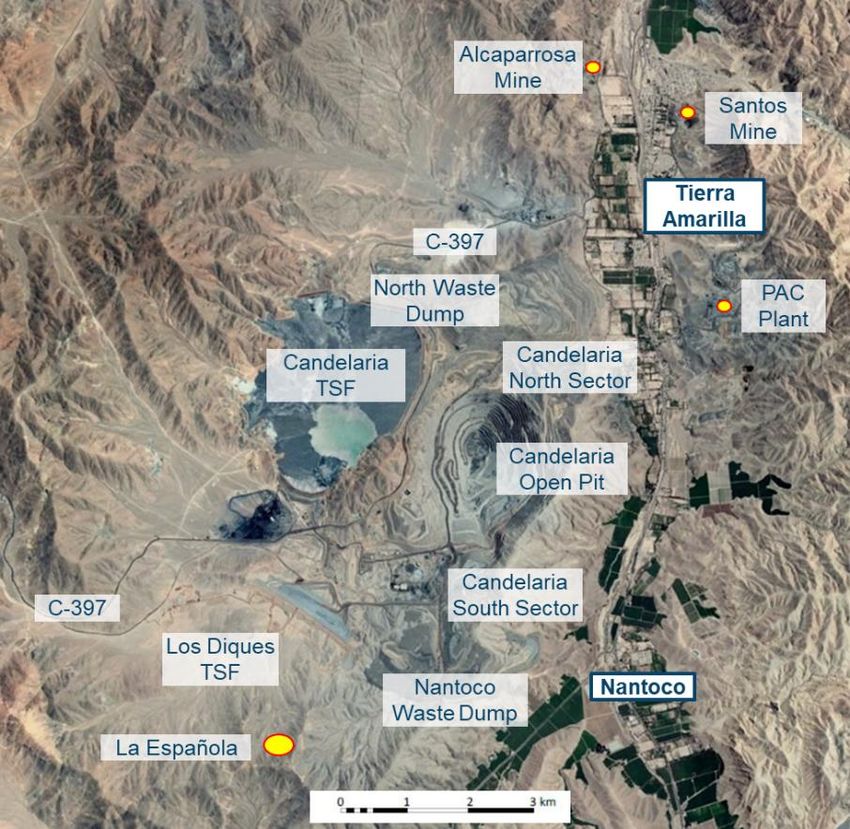
Lundin Mining
Our Strategy
Operate, upgrade and grow a base metals
portfolio that provides leading returns for our
shareholders throughout the cycle

  •    copper dominant
  •    competitive cost position
                                                                                      Eagle                                              Zinkgruvan
  •    low-risk mining jurisdictions                                         Nickel-Copper-PGMs in U.S.A.                           Zinc-Lead-Copper in Sweden

  •    pipeline of exploration and
       development projects
  •    low leverage and flexible balance
       sheet
  •    attractive direct shareholder returns

                                                                                                                                        Neves-Corvo
                                                                                                                                    Copper-Zinc-Lead in Portugal

                                                           Candelaria1
                                                       Copper-Gold-Silver in Chile                             Chapada
                                                                                                            Copper-Gold in Brazil

1. Lundin Mining holds an 80% interest in Candelaria
                                                                                                                                                                   3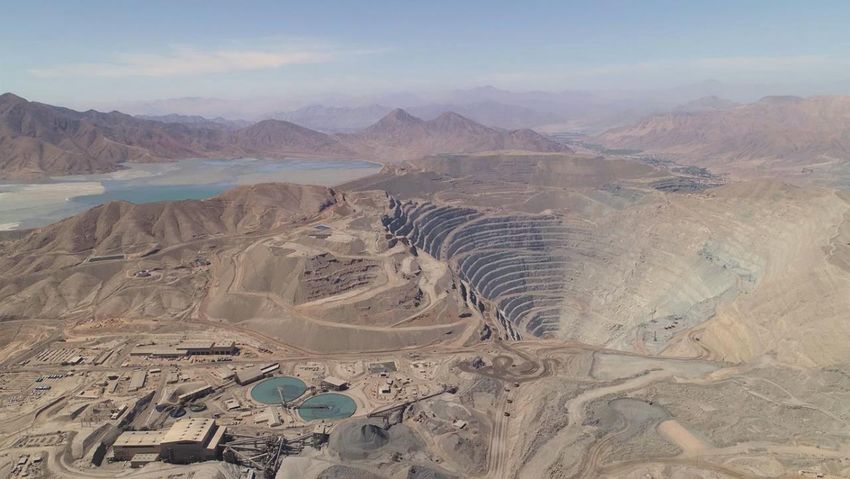
Responsible Mining
                     2020 Sustainability Report
                     •   have been reporting our sustainability performance in a comprehensive, standalone document
                         since 2010
                     •   prepared in accordance with the Global Reporting Initiative (GRI) Standards and broadly mapped
                         against the Sustainability Accounting Standards Board (SASB) Metals & Mining Standard
                     •   continue to define, integrate and embed sustainability pillars, key themes, performance
                         indicators and long-term targets

                     Highlights Include
                     •   achieved sustainable improvements in our safety, environmental and social performance in 2020
                     •   worked proactively to monitor the evolving COVID-19 pandemic and put appropriate and protective
                         measures in place. Worked closely with communities to identify needs and provide support
                     •   best-ever Company Total Recordable Injury Frequency rate of 0.55
                     •   formal adoption of the Global Industry Standard on Tailings Management
                     •   no Level 3 or above environmental incidents; 13% decrease in Level 2 incidents
                     •   steadily improved disclosure scoring annually in the CDP climate change report
                     •   formal Human Rights Standard complementing and enhancing pre-existing commitments
                     •   adoption of a formal Diversity and Inclusion Policy, including specific targets

                                   www.lundinmining.com/responsible-mining/sustainability-reports/

                                                                                                                      4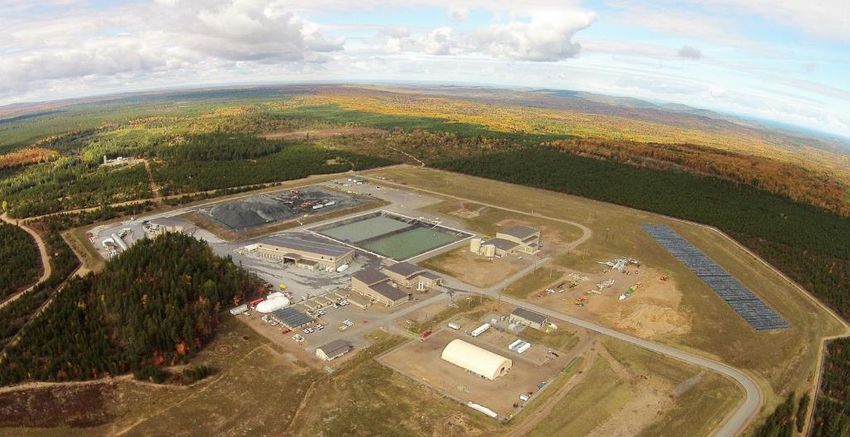
Q3/21 Summary Results
                                                                             Production           Payable Sales
                                                                             65,077 t of copper   61,334 t of copper

                                                                             38,769 t of zinc     28,559 t of zinc

                                                                             46,000 oz of gold    42,000 oz of gold

                                                                             4,124 t of nickel    3,246 t of nickel

                                                                             8,311 t of lead      5,824 t of lead

                                                                                        $756M in Sales

                                                                              Other
                                                                               5%
                                                                                                                Sweden
                                                                         Nickel                                   9%
                                                                          8%                            USA
                                                                  Zinc                                  13%
                                                                  9%
                                                                                                                           Chile
                                                                                      Copper                               43%
                                                                 Gold
                                                                                       69%           Portugal
                                                                  9%
                                                                                                       14%

                                                                                                                  Brazil
                                                                                                                  21%

              Neves-Corvo ZEP shaft upgrade work – August 2021

                                                                          By Metal                       By Jurisdiction
                                                                                                                                   5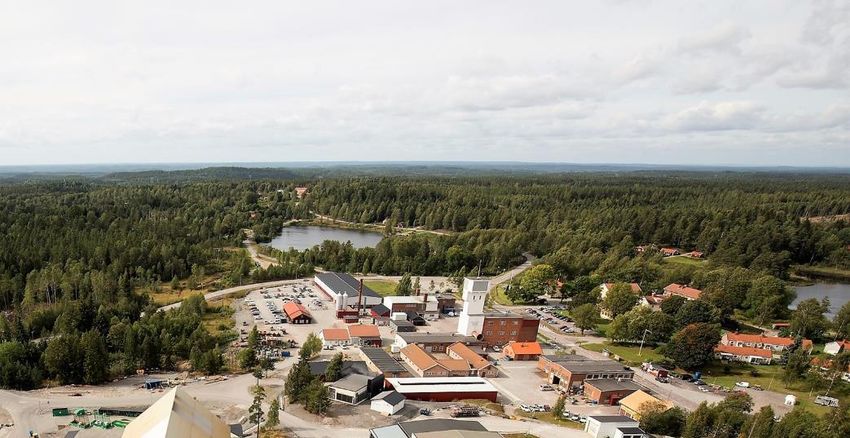
Candelaria
     Q3/21 Operational Performance on Plan
         •      production of 35,929 t of copper and approximately 20,000 oz of gold at a cash                                                                                     Copper, Gold Production & Cash Cost Outlook2
                cost of $1.62/lb copper                                                                                                                                                (100% basis; kt Cu, koz Au & $/lb Cu, net of by-product credits)
         •      2021 production and cash cost guidance reiterated; presently mining higher
                grades from open pit
                                                                                                                                                                                                                                                                         165-175
                                                                                                                                                                                                                  155-165
                                                                                                                                                                                                                                             150-160
     3-Year Outlook & Guidance                                                                                                                                                        150-155

     •        copper production to increase on improved
              grades and achievement of planned
              processing
     •        open pit ore mining to continue primarily
              from Phase 10, with initial contribution from                                                                                                                                                                                                90-95                       93-98
              Phase 11, in 2022                                                                                                                                                                     85-90                      83-88
     •        debottlenecking of pebble crushing circuit to
              increase mill capacity in early 2023                                                                                                                                            $1.55                      $1.55
     •        improvement in grade discrepancy in Q3/21
              and positive trend continuing in Q4/21
                                                                                                                                                                                              2021                       2022                        2023                        2024
     •        cash costs1 to approximate $1.55/lb of
              copper in 2022, after by-product credits
                                                                                                                                                                                                                                   Copper                 Gold
     •        2022 capital expenditures to total $370M
                                                                                                                                                                        2. Copper and gold production and cash cost guidance for 2021 is as outlined in the Management’s Discussion and Analysis for the quarter ended
     •        planned 2022 exploration expenditure of                                                                                                                      September 30, 2021, in the Outlook section. Guidance for 2022 through 2024 is as announced by news release entitled "Lundin Mining Provides
              $15M, including over 54,000 m of drilling                                                                                                                    Operational Outlook & Update" dated November 22, 2021. Currently, 68% of Candelaria’s total gold and silver production are subject to a
                                                                                                                                                                           streaming agreement and as such 2021 cash cost guidance is based on receipt of $416/oz and $4.16/oz on the streamed portion of gold and
                                                                                                                  Candelaria plant pebble crushing circuit                 silver sales, respectively. Cash cost guidance for 2022 is based on receipt of $420/oz and $4.20/oz on the streamed portion of gold and silver
                                                                                                                                                                           sales, respectively.

1.           This is a non-GAAP measure. For historical comparatives see the Historical Non-GAAP Measure Comparatives slide in this presentation. Please also see the
             Management’s Discussion and Analysis for the year ended December 31, 2020, for discussion of non-GAAP measures.
                                                                                                                                                                                                                                                                                                                6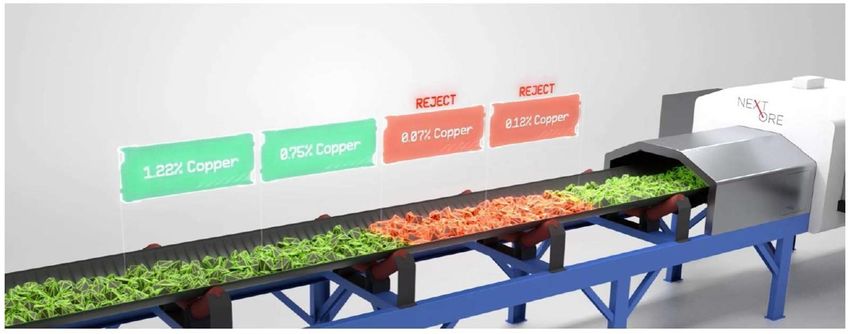
Pebble Crushing Debottlenecking

Basic Engineering Underway
•   crushed pebbles are being recirculated to the SAG mills, reducing amount of fresh ore
•   aim is to eliminate or reduce return of crushed pebbles to the SAG to increase plant throughput
•   basic engineering underway to:
        •   modify pebbles hopper and loading system to better distribute pebbles and optimize load
            across the three pebble crushers
        •   construct partial bypass of pebble ball mill so excess fine pebbles can be sent directly to the
            secondary grinding circuit of plant instead of being returned to the SAG mills
•   study work underway on conversion of existing pebble ball mill to rod mill
•   procurement and construction in 2022 with tie-in in 2023
•   capital costs of $15M within 2022 expenditure guidance

                                                                                                              Candelaria plant pebble crushing circuit

                                                                                                                                                         7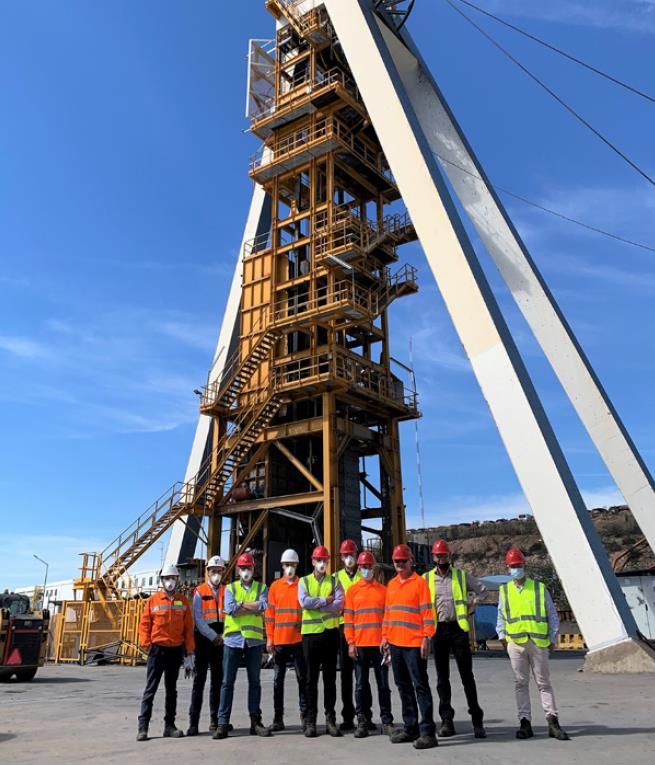
Mine-to-Mill Grade Discrepancy
•       improvement in Q3/21 over prior two quarters (i.e., less discrepancy) and positive trend continuing in Q4/21

Actions Taken                                                            Next Steps
                                                                          •   operational dilution tests
Open pit & underground mines
                                                                          •   volumetric scanners for haul trucks (pending Q4/21)
    •    sampling systems bias studies by external parties
                                                                          •   NextOre MRA trials to investigate grade estimation
    •    underground infill for short-term modelling
                                                                              compared to mined tonnes (installation early 2022)
    •    acquisition of rock breakers to support oversized ore
                                                                          •   upgrade of sampling system in mill
         reduction to improve mineral feed
    •    use of smart tag to monitor dilution

Mill
    •    modified sample preparation protocols
    •    rougher feed sampler position modified
    •    frequency of the primary sampler incremental modified
    •    reparation and modification on the multiplexor sampler
    •    concentrate sampling procedure on the trucks modified
    •    dedicated crew to clean and maintain mill sampling system

                                                                                                                                    Schematic of NextOre Magnetic Resonance Analyzer

                                                                                                                                                                                       8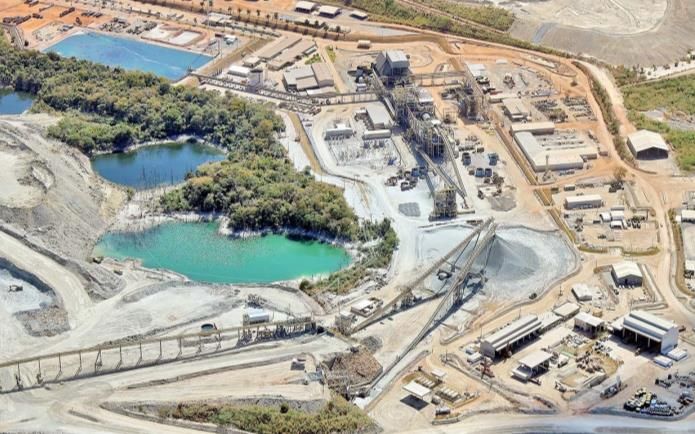
Chapada
Record Mill Throughput in Q3/21                                                                                                                                         Copper, Gold Production & Cash Cost Outlook2
•         production of 16,050 t of copper and 26,000 oz of gold at a cash cost of $0.62/lb of                                                                               (100% basis; kt Cu, koz Au & $/lb Cu, net of by-product credits)
          copper
•         record quarterly mill throughput at over 6.4 Mt, including monthly record of 2.3 Mt                                                                                              73-76                        70-75
          in August
                                                                                                                                                                                                                                                       65-70
                                                                                                                                                                                                                                                                                    60-65
3-Year Outlook & Guidance                                                                                                                                                                                    53-58
                                                                                                                                                                                                                                           50-55                         50-55
•         copper production consistent with prior outlook1; gold production guidance                                                                                           48-50
          increased for 2022
•         production expected to be modestly weighted to H2/22, primarily due to grade
          profile and seasonal operating considerations
•         YOY cash cost increase primarily reflecting higher consumable costs, lower
          stockpile values and FX assumption
 •        capital expenditures to total                                                                                                                                                                             $1.60
          $65M in 2022                                                                                                                                                                  $1.10
 •        planned 2022 exploration
          expenditure of $10M, including
          60,000 m of drilling
                                                                                                                                                                                       2021                         2022                          2023                         2024
 •        expansion studies ongoing to
          optimize life-of-mine value
                                                                                                                                                                                                                          Copper                  Gold

                                                                                                                                                              2.   Copper and gold production and cash cost guidance for 2021 is as outlined in the Management’s Discussion and Analysis for the quarter
                                                                                                                                                                   ended September 30, 2021, in the Outlook section. Guidance for 2022 through 2024 is as announced by news release entitled "Lundin Mining
                                                                                                                                                                   Provides Operational Outlook & Update" dated November 22, 2021. Chapada cash costs are calculated on a by-product basis and do not
                                                                                                                                                                   include the effects of its copper stream agreements. Effects of the copper stream agreements are reflected in copper revenue and will impact
                                                                                                                           Chapada Processing Plant                realized price per pound.

     1.    Prior production outlook for 2022 & 2023 as announced by news release entitled "Lundin Mining Provides Operational Outlook & Shareholder Returns                                                                                                                                           9
           Update" dated November 30, 2020.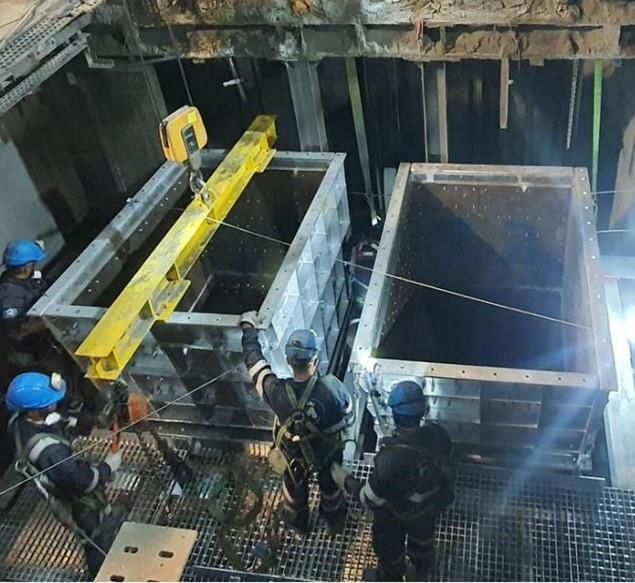
Chapada Exploration Drilling
                                                                                                                     Formiga
                                                                                                                     15 km north of Chapada plant
                   6 km
                                                             NM_438: 22.7 m @ 0.89% Cu; 0.24 g/t Au (75 m)
                                                             Including: 6.9 m @ 1.35% Cu; 0.27 g/t Au (79 m)

                                                                                                                                                Suruca
                                           3 km

                                                                                  Baru NE
          NM_427: 97.4 m @ 0.41% Cu; 0.32 g/t Au (287 m)
          Including 7.6 m @ 0.64% Cu; 0.50 g/t Au (314 m)
          Including 25.5 m @ 0.74% Cu; 0.57 g/t Au (350 m)
                                                                                              PLANT

                                                         Sucupira

                                                                                                   Buriti
SC_60: 50.0 m @ 0.40% Cu; 0.17 g/t Au (89 m)
                                                                                                                            BRT_107: 17.2 m @ 0.38% Cu; 0.33 g/t Au (24 m)
Including: 11.8 m @ 0.52% Cu; 0.25 g/t Au (103 m)
                                                                                                                            Including: 5.7 m @ 0.51% Cu; 0.48 g/t Au (35 m)
                                                                    Corpo Sul

                                                                   CS_584: 31.0 m @ 0.44% Cu; 0.59 g/t Au (215 m)
                                                                   Including: 21 m @ 0.50% Cu; 0.72 g/t Au (217 m)
            Santa Cruz
 1 Km

                                                                                                                                                                         10
Eagle
Cash Generation Continues
Nickel, Copper Production & Cash Cost Outlook1
• production of 4,124 t of nickel and 4,165 t of copper at cash cost of negative (kt & $/lb Ni, net of by-product credits)
$0.80/lb nickel in Q3/21
• generated nearly $245M of operating cash flow in first three quarters of 2021
18-20 18-20
3-Year Outlook & Guidance 15-18 15-18
• nickel and copper production is to be weighted to H2/22 primarily due to the 13-16
forecast grade profiles 12-15
• first quartile cash costs of negative $0.25/lb of nickel in 2022, considering significant 9-12 9-12
by-product copper credits; YOY increase primarily a reflection of lower volumes
• capital expenditures forecast to total $10M in 2022
• 2022 exploration expenditure of $2M
• Eagle East Keel zone ($0.25)
not currently included ($1.00)
in the Mineral Resource
• technical and economic
studies ongoing 2021 2022 2023 2024
• five extension targets
identified for drilling Nickel Copper
from underground in
2022
1. Nickel and copper production and cash cost guidance for 2021 is as outlined in the Management’s Discussion and Analysis for the quarter
ended September 30, 2021, in the Outlook section. Guidance for 2022 through 2024 is as announced by news release entitled "Lundin Mining
Provides Operational Outlook & Update" dated November 22, 2021.
11Neves-Corvo
Shaft Upgrades Completed Successfully
Copper, Zinc Production & Cash Cost Outlook2
• Q3/21 production of 8,083 t of copper, 15,909 t of zinc and 1,359 t of lead at a (kt & $/lb Cu, net of by-product credits)
cash cost of $2.05/lb of copper
• 2021 production and cash cost guidance reiterated 142-152 142-152
3-Year Outlook & Guidance
110-120
• copper production guidance increased for 2022 and 2023, compared to the
prior outlook
• zinc production to increase over 65% in 2022 as production ramp up from the
ZEP is completed in H1/22
67-70
• cash cost to improve to $1.80/lb of copper in
2022, after zinc and lead by-product credits;
improvement is primarily due to increased
zinc production volumes 36-38 33-38 35-40 35-40
• capital expenditures to total $125M in 2022:
− $30M expansionary1 to complete ZEP $2.10
− $95M sustaining1 $1.80
• 2022 exploration expenditure of $8M,
including over 32,000 m of drilling 2021 2022 2023 2024
Copper Zinc
2. Copper and zinc production and cash cost guidance for 2021 is as outlined in the Management’s Discussion and Analysis for the quarter ended
Chairman Visit – October 2021 September 30, 2021, in the Outlook section. Guidance for 2022 through 2024 is as announced by news release entitled "Lundin Mining Provides
Operational Outlook & Update" dated November 22, 2021.
1. This is a non-GAAP measure. For historical comparatives see the Historical Non-GAAP Measure Comparatives slide in this presentation. Please also see
the Management’s Discussion and Analysis for the year ended December 31, 2020, for discussion of non-GAAP measures.
12Neves-Corvo – ZEP Nearing Completion
Q3/21 Underground Progress Upcoming Works
• shaft shutdown upgrade successfully completed • complete service water piping installation
• materials handling mechanical installation completed, including crusher level • final commissioning of all electrical rooms
• conveyor belt installations, alignment and splicing works completed • complete remaining materials handling system works, commissioning and
handover to operations team
• all remaining excavation works commenced including dewater sump and
pump station gallery
Underground construction photos – Q3/21
Belt and pipe support installation work Transfer tower gearbox assembly Fire suppression installation in electrical Shaft upgrade mechanical works Shaft upgrade construction
completed control room
13Neves-Corvo – ZEP Nearing Completion
Q3/21 Surface Progress Upcoming Works
• cyclones construction and cold commissioning completed • complete hot commissioning of cyclones with operations team
• remaining works commenced, including flotation, filtration and tailings • finalize all flotation, filtration and tailings works
• 3rd tailings paste thickener commissioned
Surface construction photos – Q3/21
Cyclone energization and cold commissioning Zinc filtration drive system and filter press works 3rd tailings paste thickener commissioned
14Zinkgruvan
Continued Excellent Performance in Q3/21
Zinc Production & Cash Cost Outlook2
• production of 22,860 t of zinc, 850 t of copper and 6,952 t of lead at a cash cost of (kt & $/lb Zn, net of by-product credits)
$0.32/lb of zinc
• mine continued to perform well with grades above plan
85-90
83-88
3-Year Outlook & Guidance
78-83
• zinc production guidance increased over prior outlook on refinement of operating
plans; forecasting higher head grades and improved metal recoveries
• 2022 cash cost guidance of $0.55/lb of zinc, after copper and lead by-product credits 73-76
• capital expenditures to total $60M in 2022
• capital works underground
development, including the Dalby
orebody, equipment and TSF works
$0.65
• planned 2022 exploration
expenditure of $5M,
including over 20,000 m of $0.55
drilling
• primary focus on Mineral
Resource expansion at
Dalby and Nygruvan
2021 2022 2023 2024
2. Zinc production and cash cost guidance for 2021 is as outlined in the Management’s Discussion and Analysis for the quarter ended September 30,
2021, in the Outlook section. Guidance for 2022 through 2024 is as announced by news release entitled "Lundin Mining Provides Operational
Outlook & Update" dated November 22, 2021.
Zinkgruvan mine Isometric
152021 Guidance Summary1
Production C1 Cash
(contained metal in conc.) Cost2 Capital Expenditures ($M)
Copper (t) Candelaria (100%) 150,000 - 155,000 $1.553 Sustaining
Chapada 48,000 - 50,000 $1.103 Candelaria (100% basis) 325
Eagle 18,000 - 20,000
Chapada 55
Neves-Corvo 36,000 - 38,000 $2.103
Eagle 20
Zinkgruvan 3,000 - 4,000
Total 255,000 - 267,000 Neves-Corvo 60
Zinkgruvan 45
Zinc (t) Neves-Corvo 67,000 - 70,000 Total Sustaining 505
3
Zinkgruvan 73,000 - 76,000 $0.65
Total 140,000 - 146,000 ZEP (Neves-Corvo) 70
Total Capital Expenditures1,2 $575M
Gold (oz) Candelaria (100%) 85,000 - 90,000
Chapada 73,000 - 76,000
Total 158,000 - 166,000
• $40M to be invested in 2021 exploration programs;
$30M expended YTD
Nickel (t) Eagle 18,000 - 20,000 ($1.00)
• over 140,000 m of exploration drilling planned with
Total 18,000 - 20,000 focus on in and near-mine targets; nearly 114,000 m
completed YTD
1. Guidance as most recently reiterated and announced by news release on October 27, 2021.
2. Cash costs are based on various assumptions and estimates, including but not limited to production volumes, as noted above, commodity prices (Cu: $4.30/lb, Zn: $1.25/lb, Pb: $0.95/lb, and Au: $1,800/oz), foreign exchange rates (€/USD:1.20, USD/SEK:8.50,
CLP/USD:730 and USD/BRL:5.10) and operating costs for the remainder of 2021.
3. 68% of Candelaria's total gold and silver production are subject to a streaming agreement, and silver production at Zinkgruvan and Neves-Corvo are also subject to streaming agreements. Cash costs are calculated based on receipt of approximately $416/oz
gold and $4.16/oz to $4.48/oz silver. Chapada cash costs are calculated on a by-product basis and do not include the effects of its copper stream agreements. Effects of the copper stream agreements are reflected in copper revenue and will impact realized
price per pound.
162022 Guidance Summary1
Production
(contained metal in conc.) Cash Cost2 Capital Expenditures ($M)
Copper (t) Candelaria (100%) 155,000 - 165,000 $1.553 Sustaining Capital
Chapada 53,000 - 58,000 $1.603 Candelaria (100% basis) 370
Eagle 15,000 - 18,000 Chapada 65
3
Neves-Corvo 33,000 - 38,000 $1.80 Eagle 10
Zinkgruvan 2,000 - 3,000
Neves-Corvo 95
Total 258,000 - 282,000
Zinkgruvan 60
Total Sustaining Capital 600
Zinc (t) Neves-Corvo 110,000 - 120,000
Zinkgruvan 78,000 - 83,000 $0.553 Zinc Expansion Project (Neves-Corvo) 30
Total 188,000 - 203,000
Total Capital Expenditures2 $630M
Gold (oz) Candelaria (100%) 83,000 - 88,000
Chapada 70,000 - 75,000
Total 153,000 - 163,000 • $45M to be invested in 2022 exploration programs, including
over 170,000 m of drilling
Nickel (t) Eagle 15,000 - 18,000 ($0.25)
Total 15,000 - 18,000
1. Guidance as announced by news release entitled, "Lundin Mining Provides Operational Outlook & Update" dated November 22, 2021. For historical comparatives see the Historical Non-GAAP Measure Comparatives slide in this presentation. Please also see
the Management’s Discussion and Analysis for the year ended December 31, 2020, for discussion of cash cost, sustaining and expansionary capital expenditures non-GAAP measures.
2. Based on various assumptions and estimates, including but not limited to production volumes, as noted above, commodity prices (Cu: $3.90/lb, Zn: $1.15/lb, Pb: $0.90/lb, Au: $1,800/oz , and Ag: $25.00/oz), foreign exchange rates (€/USD:1.20, USD/SEK:8.20,
CLP/USD:700 and USD/BRL:5.10) and operating costs.
3. 68% of Candelaria's total gold and silver production are subject to a streaming agreement, and silver production at Zinkgruvan and Neves-Corvo are also subject to streaming agreements. Candelaria cash costs are calculated based on receipt of
approximately $420/oz of gold and $4.20/oz of silver in the year. Chapada cash costs are calculated on a by-product basis and do not include the effects of its copper stream agreements. Effects of the copper stream agreements are reflected in copper
revenue and will impact realized price per pound. 17Appendices
18Responsible Mining
Tailings Management
• employ a comprehensive and integrated approach to tailings management. This provides confidence that potential environmental and social impacts can
be reliably identified and minimized
• our Responsible Mining Management System includes a specific Tailings Management Technical Standard. This standard requires that each operation
ensure tailings facilities and major water-retention dams are planned, designed, constructed, operated, decommissioned and closed in such a manner that
they are stable. It also ensures that all aspects comply with regulatory requirements, conform to Company standards and accepted international practices
and adhere to any commitments made to local stakeholders
• Lundin Mining is committed to the implementation of the Global Industry Standard on Tailings Management (GISTM), which is the first global
standard on tailings management. Lundin Mining plans to be in full conformance with the GISTM within five years of August 5, 2020
A full list of tailings facilities that Lundin Mining manages, including information on tailings
Our Facilities management, construction method, maximum dam height and volume, can be found in
our Tailings Management Information Sheet in Our Approach to Tailings Management
• of the five Lundin Mining
operations, Eagle Mine is
the only operation that
does not have a
constructed tailings
impoundment with dams
• the five active tailings
facilities use various
construction techniques for
the main and secondary or
perimeter dams, but none
use upstream construction
• also maintains and
monitors six inactive/closed
tailings facilities
Cerro do Lobo Tailings Facility at Neves-Corvo in Portugal
19Responsible Mining
Climate Change, Energy and CHG Emissions
• recognize the need for effective approaches to managing climate-related responsibilities, especially in consideration of the remote locations in which we operate,
the energy-intensive nature of our industry, and the sometimes-limited availability of renewable energy in national energy supply
• scoped and developed a corporate climate change adaptation and mitigation planning toolkit that will enhance the resilience of our operations by formalizing site-
level, climate-related risk assessments for the development and prioritization of climate adaptation strategies
• Lundin Mining’s GHG emissions broadly correlate with our energy consumption trends. Our market-based Scope 2 emissions continue to benefit from
Zinkgruvan’s investment in a 100% renewable electricity supply since 2017 supported by a Guarantee of Origin. In the future, we will also realize the positive
effect of Candelaria’s contractual agreement with its supplier for an increase in renewables to a minimum of 80% in the energy mix, prioritizing wind and
solar energy, commencing in 2023
• decreasing trend in energy intensity and GHG emissions intensity,
per tonne rock mined, since 2016 has continued. Chapada has the
lowest intensity levels arising from the movement of significant
quantities of material over relatively short distances. Candelaria’s low
energy intensity levels also reflect the large tonnage of ore and waste
rock excavated. Our remaining underground operations do not benefit
from such efficiencies of scale, especially those located in colder
climates that require additional energy for heating
Retain an Above Average ‘B’ CDP Score
• we report annually to the CDP Climate Change and
Forestry programs, aligned with the Task Force on
Climate-related Financial Disclosures
• retained an above average ‘B’ score again in 2020,
a significant achievement within the context of a
North America regional average score of ‘D’ and a
metallic mineral mining sector average score of ‘C’
20Responsible Mining
Water Stewardship
• continue to make water stewardship gains, achieving measurable reductions in freshwater use and increases in water re-use in 2020
• committed to improvements in water assessment and management practices, evaluating water-use efficiency, initiatives to prevent unnecessary pressure
on shared resources and measures to minimize environmental and social impacts
• all operations continuously seek to improve their site water balances and water management plans, implementing comprehensive water management
planning processes
• future efforts in water management will include an increased focus on the resilience of site water management infrastructure, and processes and
procedures concerning the potential for more frequent and extreme weather events in changing climatic environments
Candelaria’s operational water requirements met entirely
through supply from its sea water desalination facility
• the operation maintains a strong
focus on water use efficiency
• use of treated municipal wastewater
ceased 2019, significantly earlier
than the 2027 regulatory
requirement, enabling these
resources to be redirected to other
uses in this water-scarce region
Candelaria desalination facility
www.lundinmining.com/responsible-mining
21Dividend Framework1
Peer-Leading Regular Dividend Dividend Payout (C$/share)
• regular dividend increased 50% to C$0.09/share per quarter or C$0.36/share annualized
Base Dividend Performance Dividend
• 125% increase over the December 2020 dividend payment
• sustainable throughout the cycle; declared and payable quarterly
C$0.54
Inaugural Performance Dividend
• H1/21 performance dividend of C$0.09 per share declared
Total dividend
• targeting a minimum return of 40% available cash flow, less regular dividend payments over prior six- yield of 5.4%2
annualized3 C$0.18
month period. Available cash flow is defined as operating cash flow after capital investments,
contingent payments and distributions to partners
• declared and payable semi-annually
H1/21 Performance Dividend Six Months Ended
June 30, 2021
Operating cash flow $578M
less capital investments $244M C$0.18
C$0.36
less contingent payments -
less distributions to partners $16M C$0.09
Available cash flow $318M
Target minimum return of 40% $127M
less regular dividend payments $71M
C$0.09
Performance dividend approximately $56M or C$0.09/sh
Q2/21 Annualized 3
1. Lundin Mining’s dividend framework is non-binding. Dividends are at the discretion of and to be declared by the Board of Directors.
Dividends Basis
2. Based on Lundin Mining’s November 26, 2021 closing share price of C$10.03 per share. 22
3. Presented on annualized basis for illustrative purposes only.Candelaria Complex – Mineral Resources and Mineral Reserves1
Ownership 80%
Location Region III, Chile
Mine life +20 years
2021 exploration budget $13M
P&P Copper Mineral Reserves 3,583 kt contained (675,574 kt at 0.53%)
M&I Copper Mineral Resources 7,854 kt contained (1,244,543 kt at 0.63%)
Inferred Copper Mineral Resources 740 kt contained (99,029 kt at 0.75%)
P&P Gold Mineral Reserves 2.7 Moz contained (675,574 kt at 0.12 g/t)
M&I Gold Mineral Resources 5.6 Moz contained (1,244,543 kt at 0.14 g/t)
Inferred Gold Mineral Resources 0.5 Moz contained (99,029 kt at 0.16 g/t)
P&P Silver Mineral Reserves 39 Moz contained (675,574 kt at 1.79 g/t)
M&I Silver Mineral Resources 83 Moz contained (1,244,543 kt at 2.1 g/t)
Inferred Silver Mineral Resources 7 Moz contained (99,029 kt at 2.3 g/t)
1. For more information please refer to the Company’s Technical Report for the Candelaria Copper
Mining Complex, November 28, 2018 and the Company’s news release dated September 13, 2021
entitled “Lundin Mining Announces 2021 Mineral Resource and Mineral Reserve Estimates” on the
Company’s website (www.lundinmining.com). See also slide 28.
Candelaria Copper Mining Complex 23Chapada – Mineral Resources and Mineral Reserves1
Ownership 100%
Location Goiás State, Brazil
Mine life +30 years
2021 exploration budget $16M
P&P Copper Mineral Reserves 1,710 kt contained (754,870 kt at 0.23%)
M&I Copper Mineral Resources 2,508 kt contained (1,075,009 kt at 0.23%)
Inferred Copper Mineral Resources 473 kt contained (209,102 kt at 0.23%)
P&P Gold Mineral Reserves 4.4 Moz contained (820,065 kt at 0.16 g/t)
M&I Gold Mineral Resources 7.3 Moz contained (1,222,526 kt at 0.18 g/t)
Inferred Gold Mineral Resources 0.7 Moz contained (221,667 kt at 0.10 g/t)
1. For more information please refer to the Company's Technical Report on the Chapada Mine,
Goiás State, Brazil dated October 10, 2019 and the Company’s news release dated September
13, 2021 entitled “Lundin Mining Announces 2021 Mineral Resource and Mineral Reserve
Estimates” on the Company’s website (www.lundinmining.com). Mineral Resources are based
on the summation of Chapada and Suruca gold only. See also slide 28.
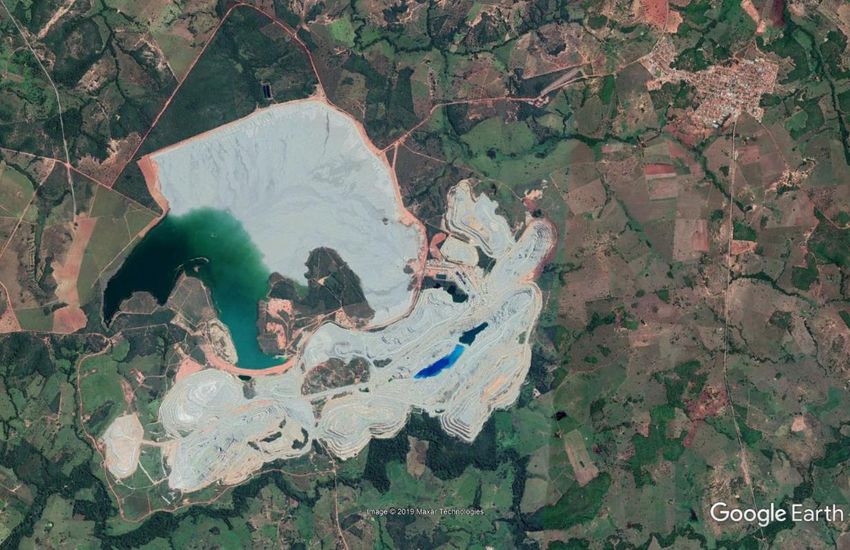
Source: Google Earth
24Eagle Mine – Mineral Resources and Mineral Reserves1
Ownership 100%
Location Michigan, USA
Mine life 5 years
P&P Nickel Mineral Reserves 77 kt contained (3,280 kt at 2.4%)
M&I Nickel Mineral Resources 83 kt contained (3,055 kt at 2.7%)
P&P Copper Mineral Reserves 64 kt contained (3,280 kt at 1.9%)
M&I Copper Mineral Resources 68 kt contained (3,055 kt at 2.2%)
Inferred Nickel Mineral Resources - kt contained (18 kt at 1.0%)
Inferred Copper Mineral Resources - kt contained (18 kt at 1.0%)
1. For more information please refer to the Company’s Technical Report on the Eagle Mine dated
April 26, 2017 and the Company’s news release dated September 13, 2021 entitled “Lundin
Mining Announces 2021 Mineral Resource and Mineral Reserve Estimates” on the Company’s
website (www.lundinmining.com). See also slide 28.
Eagle Mine
25Neves-Corvo – Mineral Resources and Mineral Reserves1
Ownership 100%
Location Alentejo region, Portugal
Mine life +10 years
2021 exploration budget $4M
P&P Zinc Mineral Reserves 1,858 kt contained (24,774 kt at 7.5%)
M&I Zinc Mineral Resources 4,702 kt contained (68,352 kt at 6.9%)
Inferred Zinc Mineral Resources 230 kt contained (4,071 kt at 5.7%)
P&P Copper Mineral Reserves 537 kt contained (25,090 kt at 2.1%)
M&I Copper Mineral Resources 1,370 kt contained (60,008 kt at 2.3%)
Inferred Copper Mineral Resources 231 kt contained (12,681 kt at 1.8%)
Inferred Semblana Copper Mineral Resources 223 kt contained (7,807 kt at 2.9%)
1. For more information refer to the NI 43-101 Technical Report for the Neves-Corvo Mine,
Portugal dated June 23, 2017 and the Company’s news release dated September 13, 2021
Schematic of Neves-Corvo Mine highlighting ZEP development and mining areas entitled “Lundin Mining Announces 2021 Mineral Resource and Mineral Reserve Estimates” on
the Company’s website (www.lundinmining.com). See also slide 28.
26Zinkgruvan – Mineral Resources and Mineral Reserves1
Ownership 100%
Location Askersund, Sweden
Mine life +10 years
2021 exploration budget $6M
P&P Zinc Mineral Reserves 808 kt contained (10,270 kt at 7.9%)
M&I Zinc Mineral Resources 1,644 kt contained (20,338 kt at 8.1%)
Inferred Zinc Mineral Resources 1,136 kt contained (14,194 kt at 8.0%)
P&P Copper Mineral Reserves 45 kt contained (2,214 kt at 2.0%)
M&I Copper Mineral Resources 86 kt contained (4,011 kt at 2.1%)
Inferred Copper Mineral Resources 4 kt contained (217 kt at 1.7%)
1. For more information please refer to the Company’s Technical Report entitled NI 43-
101 Technical Report for the Zinkgruvan Mine, Central Sweden dated November 30,
2017 and the Company’s news release dated September 13, 2021 entitled “Lundin
Mining Announces 2021 Mineral Resource and Mineral Reserve Estimates” on the
Company’s website (www.lundinmining.com). See also slide 28.
Zinkgruvan Mine
27NI 43-101 Compliance Unless otherwise indicated, Lundin Mining Corporation (the “Company”) has prepared the technical information in this presentation including Mineral Reserve and Mineral Resource estimates (“Technical Information”) based on information contained in the technical reports and news releases (collectively the “Disclosure Documents”) available under the Company’s profile on SEDAR at www.sedar.com. Each Disclosure Document was prepared by or under the supervision of a qualified person (“Qualified Person”) as defined in National Instrument 43-101 – Standards of Disclosure for Mineral Projects of the Canadian Securities Administrators (“NI 43-101”). For readers to fully understand the information in this presentation, they should read the technical reports identified below in their entirety, including all qualifications, assumptions and exclusions that relate to the information set out in this presentation which qualifies the Technical Information. Readers are advised that Mineral Resource estimates that are not Mineral Reserves do not have demonstrated economic viability. The Disclosure Documents are each intended to be read as a whole, and sections should not be read or relied upon out of context. The Technical Information is subject to the assumptions and qualifications contained in the Disclosure Documents. The Technical Information in this presentation has been prepared in accordance NI 43-101 and has been reviewed and approved by Jeremy Weyland, P.Eng., Acting Vice President, Technical Services of the Company, a "Qualified Person" under NI 43-101. Mr. Weyland has verified the data disclosed in this presentation and no limitations were imposed on his verification process. Mineral Resource and Mineral Reserve estimates of the Company are shown on a 100 percent basis for each mine. The Measured and Indicated Mineral Resource estimates are inclusive of those Mineral Resource estimates modified to produce the Mineral Reserve estimates. All estimates of the Company are prepared as at June 30, 2021. Estimates for all operations are prepared by or under the supervision of a Qualified Person as defined in NI 43-101 or have been audited by independent Qualified Persons on behalf of the Company. The technical and scientific information has been prepared in accordance with NI 43-101 and has been reviewed and verified by Graham Greenway, P.Geo, Group Resource Geologist, Lundin Mining, who is a "Qualified Person” under NI 43-101. Mineral Reserves for all active mines have been estimated using metal prices of US$3.00/lb copper, US$1.00/lb zinc, US$0.95/lb lead, US$6.50/lb nickel and US$1,500/oz gold. Exchange rates used were EUR/USD 1.25, USD/SEK 7.50, USD/CLP 620 and USD/BRL 4.25. For the Suruca gold deposit Mineral Reserve, the metal prices used were US$3.00/lb copper and US$1,250/oz gold and an exchange rate of USD/BRL 3.95. Candelaria and La Española open pit Mineral Resource estimates are reported within a conceptual pit shell based on metal prices of US$3.45/lb copper and US$1,500/oz gold with cut-off grades of 0.15% and 0.17% copper, respectively. Candelaria underground Mineral Resources are estimated at a cut-off grade of 0.45% copper within confining grades shells of 0.4% copper. Mineral Reserves for the Candelaria open pit, Española open pit and underground for the Candelaria property are estimated at cut-off grades of 0.16%, 0.19% and 0.50% copper, respectively. Underground Mineral Reserves for the Ojos del Salado property, Santos and Alcaparrosa mines, are estimated at cut-off grades of 0.55% copper and 0.60% copper respectively. Chapada and Suruca SW copper-gold Mineral Resource estimates are reported within a conceptual pit shell based on metal prices of US$3.45/lb copper and US$1,725/oz gold and at a variable Net Smelter Return (NSR) marginal cut-off averaging US$5.15 per tonne. For the Suruca gold only Mineral Resource estimates, cut-off grades of 0.16g/t gold for oxides and 0.23g/t for sulphides were used. Mineral Reserves for the Chapada open pit are estimated at a NSR cut-off of US$5.15 per tonne. For the Suruca gold only Mineral Reserve estimates cutoff grades of 0.19g/t gold for oxides and 0.30g/t for sulphides are used. Eagle Mineral Resources and Reserves are reported above a fixed NSR cut-off of US$123/t. The Eagle East Mineral Resources are reported within constraining grade shells based on a fixed NSR cut-off of US$142/t and the Mineral Reserves are reported above US$142/t for long-hole stopes and US$152/t for cut-and-fill stopes. The NSR is calculated on a recovered payable basis considering nickel, copper, cobalt, gold and PGM grades, metallurgical recoveries, prices and realization costs. The Neves-Corvo Mineral Resources are reported within geological volumes based on a nominal NSR copper cut-off value of EUR 32.85/t (grade equivalent to 1.0% copper), and the zinc Mineral Resources are reported within geological volumes based on a nominal NSR zinc cut-off value of EUR 30.55/t (grade equivalent to 4.5% zinc). The Neves-Corvo copper and zinc Mineral Reserve estimates have been calculated using variable NSR values based on area and mining method. The NSR is calculated on a recovered payable basis considering copper, lead, zinc and silver grades, metallurgical recoveries, prices and realization costs. The Neves-Corvo copper Mineral Reserves are estimated above a site average cut‐off of EUR 44.4/t (grade equivalent to 1.41% copper). For Neves-Corvo zinc Mineral Reserve estimates a site average cut‐off of EUR 45.4/t (grade equivalent to 5.40% zinc) is used. The Mineral Resources at Semblana are estimated above a cut-off grade of 1.0% copper. The Zinkgruvan zinc Mineral Resources are estimated within optimized stope volumes, using a 3.5 m minimum mining width, based on an area dependent marginal NSR cut-off between SEK 475/t and SEK 540/t. The Zinkgruvan copper Mineral Resource estimates are reported within optimized stope volumes above a cut-off NSR values of SEK 475/t. The Zinkgruvan zinc and copper Mineral Reserves are estimated above area-dependent full-cost breakeven NSR cut-off values of between SEK 665/t and SEK 845/t NSR. The NSR is calculated on a recovered payable basis considering copper, lead, zinc and silver grades, metallurgical recoveries, prices and realization costs. Refer to the Company’s news release dated September 13, 2021 entitled “Lundin Mining Announces 2021 Mineral Resource and Mineral Reserve Estimates” on the Company’s website at www.lundinmining.com. For further Technical Information on the Company’s material properties, refer to the following technical reports, each of which is available on the Company’s SEDAR profile at www.sedar.com: Candelaria: technical report entitled Technical Report for the Candelaria Copper Mining Complex, Atacama Region, Region III, Chile dated November 28, 2018. Chapada: technical report entitled Technical Report on the Chapada Mine, Goiás State, Brazil dated October 10, 2019 Neves-Corvo: technical report entitled NI 43-101 Technical Report for the Neves-Corvo Mine, Portugal dated June 23, 2017. Zinkgruvan: technical report entitled NI 43-101 Technical Report for the Zinkgruvan Mine, Central Sweden dated November 30, 2017. Eagle Mine: technical report entitled Technical Report on the Eagle Mine, Michigan, U.S.A. dated April 26, 2017. 28
Historical Non-GAAP Measure Comparatives

     Cash Cost1                         2020                Capital Expenditures ($ millions)                                                 2020
     Copper
                                                            Sustaining Capital1
      Candelaria                       $1.45
                                                              Candelaria (100% basis)                                                           216
      Chapada                          $0.29
                                                              Chapada                                                                             39
      Neves-Corvo                      $2.09
                                                              Eagle                                                                               11
     Zinc
      Zinkgruvan                       $0.52                  Neves-Corvo                                                                         63

     Nickel                                                   Zinkgruvan                                                                          37
      Eagle                            $0.10                  Total Sustaining Captial                                                          367

                                                              Zinc Expansion Project (Neves-Corvo)1                                               63

                                                            Total Capital Expenditures                                                     $430M

1.    This is a non-GAAP measure. See the Management’s Discussion and Analysis for the year ended December 31, 2020, for discussion of non-GAAP measures.

                                                                                                                                                            29
www.lundinmining.com | TSX: LUN | Nasdaq Stockholm: LUMI
You can also read


