Investor Presentation February 2018 - TSX: CG www.centerragold.com - Centerra Gold
←
→
Page content transcription
If your browser does not render page correctly, please read the page content below
Investor Presentation
February 2018           TSX: CG
                        www.centerragold.com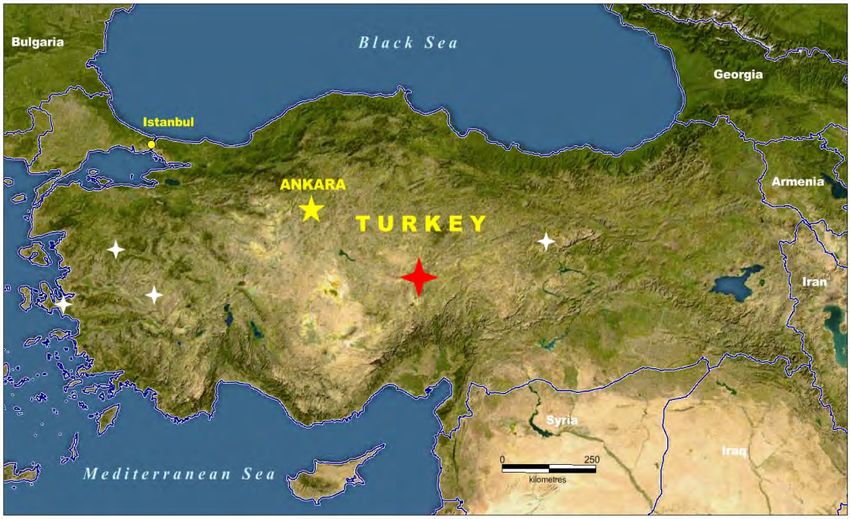
Caution Regarding Forward-Looking Information
Information contained in this presentation which are not statements of historical facts, and the documents incorporated by reference herein, may be “forward-looking information” for the purposes of Canadian securities laws. Such
forward-looking information involves risks, uncertainties and other factors that could cause actual results, performance, prospects and opportunities to differ materially from those expressed or implied by such forward looking
information. The words “believe”, “expect”, “anticipate”, “contemplate”, “plan”, “intends”, “continue”, “budget”, “estimate”, “may”, “will”, “schedule”, “understand” and similar expressions identify forward-looking information. These
forward-looking statements relate to, among other things: the development activities at the Öksüt Project and the Kemess Project; further amendments of Mount Milligan’s Environmental Certificate; currency movements and hedging
transactions; operational plans at Kumtor and Mount Milligan in 2018, including as to the expected restart of the Mount Milligan mill, the timing and outcomes of projects initiated at the Mount Milligan mine aimed at improving metal
recovery and other opportunities, the availability of water and consultations with regulatory and First Nations groups; discussions between GGM and First Nations groups regarding impact benefit agreements; the closing of the Strategic
Agreement entered into with the Kyrgyz Republic Government and the related resolution of various civil and criminal cases in the Kyrgyz Republic which affect the Kumtor Project; the Company’s cash on hand, working capital, future
cash flows and existing credit facilities being sufficient to fund anticipated operating cash requirements; AMT refund; the resumption of negotiations with the Mongolian Government related to the Gatsuurt Project; the timing for receipt
of proceeds from the sale of the ATO licenses; and statements found under the heading, “2018 Outlook”, including forecast 2018 production costs, capital and exploration expenditures and taxes.
Forward-looking information is necessarily based upon a number of estimates and assumptions that, while considered reasonable by Centerra, are inherently subject to significant political, business, economic and competitive
uncertainties and contingencies. Known and unknown factors could cause actual results to differ materially from those projected in the forward looking information. Factors that could cause actual results or events to differ materially
from current expectations include, among other things: (A) strategic, legal, planning and other risks, including: political risks associated with the Company’s operations in the Kyrgyz Republic and Canada; risks that any of the conditions
precedent to the Strategic Agreement will not be satisfied in a timely manner or at all, particularly as the Government may not bind the General Prosecutor’s Office or the Parliament of the Kyrgyz Republic; a decision by the General
Prosecutor’s Office, or its successor the Anti-Corruption Service of the State Committee for National Security, to re-open at any time civil or criminal proceedings against Centerra, its subsidiaries or other stakeholders; the failure of the
Government to comply with its continuing obligations under the Strategic Agreement, including the requirement that it comply at all times with its obligations under the Kumtor Project Agreements, allow for the continued operation of
the Kumtor Mine by KGC and KOC and not take any expropriatory action; actions by the Government or any state agency or the General Prosecutor's Office that serve to restrict or otherwise interfere with the payment of funds by KGC
and KOC to Centerra; resource nationalism including the management of external stakeholder expectations; the impact of changes in, or to the more aggressive enforcement of, laws, regulations and government practices, including
with respect to the environment, in the jurisdictions in which the Company operates including any delays or refusals to grant required permits and licenses, unjustified civil or criminal action against the Company, its affiliates or its
current or former employees; risks that community activism may result in increased contributory demands or business interruptions; the impact of any actions taken by the Kyrgyz Republic Government and Parliament relating to the
Kumtor Project Agreements which are inconsistent with the rights of Centerra and KGC under the Kumtor Project Agreements; any impact on the purported cancellation of Kumtor’s land use rights at the Kumtor Project; the risks
related to other outstanding litigation affecting the Company’s operations in the Kyrgyz Republic and elsewhere; the impact of the delay by relevant government agencies to provide required approvals, expertises and permits; potential
impact on the Kumtor Project of investigations by Kyrgyz Republic instrumentalities; the terms pursuant to which the Mongolian Government will participate in, or to take a special royalty rate in, the Gatsuurt Project; the impact of
constitutional changes in Turkey; the impact of any sanctions imposed by Canada, the United States or other jurisdictions against various Russian individuals and entities; the ability of the Company to successfully negotiate agreements
for the development of the Gatsuurt Project; potential defects of title in the Company’s properties that are not known as of the date hereof; the inability of the Company and its subsidiaries to enforce their legal rights in certain
circumstances; the presence of a significant shareholder that is a state-owned company of the Kyrgyz Republic; risks related to anti-corruption legislation; risks related to the concentration of assets in Central Asia; Centerra’s future
exploration and development activities not being successful; Centerra not being able to replace mineral reserves; Aboriginal claims and consultative issues relating to the Company’s properties which are in proximity to Aboriginal
communities; and potential risks related to kidnapping or acts of terrorism; (B) risks relating to financial matters, including: sensitivity of the Company’s business to the volatility of gold, copper and other mineral prices, the use of
provisionally-priced sales contracts for production at Mount Milligan, reliance on a few key customers for the gold-copper concentrate at Mount Milligan, use of commodity derivatives, the imprecision of the Company’s mineral reserves
and resources estimates and the assumptions they rely on, the accuracy of the Company’s production and cost estimates, the impact of restrictive covenants in the Company’s credit facilities which may, among other things, restrict the
Company from pursuing certain business activities or making distributions from its subsidiaries, the Company’s ability to obtain future financing, the impact of global financial conditions, the impact of currency fluctuations, the effect of
market conditions on the Company’s short-term investments, the Company’s ability to make payments including any payments of principal and interest on the Company’s debt facilities depends on the cash flow of its subsidiaries; and
(C) risks related to operational matters and geotechnical issues and the Company’s continued ability to successfully manage such matters, including the movement of the Davidov Glacier, waste and ice movement and continued
performance of the buttress at the Kumtor Project; the occurrence of further ground movements at the Kumtor Project and mechanical availability; the ability of the Company to successfully re-start full mill processing operation at
Mount Milligan and achieve expected throughput; the success of the Company’s future exploration and development activities, including the financial and political risks inherent in carrying out exploration activities; inherent risks
associated with the use of sodium cyanide in the mining operations; the adequacy of the Company’s insurance to mitigate operational risks; mechanical breakdowns; the Company’s ability to replace its mineral reserves; the occurrence
of any labour unrest or disturbance and the ability of the Company to successfully re-negotiate collective agreements when required; the risk that Centerra’s workforce may be exposed to widespread epidemic; seismic activity in the
vicinity of the Company’s properties; long lead times required for equipment and supplies given the remote location of some of the Company’s operating properties; reliance on a limited number of suppliers for certain consumables,
equipment and components; illegal mining on the Company’s Mongolian properties; the Company’s ability to accurately predict decommissioning and reclamation costs; the Company’s ability to attract and retain qualified personnel;
competition for mineral acquisition opportunities; and risks associated with the conduct of joint ventures/partnerships; the Company’s ability to manage its projects effectively and to mitigate the potential lack of availability of
contractors, budget and timing overruns and project resources. See section titled “Risks that can affect our business” in the most recently filed Annual Information Form available on SEDAR at www.sedar.com.
Furthermore, market price fluctuations in gold and copper, as well as increased capital or production costs or reduced recovery rates may render ore reserves containing lower grades of mineralization uneconomic and may ultimately
result in a restatement of reserves. The extent to which resources may ultimately be reclassified as proven or probable reserves is dependent upon the demonstration of their profitable recovery. Economic and technological factors
which may change over time always influence the evaluation of reserves or resources. Centerra has not adjusted mineral resource figures in consideration of these risks and, therefore, Centerra can give no assurances that any mineral
resource estimate will ultimately be reclassified as proven and probable reserves. Mineral resources are not mineral reserves, and do not have demonstrated economic viability, but do have reasonable prospects for economic
extraction. Measured and indicated resources are sufficiently well defined to allow geological and grade continuity to be reasonably assumed and permit the application of technical and economic parameters in assessing the economic
viability of the resource. Inferred resources are estimated on limited information not sufficient to verify geological and grade continuity or to allow technical and economic parameters to be applied. Inferred resources are too
speculative geologically to have economic considerations applied to them to enable them to be categorized as mineral reserves. There is no certainty that mineral resources of any category can be upgraded to mineral reserves
through continued exploration.
There can be no assurances that forward-looking information and statements will prove to be accurate, as many factors and future events, both known and unknown could cause actual results, performance or achievements to vary or
differ materially, from the results, performance or achievements that are or may be expressed or implied by such forward-looking statements contained herein or incorporated by reference. Accordingly, all such factors should be
considered carefully when making decisions with respect to Centerra, and prospective investors should not place undue reliance on forward looking information. Forward-looking information is as of February 23, 2018. Centerra
assumes no obligation to update or revise forward looking information to reflect changes in assumptions, changes in circumstances or any other events affecting such forward-looking information, except as required by applicable law.
Except as otherwise noted herein, Gordon Reid, Professional Engineer and Centerra’s Vice President and Chief Operating Officer, has reviewed and approved the scientific and technical information contained in this presentation. Mr.
Reid is a Qualified Person within the meaning of NI 43-101. For more information, please refer to the properties technical reports, which are available on SEDAR. All figures are in United States dollars unless otherwise stated.
February 2018                                                                                                                                                                                                                                   2
Centerra: Built For Success
                               Corporate Highlights                                                                                           Consensus Asset NAV Breakdown

             Internationally Diversified Gold Producer                                                                                                        Mongolia U.S. Australia
                                                                                                                                                                 2% 2%        1%
                                                                                                                                                          Turkey
                                                                                                                                                           9%
             Two Cornerstone Lower-Cost Quartile Assets

             2017 Gold Production 785koz at AISC1 of $688 per ounce
             and 53.6M lbs of copper                                                                                                                                                                 Canada
                                                                                                                                                   Kyrgyz                                             53%
             January 2018, completed acquisition of AuRico Metals;                                                                                Republic
             received Öksüt pastureland permit and IIC2                                                                                             33%

             Significant Operational Cash Flow Profile
                                                                                                                                                  Cash Reserves3 Profile (US$)
             Solid Late-Stage Development Pipeline                                                                                 1,000                                                                              2,000

                                                                                                                                    800                                                                               1,600
             Cash Position of US$417MM3

                                                                                                                                                                                                                              Gold Price (US$/oz)
                                                                                                                    US$ Millions    600                                                                               1,200

             Trading at a Discount to Peers, Potential for Re-Rating
                                                                                                                                    400                                                                               800

             Positive Retained Earnings of US$1,066MM3                                                                              200                                                                               400

             Expected 2018 production of up to 715kozpa gold at AISC1                                                                 0                                                                               0
                                                                                                                                           2004 2005 2006 2007 2008 2009 2010 2011 2012 2013 2014 2015 2016 2017
             of $799 to $885 per ounce and 47 to 52M lbs of copper
                                                                                                                                                Cumulative Dividends           Cash Balance 3           Gold Price
 1.   All-in sustaining costs per ounce sold (AISC) is a non-GAAP measure discussed under “Non-GAAP Measures” in the Company’s MDA & news release Feb. 23, 2018. 2018e AISC: Kumtor $733 to $815/oz, Mount Milligan $806 to $888/oz.
 2.   Refer to Company’s news releases January 8, 11 and February 12, 2018.
 3.   As at December 31, 2017.
February 2018                                                                                                                                                                                                                                       3
Centerra: 2017 Corporate Update
        2017: Internally Funded Business (US$MM’s)                                                                                                Liquidity Profile (US$MM’s)
 800                                          188             209
 700
 600                          127                                               98
 500            409                                                                            417                                                                                $3353
 400                                                                                                                                                             US$630MM
 300                                                                                                                                                 $2952
 200
 100
    0                   1                                                                                1

          2016 Cash Mt Milligan Kumtor FCF    Debt      Other                               2017 Cash
                       FCF                 Repayments (Projects,                                                                                                                                                3
                                                                                                                                                Cash Reserves 2                  Undrawn Credit Facilities
                                                      G&A, etc)

           Positive Net Cash Position1 (US$MM’s)                                                                                            Retained Earnings Profile (US$)
                                                                            119
  125
                                                                                                                                1,400                                                                               2,000
  100
   75                                                                                                                           1,200
                                                                                                                                                                                                                    1,600
   50                                                                                                                           1,000

                                                                                                                                                                                                                            Gold Price (US$/oz)
   25                                                                                                                                                                                                               1,200
                                                                                                                                 800
    0
                                                                                                                 US$ Millions

                                                                                                                                 600
  (25)                                                           Cash                                                                                                                                               800
  (50)                                                     $542MM                                                                400
                                                                                                                                                                                                                    400
  (75)                                                                                                                           200
 (100)
                             (96)                                                                                                  0                                                                                0
 (125)                                                                                                                                  2004 2005 2006 2007 2008 2009 2010 2011 2012 2013 2014 2015 2016 2017

                             2016                                          2017                                                            Retained Earnings           Cumulative Dividends          Gold Price
                 1
                   Includes cash and cash equivalents, restricted cash and short-term investments at December 31, 2016 and at December 31, 2017.
                 2
                   Represents the Company’s cash position at December 31, 2017 of $417 million, less approximately $122 million of cash utilized as part of the acquisition of AuRico Metals Inc. on January 8, 2018.
February 2018    3
                   A combination of the $150MM undrawn Öksüt credit facility as at December 31, 2017 and the $185MM undrawn amount from the new corporate credit facility, see news release February 1, 2018.                                     4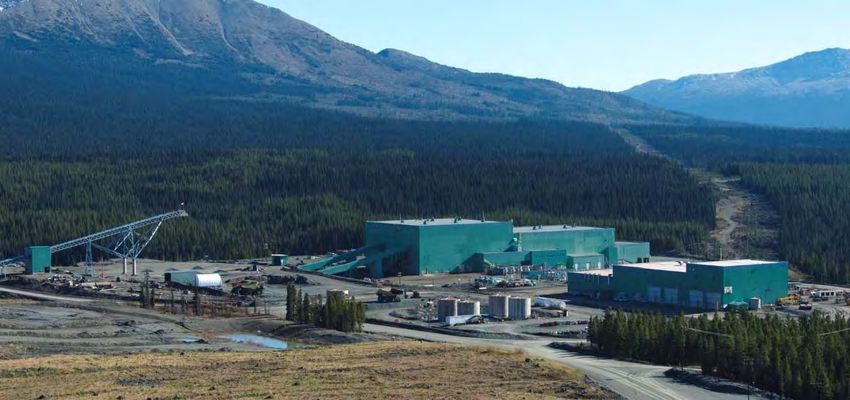
Centerra: Full Year Actuals vs Guidance Revision
Mid-Point Gold Production (oz’s)
Guidance Highlights 795,0001 785,000
755,000
750,000
650,000
Gold Production – 785,000 ounces exceeded
original guidance, within revised guidance range
550,000
450,000
All-In Sustaining Costs2 – Outperformed low-end of 350,000
revised guidance by 2%
250,000
Original Guidance Q3 Revised Actual
2017 All-In Sustaining Costs2 (US$/oz) Mid-Point All-In Sustaining Costs2 (US$/oz)
1,100
1,065
1,018 800 784
940 943 946 965
940
900 916 932 723
760 688
700
688
600
500
Original Guidance Q3 Revised Actual
Centerra New Gold Eldorado Yamana Acacia B2Gold Alamos Semafo Kinross SSR IAMGOLD Detour Tahoe
Gold Mining Gold Gold Gold Resources
(1) On December 27, 2017, the Company announced gold production of approximately 225,000 ounces at Mount Milligan and approximately 560,000 ounces at Kumtor.
February 2018 (2) Non-GAAP measure and is discussed under “Non-GAAP Measures” in the Company’s MD&A and the news release February 23, 2018. 5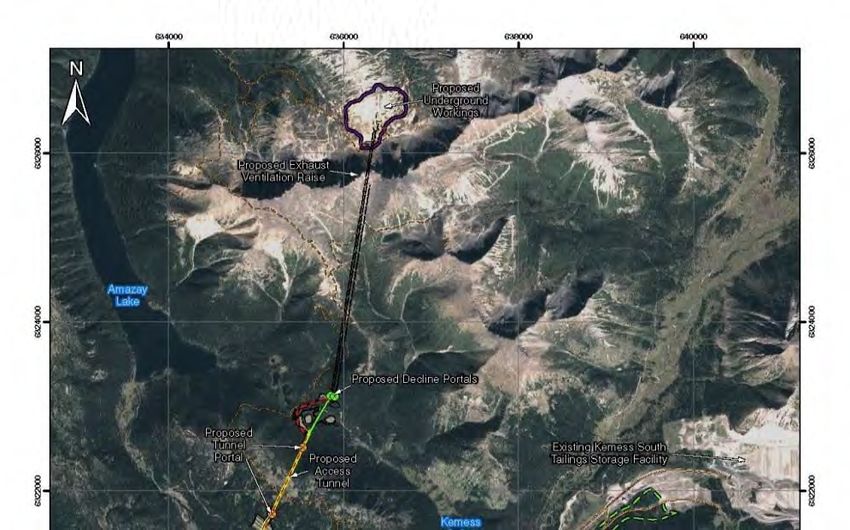
Centerra: Asset Breakdown
         2017 Free Cash Flow                                                        Consensus Asset NAV                                                         Consensus Asset NAV
            (US$MM’s)(1)                                                                                                                                            (US$MM’s)

                                                                                                                                                                        Mount Milligan
                                                                                             Langeloth
                 Mount Milligan                                                                                                                                                  $1,001
                                                                                      Royalties 1% Gatsuurt
                        $127                                                         3%                       1%
                                                                            Greenstone
                                                                                5%                                                                                               Kumtor
                                                                          Other
                                                                           7%                                                        Mt. Milligan                                $916
                      Kumtor                                                                                                            34%

                        $188                                          Öksüt                                                                                                  Kemess
                                                                       8%
                                                                                                                                                                                 $290

                                                                                                                                                                                 Öksüt
                                                                      Kemess
                                                                       10%                                                                                                       $256

                                                                                                                                                                           Greenstone
                Royalty Portfolio(2)                                                                     Kumtor                                                                  $140
                                                                                                          31%
                         $11
                                                                                                                                                                             Gatsuurt
                                                                                                                                                                                  $40

                                                                                                                                                                       Royalty Portfolio
                                                                                                                                                                                  $85
Source: Centerra Gold, analyst estimates.
(1)     Mount Milligan and Kumtor Mine free cash flow figures are non-GAAP measures discussed under “Non-GAAP Measures” in the Company’s MD& A and news release Feb. 23, 2018.
(2)     AuRico Metals Inc. acquisition closed January 8, 2018, royalty portfolio cash flow as of December 31, 2017.
February 2018                                                                                                                                                                              6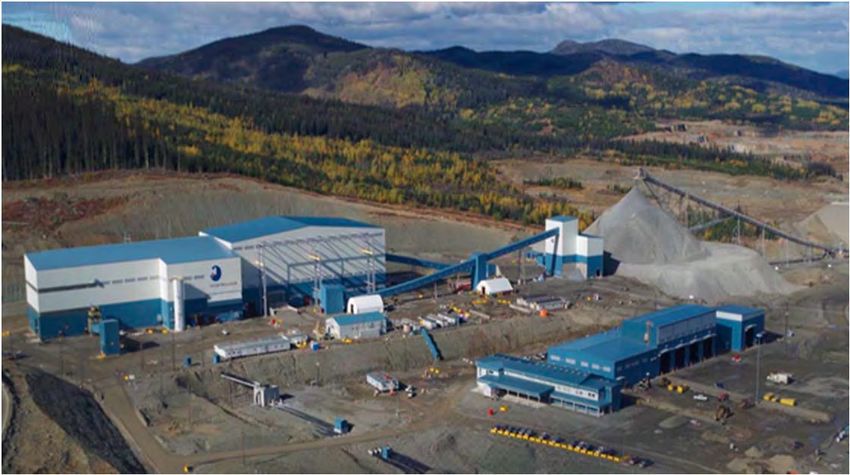
High-Quality Free Cash Flowing Royalty Portfolio

                                                                                           4            19             4
                                                                                     Producing          Total      Countries
                                                                                     Royalties        Royalties

                                                                                                       Valued     World-Class
                                                                                         Top-Tier
                                                                                                      Operating      Mining
                                                                                          Assets
                                                                                                      Partners    Jurisdictions
                                                             Hemlo-Williams
                           Canada                            0.25% NSR
                                                             (Barrick Gold)

GJ & GJ Northern
Block                                                        Eagle River
1.0% & 0.5% NSRs                                             0.5% NSR
(Skeena Resources)                                           (Wesdome Gold Mines)

                                                                                           Royalty Revenue (US$MM’s)
                                    USA   Young-Davidson
                                          1.5% NSR                                  15
                                          (Alamos Gold)
                                                                                                                  $11.5 - $12.7
                                                                                                         $11.1

                                                                                    10
                               Mexico                                                          $8.1

                                                            Australia
                                                                                    5

                                                    Stawell
                                                    1.0% NSR
   Producing Royalty                      (Kirkland Lake Gold)
   Non-Producing Royalty                                                            0
                                                Fosterville                                    2016      2017A       2018E
                                                    2.0% NSR
February 2018                             (Kirkland Lake Gold)                                                                    7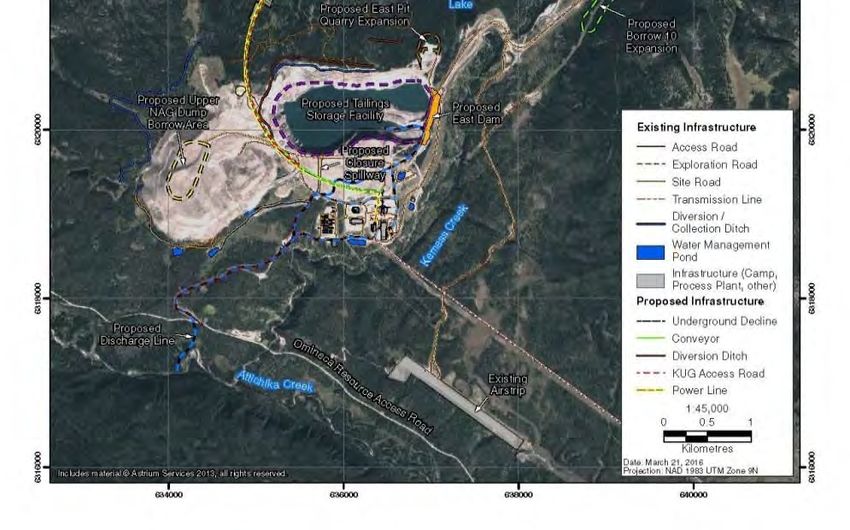
Centerra Royalty Portfolio: Cornerstone Royalty Assets

        Young-Davidson (1.5% NSR)                                          Fosterville (2.0% NSR)

        Mine Operator                                    Alamos Gold       Mine Operator                         Kirkland Lake Gold

        Mine Type                                       Underground        Mine Type                               Underground

        2018 Production Guidance                       200-210koz Gold     2018 Production Guidance               260-300koz Gold

        P&P Reserves                                  3,467koz @ 2.6 g/t   P&P Reserves                         1,700koz @23.1 g/t
        M&I (exclusive)                               1,361koz @ 3.2 g/t   M&I (exclusive)                      2,150koz @ 4.8 g/t
        Inferred                                       311koz @ 2.7 g/t    Inferred                             1,900koz @ 7.1 g/t
        Highlights                                                         Highlights
         • 6-year operating history with strong track record                • 12-year operating history with strong track record
         • One of Canada’s largest underground mines                        • 2018 production guidance of 260-300k oz up from
         • 14-year mine life based on year-end 2017 reserves                  2017 guidance of 250-260k oz.
         • Large resource base and exploration potential to                 • Achieved annual production record of 263,845 ounces
           support mine life extension                                        in 2017.
         • Achieved record gold production of 56.5koz ounces in             • Mineral reserves more than doubled at Fosterville with
           Q4/17 as the mine continues to ramp-up to 7,000 tpd                an increase in reserve grade from 9.8 g/t Au to 23.1
           throughput in 2018, having averaged 6,600 tpd in                   g/t Au.
           2017.                                                            • In-mine and step-out exploration is focused on
                                                                              accelerating conversion in three production horizons in
                                                                              the Swan Zone (reserves of 1,160koz at 61.2 g/t Au)

Source: Alamos Gold and Kirkland Lake Gold filings.
February 2018                                                                                                                           8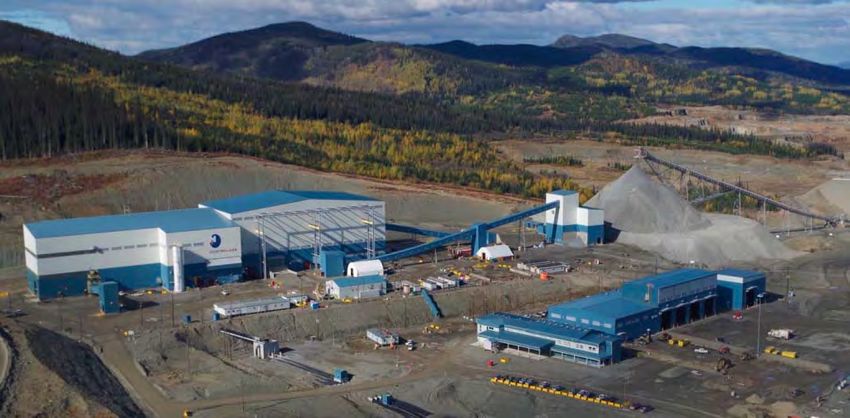
Centerra: High-Quality Producing and Growth Assets

                                    Greenstone Project
                Mt. Milligan Mine                                             Kumtor Mine
                                    (50%)
                Au, Cu                                                        Au
                                    Au
                Canada                                                        Kyrgyz Republic
                                    Canada

                                             Hemlo-Williams
                                             (0.25% NSR)
                                             Au
                                             Canada

                                          Eagle River                                                   Gatsuurt Project
                                          (0.5% NSR)                                                    Au
                                          Au                                                            Mongolia
                                          Canada
   Kemess
   Underground and
   East Projects                    Young-Davidson
   Au, Cu                           (1.5% NSR)
   Canada                           Au
                                    Canada

     Operations                                               Öksüt Project
     Development                                              Au                          Fosterville
     Producing Royalty Assets                                 Turkey                      (2.0% NSR)
     Molybdenum Asset                                                                     Au
                                                                                          Australia

February 2018                                                                                                              9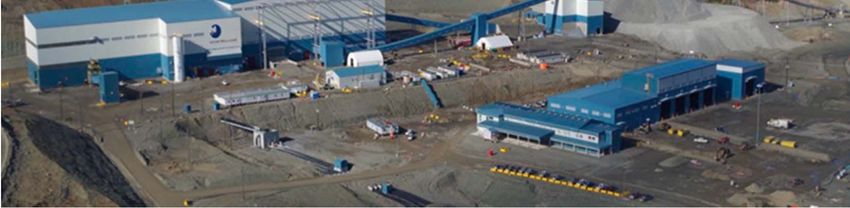
Mount Milligan: Long Life, Low Cost Gold Copper Mine
                                                                                    2018E
                                                    2016             2017
                                                                                   Guidance
 Gold Production (koz)                               205              223            195-215

  Copper Production (Mlbs)                           59               54              47-52
 All-In Sustaining Costs
                                                    $509             $505          $806-$888
 (US$/oz)(1)
 Sustaining Capital ($MM)(1)                         NA               $30              $44

 Remaining reserve life (years)                                       +20

                                                          Gold                   Copper

 P&P Reserves(2)                                       5.1Moz                  1,938Mlbs

      Grade                                             0.3g/t                   0.188%

                                                      35% @                 18.75% @ 15% of
 Royal Gold Stream
                                                     US$435/oz                spot Cu price

  Significant Open Pit Gold and Copper Production                                                                                Significant Gold and Copper Production
                2017 generated $127MM free cash flow(1)                                                                    250                                                                 70
                                                                                                                                          223
                                                                                                                                                                      59
                                                                                                                                  205             205                             54           60
                                                                                               (2)
                20+ years of production from existing P&P reserves                                     Gold ounces 000’s   200                                                          50
                                                                                                                                                                                               50

                                                                                                                                                                                                    Copper M lbs
                                                                                                                           150
                5.1M gold reserve ounces(2)                                                                                                                                                    40

                                                                                                                           100                                                                 30
                Low cost, long life production                                                                                                                                                 20
                                                                                                                            50
                                                                                                                                                                                               10
                Stable, mining-friendly jurisdiction
                                                                                                                             0                                                                 0

                Tax loss pools, no cash taxes until 2022/2023                                                                     2016    2017   2018E              2016       2017    2018E
                                                                                                                                         GOLD                                COPPER
(1)   Non-GAAP measure and is discussed under “Non-GAAP Measures” in the Company’s MD&A and news release February 23, 2018. 2016 AISC is for the period Oct.20 to Dec.31, 2016.
(2)   Refer to February 8, 2018 mineral reserves and resources news release.
February 2018                                                                                                                                                                                                      10
Kumtor: World Class Open Pit Gold Mine
2018E
2016 2017
Guidance
Gold Production (koz) 551 563 450-500
All-In Sustaining Costs ($/oz) (1) $640 $698 $733-$815
Sustaining Capital ($MM)(1) $61 $61 $49
Growth Capital ($MM)(1) $15 $18 $14
Projected Asset Life (years) +8
Reserves(2) (Moz) 4.5
Au Grade (g/t) 2.4
Resources M&I(2) (Moz) 2.6
Au Grade (g/t) 2.8
World Class Cornerstone Asset Significant Open Pit Gold Production to 2026
2017 generated $188MM free cash flow(1) 650,000 4.50
4.00
21 years of uninterrupted profitable production
3.50
240 240 500,000
More than 4M ounces remaining U/G
in open
miners
pit reserves
U/G miners
3.00
grade g/t
Ounces
207 2.50
Low cost,YElong life production
target of U/G miners
350,000
4,000tpd
2.00
170opportunity (inferred 3.4Moz @ 7.3 g/t)
Underground
U/G miners 1.50
200,000 1.00
Strong stable platform to grow Centerra
2014 2015 2016 2017 2018 2019 2020 2021 2022
February 2018 (1) Non-GAAP measure and is discussed under “Non-GAAP Measures” in the Company’s MDA and news release February 23, 2018. (2) Refer to February 8, 2018 mineral reserves and resources news release.11Öksüt: Funded High Margin Gold Production
2015 Feasibility Highlights
Mine Type Open Pit, Heap Leach
Avg. LOM Annual Production 110koz Au
Avg. LOM AISC(1) (US$/oz) $490
Reserve Mine Life 8 years
Development Capex (US$MM) $221
P&P Reserves(2)(Moz) 1.2
Au grade (g/t) 1.3 Öksüt Gold
Project
Life of Mine Recovery 74%
Life of Mine Strip Ratio (w:o) 2:1
First Gold Pour Q1-2020
IRR (after tax) 43%
NPV(8%) - after tax (US$MM) >$240
Catalyst Schedule Location of Projected Open Pits
EIA approval received in November 2015
Forestry Permit & GSM License received July 2016
PastureLand Permit received January 2018
Investment Incentive Certificate received February 2018
Construction expected to start in April 2018
Bought back Stratex and Teck royalties
US$150MM low-cost +5-year financing in-place
(1) Non-GAAP measure see “Non-GAAP Measures in the MDA and news release of February 23, 2018.
(2) Company filings. Technical Report on the Öksüt Gold Project dated September 3, 2015.
February 2018 12Kemess: Overview
Kemess Underground (Feasibility – 2016)(1)
• Reserves of 1.9Moz Au and 0.6Blbs Cu
• LOM of 12 years at 106koz Au/p.a. and 47Mlbs/p.a. at
AISC(2) of $244/oz on a by-product basis
• Environmental approvals and IBA received
• Awaiting receipt of permit application
Kemess East (PEA – May 2017)(1)
• M&I resources of 1.7Moz and 1.0Blbs Cu
• LOM of 12 years at 80koz Au/p.a. and 57Mlbs/p.a. at
AISC(2) of (US$69/oz) on a by-product basis
Kemess South (Past Producer: 1998 – 2011)
• ~C$1 billion of infrastructure in-place (including a 25,000
tpd mill, grid power, road, maintenance shop, etc.)
• Past production of 3.0Moz Au and 750Mlbs Cu
− Brownfields opportunity significantly reduces risk
(1) Refer to National Instrument 43-101 technical report dated July 12, 2017 Technical Report for the Kemess Underground and Kemess East Project, British Columbia, Canada, available in the AuRico Metals filings on SEDAR.
A preliminary economic assessment (PEA) is preliminary in nature and includes inferred mineral resources that are considered too speculative geologically to have the economic considerations applied to them that would
enable them to be categorized as mineral reserves, and there is no certainty that the PEA will be realized.
(2) AISC is a Non-GAAP measure.
February 2018 13Kemess: De-Risked Brownfield Project(1)
• Established mining jurisdiction Kwadacha Kemess Project
(Fort Ware)
Kemess
• Advanced-stage Project Tsay Keh
Omineca Resource
Access Road
− EA Approved, IBA in hand, FS complete Forest Service Road
0 100 200
• Low-risk brownfield development Kilometers
Dawson Creek
• C$1 billion of existing infrastructure
Takla
Landing
Mount Milligan
Mackenzie
− 25,000 tpd mill, road, power, tailings, rail load-
out, camp, airstrip Terrace Smithers
Fort
St. James
Prince Endako
•
Prince George
Sizeable resource
Rupert
− KUG: P&P of 1.9Moz gold and 0.6Blbs copper and
M&I (exclusive of P&P) of 3.3Moz gold and
1.2Blbs copper
− KE: M&I of 1.7Moz gold and 1.0Blbs copper
Expected Catalyst Schedule
• Long life
Kemess Underground EA Approval Received – Q1 2017
− 12 years at Kemess Underground plus further 12
years at Kemess East First Nations IBA Received – Q2 2017
Kemess Underground Permit Anticipated – end Q2 2018
• Highly marketable clean concentrate Application
• Robust Kemess Underground economics with
significant upside
• Continued exploration success
− Kemess East and Kemess Offset Zone
(1) Refer to National Instrument 43-101 technical report dated July 12, 2017 for Kemess Underground and Kemess East available in the AuRico Metals filings on SEDAR.
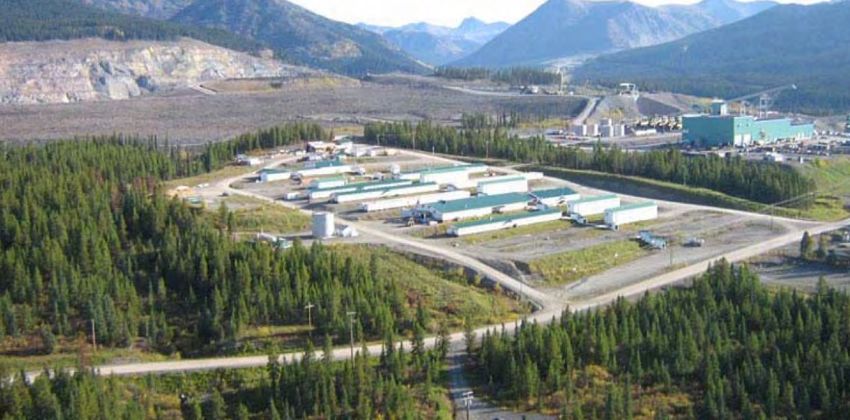
February 2018 14Kemess: Site Layout – C$1Billion of Infrastructure Fly-in, Fly-out Work Camp South Open Pit (Tailings Storage Facility) Metallurgical Facility Kemess Underground & East Deposits February 2018 15
Kemess: Large, Low-Cost Production
          Kemess Underground – 2016 Feasibility Highlights(1)                                                                                      Kemess East– 2017 PEA Highlights(1)
         Mine Type                                                        Underground Block Cave                                  Mine Type                                      Underground Panel Cave
         Avg. LOM Gold Production (koz)                                                 106                                       Avg. LOM Gold Production (koz)                          80
         Avg. LOM By-Product AISC (US$/oz)(2)                                          $244                                       Avg. LOM By-Product AISC (US$/oz)(2)                   ($69)
         Reserve Mine Life (years)                                                       12                                       Reserve Mine Life (years)                               12
         Development Capex (C$MM)(3)                                                   $604                                       Development Capex (C$MM)                               $327
         P&P Au Reserves (Moz)                                                          1.9                                       M&I Au Resource (Moz)                                   1.7
         P&P Au Reserve Grade (g/t)                                                     0.54                                      M&I Au Grade (g/t)                                      0.46
         P&P Cu Reserves (Mlbs)                                                        629.6                                      M&I Cu Resource (Mlbs)                                 954.0
         P&P Cu Reserve Grade (%)                                                     0.27%                                       M&I Cu Grade (%)                                       0.38%
         After-tax IRR                                                                12.6%                                       After-tax IRR                                          16.7%
         After-tax NPV5% (C$MM)                                                        $289                                       After-tax NPV5% (C$MM)                                 $375

                              KUG Gold and Copper Production(1)                                                                                       KE Gold and Copper Production(1)
                   160                                                                                  80                                160                                                       80

                                                                                                                                                                                                          Copper (Mlbs)
                                                                                                             Copper (Mlbs)

                   120                                                                                  60                                120                                                       60
                                                                                                                             Gold (koz)
      Gold (koz)

                    80                                                                                  40                                 80                                                       40

                    40                                                                                  20                                 40                                                       20

                    --                                                                                  --                                 --                                                       0
                         Y-2 Y-1 Y1 Y2 Y3 Y4 Y5 Y6 Y7 Y8 Y9 Y10 Y11 Y12 Y13                                                                     Y4 Y5 Y6 Y7 Y8 Y9 Y10 Y11 Y12 Y13 Y14 Y15 Y16 Y17
                                              Project Schedule Year                                                                                            Project Schedule Year
                                                       Au Cu                                                                                                          Au    Cu
(1)          Refer to National Instrument 43-101 technical report dated July 12, 2017 for Kemess Underground and Kemess East available in the AuRico Metals filings on SEDAR.
(2)          AISC is a Non-GAAP measure
(3)          Includes pre-commercial net revenue and capitalized pre-production operating expenditures.
February 2018                                                                                                                                                                                                             16
Kemess: Timeline – And Copper Outlook
Kemess Timeline
Copper Outlook
Deficit
25
Large ~6Mt
deficit expected
20 by 2030
Mt
15
10
2015 2018 2021 2024 2027 2030
Source: Wood Mackenzie. Base Probable Projects Primary Demand
February 2018 17Centerra: Potential Upside Optionality - Molybdenum
Molybdenum Price Movement Thompson Creek Mine
14.00 ● Located in Idaho, is the world’s fourth largest open-pit primary
13.00 molybdenum mine
12.00 ● Operations began in 1983, using conventional open-pit mining and a on-
site 25,500 tpd mill
11.00
● In December, 2014 placed on care and maintenance
$ USD per Pound
10.00
9.00 Endako Mine
8.00 ● Endako Mine is a fully integrated molybdenum facility located in BC
7.00 ● TCM is the operator and 75% owner; Sojitz owns 25%
6.00
● Endako consists of three adjoined pits and a fully integrated operation
5.00 with on-site mill and multiple hearth roasting facility
4.00 ● New 55,000 tpd processing facility was completed in 2012 for~US$500MM
Jul-16 Sep-16 Nov-16 Jan-17 Mar-17 May-17 Jul-17 Sep-17 Nov-17 Jan-18
● In July 2015 placed on care and maintenance
Historical Molybdenum Segment EBITDA(1) Langeloth Metallurgical Facility
(US$MM)
● Located 40 km west of Pittsburgh, Pennsylvania
$444
● Operates both as a toll processor and as a purchaser of molybdenum
$269 $265 concentrates from third parties, producing a suite of premium
$126 $126 $124 molybdenum products
$18
● Cash flows from the Langeloth operations are expected to cover care and
($21)
maintenance expenses associated with the molybdenum mines
2008 2009 2010 2011 2012 2013 2014 2015
(1) Prior to intersegment eliminations. Historical EBITDA not reported, therefore calculated based on historical segment disclosure.
February 2018 18Centerra: Lower-Cost Asset Base
• Kemess Underground represents a potential fourth Centerra mine in the bottom quartile of global gold
producers
• Royalty cash flow provides additional margin enhancement
AISC Industry Curve (By-Product Basis)
0% 25% 50% 75% 100%
$2,500 Centerra Gold
(US$799-885/oz Au)
$2,250
$2,000 Kemess Underground
(US$244/oz)(1)
Kumtor
AISC, net (US$/oz Au)
$1,750
(US$733-774/oz)
$1,500
Mount Milligan
$1,250 (US$806-888/oz)
$1,000
Öksüt
(US$490/oz)(2)
$750
$500
$250
$0
730 9,100 16,008 23,666 30,082 36,417 39,898 42,962
Source: SNL Metals. Cumulative Gold Production (koz Au)
Notes: Centerra AISC figures based on 2018 cost guidance, unless noted.
1. Kemess Underground AISC based on LOM plan as per National Instrument 43-101 technical report dated July 12, 2017 for Kemess Underground and Kemess East available in the AuRico Metals filings on SEDAR
2. Öksüt AISC based on LOM plan as per the NI 43-101 Technical Report On The Öksüt Gold Project, Turkey dated September 3, 2015
February 2018 19Appendices
TSX: CG
www.centerragold.comCenterra: Enhanced Project Pipeline
Öksüt: High Margin Open Pit Heap Leach Gold Project
Funded, late-stage gold development project
Near-term high margin gold production
Kemess: Low-Cost Brownfield Gold-Copper Project in British Columbia
Over C$1 billion of surface infrastructure, EIA and First Nation agreement in place
KUG and KE optimization and potential synergy opportunities
Greenstone: Large Scale Open Pit Gold Project
One of Canada’s largest undeveloped open pit gold deposits
Bankable feasibility study completed, final EIS/EA filed, IBA and mine permitting work underway
Gatsuurt: Open Pit Gold Project with Established Infrastructure
Updated feasibility study completed
Surface processing infrastructure in-place
February 2018 21Diversified Portfolio with Balanced Geographical Profile
Consensus Asset NAV by Geography(1) P+P Reserves by Geography(2)
Mongolia U.S. Australia Turkey
2% 2% 1% 7%
Mongolia
Turkey 8%
9%
Canada
53% Kyrgyz Canada
Kyrgyz
Republic 57%
Republic
28%
33%
Consensus Asset NAV by Stage M+I Resource (Inclusive) by Geography(3)
Exploration Turkey
7% Mongolia 5%
8%
Development
24%
Kyrgyz
Republic
27% Canada
Producing 60%
69%
Source: Company filings and analyst estimates.
(1) Does not include assets classified as ‘Other’.
(2) See Reserves and Resources news release February 8, 2018, excludes royalties.
(3) Resources are shown inclusive of reserves. Minerals resources that are not mineral reserves do not have demonstrated economic viability. Excludes royalties.
February 2018 22Centerra: Q4 & 2017 Corporate Update
Safety – “Work Safe : Home Safe” Program Rolled Out Across the Company
Achieved 2017 Gold Production of 785,316 Ounces and Copper Production of 53.6 Million Pounds
including 562,749 Ounces at Kumtor and 222,567 Ounces at Mount Milligan
2017 All-In Sustaining Cost (AISC)1 of $688 per ounce, $17 per ounce lower than revised guidance;
Kumtor AISC1 of $698 per ounce and Mount Milligan AISC1 of $505 per ounce
2017 Net Earnings $210MM or $0.72 Per Share; Q4 Net Earnings $130MM or $0.45 Per Share
2017 Adjusted Earnings1 $281MM or $0.96 Per Share;
Q4 2017 Adjusted Earnings1 $109MM or $0.37 Per Share
Cash Provided by Operations of $501MM ($1.72 per share) in 2017; Q4 $170MM ($0.58 per share)
2017 Free Cash Flow1 Generation of $127 Million at Mount Milligan and $188 Million at Kumtor
Dec.31, 2017 Cash2 Position of $417 Million; Net Cash of $119 Million
Closed Acquisition of AuRico Metals Inc. on Jan.8, 2018
Received Öksüt Pastureland Permit in early 2018; expect to commence construction in April 2018
Restarted mill processing at Mount Milligan Feb.5, 2018 ramping up to 30,000 tpd
1. Non-GAAP measure and is discussed under “Non-GAAP Measures” in the Company’s December 31, 2017 MD&A and news release February 23, 2018.
2. Includes cash, cash equivalents, restricted cash and short-term investments at December 31, 2017.
February 2018 23Centerra: Q4 & 2017 Operating Highlights
2017 gold production - Kumtor 562,749 ounces, Mount Milligan 222,567 ounces1
2017 copper production - Mount Milligan 53,596,000 pounds1
Kumtor received all the necessary permits and approvals for 2018 operations
2018 Company-wide guidance, 645,000 – 715,000 oz gold @ AISC3 $799 - $885/oz sold and
47 – 52 Million pounds of payable copper
Suspended mill operations at Mt. Milligan late-December; restarted at partial capacity Feb.5, 2018
Q4 2017 Q4 2016 2017 2016
Gold ounces produced(1)(2) 216,752 248,479 785,316 598,677
Copper produced (000’s payable lbs)(1)(2) 12,261 10,399 53,596 10,399
Mt. Milligan All-in Sustaining Costs/ounce sold(2)(3) $594 $509 $505 $509
Kumtor All-in Sustaining Costs/ounce sold(3) $526 $538 $698 $639
Consolidated All-in Sustaining Costs on a by-
$571 $586 $688 $682
product basis per ounce sold(1),(2),(3)
Revenue from mining operations ($000)(2) $358,232 $305,723 $1,199,000 $757,723
1. Gold ounces and copper produced includes results from Mt. Milligan on a 100% basis.
2. For the three months ended and year ended December 31, 2016, production, revenues and consolidated all-in sustaining cost per ounce includes Mt. Milligan beginning October 20, 2016.
3. Non-GAAP measure and is discussed under “Non-GAAP Measures” in the Company’s MD&A and News Release dated February 23, 2018.
February 2018 24Mount Milligan: Update
Temporary suspension of mill processing operations late-December due to low water levels;
Restarted milling at partial capacity Feb.5, 2018 ramping up to approximately 30,000 tpd;
Expect to return to full capacity after spring melt; 2nd half 2018 expect to average 55,000 tpd
Gold and copper recoveries continue to improve
Continue to focus on optimizing the mine and mill as well as implementing improved maintenance
practices and systems to increase gold and copper recoveries and decrease unplanned downtime
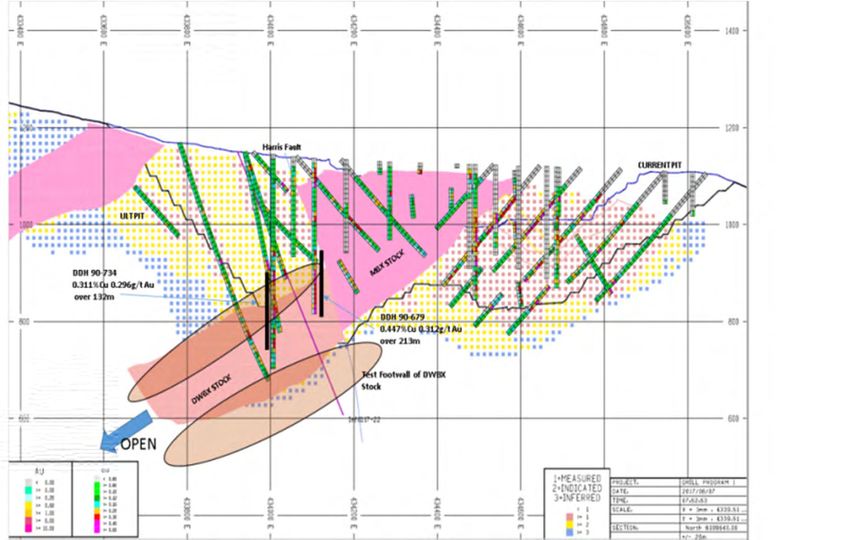
February 2018 25Mount Milligan: Exploration Targets February 2018 26
Mount Milligan: Resource Expansion Potential

                C. Paul Jago, a Member of the Engineers and Geoscientists British Columbia, is Centerra’s qualified person for the purpose of National Instrument 43-101.

February 2018                                                                                                                                                               27
Centerra: Q4 & 2017 Financial Highlights1
Quarter Quarter
Ended Ended Year Ended Year Ended
Dec.31, Dec.31, Dec.31, Dec.31,
(in thousands, except ounces, per share amounts, and
average realized price4) 2017 2016 2017 2016
Revenue(2) $358,232 $305,723 $1,199,028 $757,723
Total gold ounces sold(3) 242,228 225,996 792,466 580,496
Total copper pounds sold(3) (000’s) 13,105 9,467 59,719 9,467
Operating cash flow $170,384 $170,397 $500,896 $371,444
Operating cash flow per share, basic $0.58 $0.60 $1.72 $1.48
Net earnings $129,980 $63,628 $209,533 $151,538
Adjusted earnings(4) $108,700 $68,628 $281,000 $160,900
Adjusted earnings per share(4), basic $0.37 $0.24 $0.96 $0.64
Average realized gold price per ounce(3)(4) $1,197 $1,154 $1,171 $1,233
1. U.S. dollars
2. For the three months and year ended December 31, 2016 consolidated revenue excludes any revenue from Boroo and includes results from Mt. Milligan operations on a 100% basis
beginning October 20, 2016.
3. 2016 numbers for gold ounces sold exclude any sales from the Boroo mine and includes gold and copper sales on a 100% basis from Mt. Milligan beginning October 20, 2016.
4. Non-GAAP measure and is discussed under “Non-GAAP Measures” in the Company’s MD&A and News Release February 23, 2018.
February 2018 28Centerra: Q4 & 2017 Other Financial Highlights
Consolidated 2017 AISC1 of $688 per ounce; Outperform low-end of guidance by $17 per ounce
Q4, 2017 AISC1 of $526 per ounce at Kumtor and $594 per ounce at Mount Milligan
- Q4, 2017 sold all ounces which were temporarily held back at Kumtor in Q3, 2017 while
Kyrgyzaltyn secured a new North American offtaker
- Kumtor received approximately $240 million in gold sales cash receipts in Q4, 2017
Q4 Consolidated All-in Sustaining Costs (per ounce sold)1 YTD Consolidated All-in Sustaining Costs (per ounce sold)1
800 800
3 167 5
58 35 11 70
750
104 750
700 47
650 700 688
$ /Oz sold
$ /Oz sold
586 13 682
600 571
650
550
500 600
450
550
400
350 500
1
Non-GAAP measure and is discussed under “Non-GAAP Measures” in the Company’s MD&A and News Release dated February 23, 2018.
February 2018 29Centerra: Q4 & 2017 Other Financial Highlights
Two High Cash Generating Mines - 2017 $562.9 Million cash provided from mine operating
activities before changes in working capital1 and after capital expenditures of $311.6 Million
(including $196.2 million from Kumtor and $115.4 million from Mount Milligan)
Debt repayments of $209 Million in 2017; $119 Million net cash at December 31, 2017
Cash balance at year-end of $417 Million
Restructured debt into $500MM credit facility Feb. 2018; $315MM drawn as of February 23, 2018
Debt Reduction
550
505
500
470
447
450 409 417
401
US$ Millions
400
358 352
350 334
298
300
250
200
1
Non-GAAP measure and is discussed in the Dec31 2016 Mar31 2017 Jun30 2017 Sep30 2017 Dec31 2017
Company’s MD&A and News Release dated February 23, 2018 2
2
Includes CAT finance leases ($32MM at December 31, 2017) Total Debt Cash
February 2018 30Kemess: Value Creation Opportunities
• Optimization opportunities through the
integration of KUG and KE
− Economies of scale in ore processing, G&A, and site
services
− Optimize tailings management
− Optimize mining and development of KUG and KE to
access highest grade areas of both deposits during the
early years
− Enhance recoveries by blending KUG and KE ore
• Exploration Upside
− 2017 drill program consisting of ~12,000 metres at
Kemess East commenced in July 2017 with infill drilling
and growth on outer edges of deposit
− Drill program to also target the high-grade Kemess
Offset Zone, located between Kemess Underground and
Kemess East
• Potential operational synergies with Centerra’s
existing operations in British Columbia
Source: Refer to National Instrument 43-101 technical report dated July 12, 2017 for Kemess Underground and Kemess East
available in the AuRico Metals filings.
February 2018 31Gatsuurt: Gold Development Project
2017 Feasibility Highlights(1)
Mine Type Open Pit The Gatsuurt Project is ~90 km north of Ulaanbaatar
Avg. LOM Annual Production 111koz Au
Avg. LOM AISC(1) (US$/oz) $870
Reserve Mine Life 10 years
LOM Development Capex (US$MM) $245
LOM Sustaining Capital (US$MM) $37
P&P Reserves(2)(Moz) 1.3
Au grade (g/t) 2.7
Life of Mine Recovery 84%
Life of Mine Strip Ratio (w:o) 4.7:1
IRR (after tax) 9%
NPV(5%) - after tax (US$MM) $39
Boroo’s Historical Cumulative Net Cash Generation (US$MM) In-Place 5ktpd Processing Facility (Boroo)
600
500
400
US$ Millions
300
200
100
0
(100)
2004 2005 2006 2007 2008 2009 2010 2011 2012 2013 2014
(1) See Gatsuurt Project Update in Company’s news release October 31, 2017 and technical report dated December 22, 2017.
February 2018 32Greenstone: One of Canada’s Largest
Undeveloped Open Pit Gold Mines
Cornerstone Canadian Development Project Ontario: Top Tier Mining Jurisdiction
50:50 development partnership with Premier Gold
Open pit reserves(1) (100%) 4.7Moz Au @ 1.02 g/t
Historic gold production of 4.12M oz (~1934-1970)
Large land package covers 337km2, good infrastructure
Significant exploration and underground resource potential Greenstone Gold
Property Greenstone Development Project
Bankable feasibility study completed in November 2016 Location: Ontario, Canada
2017, final EIS/EA filed, mine permitting and IBA work underway
Brookbank Deposit
Brookbank Geraldton
Jellicoe 11
Viper
Hardrock
Hardrock Deposit
Beardmore
Beardmore – Geraldton Greenstone Belt +110 km
February 2018 (1) Technical Report on the Hardrock Project dated December 21, 2016. 33Greenstone: One of Canada’s Largest
Undeveloped Open Pit Gold Mines
Cornerstone Canadian Development Project Ontario: Top Tier Mining Jurisdiction
50:50 development partnership with Premier Gold
Open pit reserves(1) (100%) 4.7Moz Au @ 1.02 g/t
Historic gold production of 4.12M oz (~1934-1970)
Large land package covers 337km2, good infrastructure
Significant exploration and underground resource potential Greenstone Gold
Property Greenstone Development Project
2017 final EIS/EA filed, mine permitting and IBA work underway Location: Ontario, Canada
2016 Feasibility Highlights (100%) Projected Gold Production (100%)
Mine Type Open Pit, CIP Mill
Mill Throughput design 27,000 tpd
Avg. LOM Annual Production 288koz Au
Avg. LOM AISC(2) (US$/oz) $600
Reserve Mine Life 14.5 years
Development Capex (US$MM) $962
Sustaining Capital(2) (US$MM) $101
P&P Reserves(1)(Moz) 4.7
Au grade (g/t) 1.02
Life of Mine Recovery 90%
Life of Mine Strip Ratio (w:o) 3.87:1
IRR (after tax) 14.4%
NPV(5%) - after tax (US$MM) $545
February 2018 (1) See Technical Report on the Hardrock Project dated December 21, 2016. (2) Non-GAAP measure, see “Non-GAAP Measures” in Company’s MDA and news release February 23, 2018. 34Centerra: Producing Royalties
Young-Davidson (1.5% NSR) Fosterville (2.0% NSR)
Mine Operator Alamos Gold Mine Operator Kirkland Lake Gold
Mine Type Underground Mine Type Underground
2018 Production Guidance 200-210koz Gold 2018 Production Guidance 260-300koz Gold
P&P Reserves 3,467koz @ 2.6 g/t P&P Reserves 1,700koz @ 23.1 g/t
M&I (exclusive) 1,361koz @ 3.2 g/t M&I (exclusive) 2,150koz @ 4.8 g/t
Inferred 311koz @ 2.7 g/t Inferred 1,900koz @ 7.1 g/t
Highlights Highlights
• One of Canada’s largest underground mines • Achieved annual production record of 263,845 ounces in 2017.
• 14-year mine life based on year-end 2017 reserves • Mineral reserves more than doubled at Fosterville with an
• Open at depth increase in reserve grade from 9.8 g/t Au to 23.1 g/t Au.
Hemlo – Williams (0.25% NSR) Eagle River (0.5% NSR)
Mine Operator Barrick Gold Mine Operator: Wesdome Gold Mines
Mine Type Underground Mine Type Open Pit
2018 Production Guidance 200-220koz Gold 2018 Production Guidance 55-59koz Gold
P&P Reserves 1,774koz @ 2.21 g/t P&P Reserves 344koz @ 9.2 g/t
M&I (exclusive) 1,858koz @ 1.40 g/t Inferred 85koz @ 8.1 g/t
Inferred 442koz @ 2.78 g/t
Highlights
Highlights
• Continuous production since 1995 (>1Moz)
• 73% increase in reserves announced in February 2017
• Significant upside from continued exploration of identified ore
• Has been producing for 30+ consecutive years
zones (incl. 300 Zone)
• Royalty only applicable on production from the Williams mine.
Source: Alamos Gold, Kirkland Lake Gold, Barrick Gold and Wesdome Gold Mines filings.
February 2018 35Centerra: Non-Producing Royalties
Date Primary
Asset Location NSR Rate Operator Notes
Acquired(1) Metal
Independence
Boulevard Mar-17 Gold Yukon 1.00% Adjacent to Goldcorp’s Coffee project
Gold
Cumobabi Mar-17 Copper Mexico 0.50% Evrim Resources Under option to First Majestic Silver
Kirkland Lake 19 near-mine targets & 81 regional targets (claim
East Timmins Mar-17 Gold Ontario 0.50%
Gold progressing in court)
Eskay Mining Area surrounding past producing Eskay Creek mine
Eskay Creek Area Dec-16 Gold/Silver British Columbia 0.50%
Corp and near to Brucejack and KSM
0.98% / Skeena PEA released April 2017; M&I resources of 2.1Moz
GJ / GJ Northern Block Dec-16 Gold/Copper British Columbia
0.49% Resources Au and 1.2Blbs Cu
Millrock
Goodpaster Mar-17 Gold Alaska 1.00% Eligible for advanced royalty payments
Resources
International
Grizzly Sept-17 Copper/Gold British Columbia 1.00% Samuel Located in BC’s Golden Triangle
Exploration
Hemlo – David Bell Sept-15 Gold Ontario 1.50% Barrick Gold Historic operation – adjacent to Williams (on strike)
Kirkland Lake
Leviathan Jul-15 Gold Australia 1.00% Exploration stage
Gold
Madsen Area Dec-16 Gold Ontario 1.00% Frontline Gold Exploration stage
Metallis
Mt. Dunn Mar-17 Copper/Gold British Columbia 2.00% Located in BC’s Golden Triangle
Resources
Rainy River Area Feb-17 Gold Ontario 0.75% Private Exploration stage
RDN Mar-17 Gold British Columbia 1.33% Aben Resources Located in BC’s Golden Triangle
Red Lake Area Mar-17 Gold Ontario 1.00% Frontline Gold Exploration stage
Kirkland Lake Care & Maintenance / “operationally ready”; P&P of
Stawell Jul-15 Gold Australia 1.00%
Gold 132koz and M&I of 114koz
Source: AuRico Metals filings.
(1) Date AuRico Metals acquired the royalty.
February 2018 36Centerra: 2018 Guidance
2018 Production Guidance Units Kumtor Mount Milligan(1) Centerra
Gold
Total Gold Payable Production(2) (Koz) 450 – 500 195 – 215 645 – 715
Copper
Total Copper Payable Production(3) (Mlb) – 47 – 52 47 – 52
2018 All-in Sustaining Unit Costs (5) Kumtor Mount Milligan(1) Centerra(1)
Ounces sold forecast 450,000 – 500,000 195,000 – 215,000 645,000-715,000
All-in sustaining costs on a by-product basis(2), (5) $733 – $815 $806 – $888 $799 – $885
Revenue-based tax(3) and taxes(3) 171 – 190 19 – 21 125 – 139
All-in sustaining costs on a by-product basis including taxes (1), (4), (5) $904 – $1,005 $825 – $909 $924 – $1,024
Gold - All-in sustaining costs on a co-product basis ($/ounce) (1),(5) $733 – $815 $847 – $932 $812 – $900
Copper - All-in sustaining costs on a co-product basis ($/pound) (1),(5) – $1.90 – $2.10 $1.90 – $2.10
2018 Sustaining Capital(5) 2018 Growth Capital(5)
Capital Expenditures
($ millions) ($ millions)
Kumtor Mine 49 14
Mount Milligan Mine 44 -
Öksüt Project - 82
Kemess Underground Project - 36
Greenstone Gold Property - 10
Other (Thompson Creek mine, Endako mine (75%),
7 -
Langeloth facility and Corporate)
Consolidated Total $100 $142
1) Mount Milligan payable production and ounces sold are on a 100% basis (the Mount Milligan Streaming Arrangement entitles Royal Gold to 35% and 18.75% of gold and copper sales, respectively and Royal
Gold will pay $435 per ounce of gold delivered and 15% of the spot price per metric tonne of copper delivered). The copper sales are based on a copper price assumption of $2.90 per pound sold for Centerra’s
81.25% share of copper production and the remaining 18.75% of copper revenue at $0.435 per pound (15% of spot price, assuming spot at $2.90 per pound), representing the Mount Milligan Streaming
Arrangement. Payable production for copper and gold reflects estimated metallurgical losses resulting from handling of the concentrate and payable metal deductions, subject to metal content, levied by
smelters.
2) Gold production assumes 79% recovery at Kumtor and 61% recovery at Mount Milligan.
3) Copper production assumes 79% recovery for copper at Mount Milligan.
4) Includes revenue-based tax at Kumtor and the British Columbia mineral tax at Mount Milligan based on a forecast gold price assumption of $1,275 per ounce sold
5) Non-GAAP measures and are discussed under “Non-GAAP Measures” in the MD&A and news release of February 23, 2018
February 2018 37Centerra: 2018 Guidance Sensitivities
Impact on Impact on
($ millions) ($ per ounce sold)
Change
Net Earnings AISC(3) on by-product
Costs Revenues Cash flows
(after tax) basis
Gold price(1) $50/oz 3.2 – 3.7 22.0 – 25.2 18.8 – 21.5 18.8 – 21.5 0-1
Copper price(1) 10% 1.9 – 2.3 6.6 – 7.9 4.7 – 5.6 4.7 – 5.6 10 – 11
Diesel fuel 10% 4.5 - 5.0 - 6.0 - 7.0 4.5 - 5.0 9 – 10
Kyrgyz som(2) 1 som 1.0 - 2.0 - 1.0 - 2.0 1.0 - 2.0 1-2
Canadian dollar(2) 10 cents 30.0 - 32.0 - 30.0 - 32.0 25.0 - 27.0 35 – 40
1 Gold and copper price sensitivities include the impact of the hedging program set up in order to mitigate gold and copper price risks.
2 Appreciation of currency against the U.S. dollar will result in higher costs and lower cash flow and earnings, depreciation of currency against the U.S. dollar results in
decreased costs and increased cash flow and earnings.
3 All-in sustaining costs per ounce sold (“AISC”) on a by-product basis is a non-GAAP measure discussed under “Non-GAAP Measures” in the Company’s news release
February 23, 2018.
Material Assumptions and Risks1
Material assumptions or factors used to forecast production and costs for 2018 include the following:
• a gold price of $1,275 per ounce,
• a copper price of $2.90 per pound,
• exchange rates:
• $1USD:$1.25 CAD,
• $1USD:71.0 Kyrgyz som,
• $1USD:3.5 Turkish lira,
• $1USD:0.84 Euro,
• diesel fuel price assumption:
• $0.45/litre at Kumtor,
• $0.69/litre at Mount Milligan.
1 Other material assumptions and risks are discussed under “Material Assumptions and Risks” in the Company’s MD&A and news release February 23, 2018.
February 2018 38Centerra: Mineral Reserves - Proven & Probable1
Proven and Probable Gold Mineral Reserves Increase to 16.3 million ounces
Proven and Probable Copper Mineral Reserves are 2,568 million pounds
Gold Mineral Reserves
Proven Probable Total Proven and Probable
Property Tonnes Grade Contained Tonnes Grade Contained Tonnes Grade Contained
(kt) (g/t) Gold (koz) (kt) (g/t) Gold (koz) (kt) (g/t) Gold (koz)
Mount Milligan 236,533 0.4 2,996 231,405 0.3 2,141 467,939 0.3 5,138
Kumtor 10,278 1.5 490 46,849 2.7 3,999 496,209 2.4 4,489
Öksüt - - - 28,163 1.3 1,187 28,163 1.3 1,187
Gatsuurt - - - 15,356 2.7 1,316 15,356 2.7 1,316
Hardrock Open Pit - - - 70,858 1.0 2,324 70,858 1.0 2,324
Kemess
- - - 107,381 0.5 1,868 107,381 0.5 1,868
Underground
Total 246,812 0.4 3,486 500,012 0.8 12,835 746,824 0.7 16,321
Copper Mineral Reserves
Proven Probable Total Proven and Probable
Tonnes Grade Contained Tonnes Grade Contained Tonnes Grade Contained
Property
(kt) (%) Copper (Mlbs) (kt) (%) Copper (Mlbs) (kt) (%) Copper (Mlbs)
Mount Milligan 236,533 0.187 974 231,405 0.189 964 467,939 0.188 1,938
Kemess
- - - 107,381 0.266 630 107,381 0.266 630
Underground
Total 236,533 0.187 974 338,786 0.213 1,594 575,320 0.202 2,568
February 2018 1) As at December 31, 2017, includes Kemess Project following the completion of the AuRico Metals acquisition, see Mineral Reserves and Resources News Release February 8, 2018. 39Centerra: Investor Relations Highlights
Research Coverage
Top Ten (10) Institutional Shareholders
Brokerage Firms Rating Target
Institution/Firm Q4-2017
1. BMO Capital Markets Hold C$10.00
2. BofA Merrill Lynch Neutral C$9.25 1. Blackrock 13.00%
3. Canaccord Genuity Hold C$7.00 2. Van Eck 8.64%
4. CIBC World Markets Neutral C$9.00 3. Paulson & Co 7.80%
5. Cormark Securities Buy C$11.20
4. Dimensional 3.15%
6. Credit Suisse Outperform C$8.50
5. Franklin Advisors 2.22%
7. Global Mining Research Speculative Buy C$10.70
6. Kopernik Global 1.61%
8. Macquarie Capital Markets Outperform C$12.00
Sector Perform C$7.75 7. Vanguard Group 1.54%
9. National Bank Financial
10. RBC Capital Markets Sector Perform C$8.00 8. Capital Research 1.42%
11. Scotiabank Outperform C$9.00 9. USAA 1.20%
12. TD Securities Hold C$8.00
10. Oppenheimer Funds 1.15%
Average C$9.20
TOTAL 41.73%
February 2018 40Centerra: Senior Management
Industry
Background
Experience
• Appointed Chief Executive Officer in November, 2015
SCOTT PERRY 20 years
Chief Executive Officer • Former Chief Executive Officer at AuRico Gold
GORDON REID • Appointed Chief Operating Officer in January, 2013
30 years
Chief Operating Officer • Joined Centerra in 2004
DARREN MILLMAN • Appointed Chief Financial Officer in April, 2016
18 years
Chief Financial Officer • Joined Centerra in 2013
February 2018 41Centerra: Directors
Board of Directors Background
STEPHEN A. LANG Chairman Appointed Director of Centerra’s Board, June 2008
BRUCE V. WALTER Vice Chair Appointed Director of Centerra’s Board, May 2008
SCOTT G. PERRY Director Appointed Director of Centerra’s Board, January 2016
RICHARD W. CONNOR Director Appointed Director of Centerra’s Board, June 2012
EDUARD KUBATOV Director Appointed Director of Centerra’s Board, March 2016
NURLAN KYSHTOBAEV Director Appointed Director of Centerra’s Board, May 2016
MICHAEL S. PARRETT Director Appointed Director of Centerra’s Board, May 2014
JACQUES PERRON Director Appointed Director of Centerra’s Board, October 2016
SHERYL K. PRESSLER Director Appointed Director of Centerra’s Board, May 2008
TERRY V. ROGERS Director Appointed Director of Centerra’s Board, February 2003
BEKTUR SAGYNOV Director Appointed Director of Centerra’s Board, March 2016
February 2018 42TSX: CG www.centerragold.com
You can also read


