Global emissions of perfluorocyclobutane PFC-318, ACP ...
←
→
Page content transcription
If your browser does not render page correctly, please read the page content below
Research article
Atmos. Chem. Phys., 22, 3371–3378, 2022
https://doi.org/10.5194/acp-22-3371-2022
© Author(s) 2022. This work is distributed under
the Creative Commons Attribution 4.0 License.

           Global emissions of perfluorocyclobutane (PFC-318,
                    c-C4F8) resulting from the use of
           hydrochlorofluorocarbon-22 (HCFC-22) feedstock to
           produce polytetrafluoroethylene (PTFE) and related
                            fluorochemicals
          Jens Mühle1 , Lambert J. M. Kuijpers2 , Kieran M. Stanley3 , Matthew Rigby4 , Luke M. Western4 ,
               Jooil Kim1 , Sunyoung Park5 , Christina M. Harth1 , Paul B. Krummel6 , Paul J. Fraser6 ,
            Simon O’Doherty4 , Peter K. Salameh1 , Roland Schmidt1 , Dickon Young4 , Ronald G. Prinn7 ,
                                       Ray H. J. Wang8 , and Ray F. Weiss1
            1 Scripps   Institution of Oceanography, University of California San Diego, La Jolla, CA 92093, USA
                                      2 A/gent Consultancy BV, 5911BA Venlo, the Netherlands
                     3 Institute for Atmospheric and Environmental Sciences, Goethe University Frankfurt,

                                                    Frankfurt, 60438, Germany
                                 4 School of Chemistry, University of Bristol, Bristol, BS8 1TS, UK
              5 Department of Oceanography, Kyungpook National University, Daegu, 41566, Republic of Korea
                6 Climate Science Centre, CSIRO Oceans and Atmosphere, Aspendale, Victoria, 3195, Australia
         7 Center for Global Change Science, Massachusetts Institute of Technology, Cambridge, MA 02139, USA
           8 School of Earth and Atmospheric Sciences, Georgia Institute of Technology, Atlanta, GA 30332, USA

                                     Correspondence: Jens Mühle (jmuhle@ucsd.edu)

                                 Received: 16 October 2021 – Discussion started: 4 November 2021
                        Revised: 15 February 2022 – Accepted: 16 February 2022 – Published: 14 March 2022

      Abstract. Emissions of the potent greenhouse gas perfluorocyclobutane (c-C4 F8 , PFC-318, octafluorocy-
      clobutane) into the global atmosphere inferred from atmospheric measurements have been increasing sharply
      since the early 2000s. We find that these inferred emissions are highly correlated with the production of
      hydrochlorofluorocarbon-22 (HCFC-22, CHClF2 ) for feedstock (FS) uses, because almost all HCFC-22 FS is
      pyrolyzed to produce (poly)tetrafluoroethylene ((P)TFE) and hexafluoropropylene (HFP), a process in which
      c-C4 F8 is a known by-product, causing a significant fraction of global c-C4 F8 emissions. We find a global emis-
      sion factor of ∼ 0.003 kg c-C4 F8 per kilogram of HCFC-22 FS pyrolyzed. Mitigation of these c-C4 F8 emissions,
      e.g., through process optimization, abatement, or different manufacturing processes, such as refined methods
      of electrochemical fluorination and waste recycling, could reduce the climate impact of this industry. While it
      has been shown that c-C4 F8 emissions from developing countries dominate global emissions, more atmospheric
      measurements and/or detailed process statistics are needed to quantify c-C4 F8 emissions at country to facility
      levels.

Published by Copernicus Publications on behalf of the European Geosciences Union.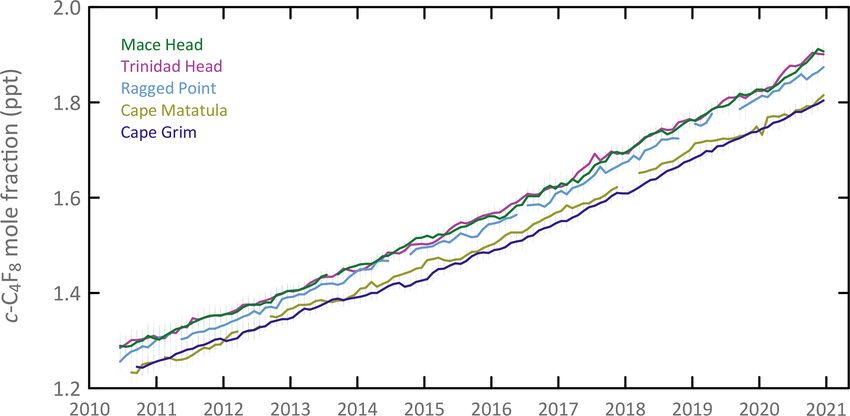
3372                                                                        J. Mühle et al.: Perfluorocyclobutane and HCFC-22

1   Introduction                                                    producers confirmed c-C4 F8 by-product formation (Mühle
                                                                    et al., 2019). Unless c-C4 F8 is recovered or recycled, excess
Perfluorocyclobutane (c-C4 F8 , PFC-318, octafluorocyclobu-         c-C4 F8 may therefore be emitted to the atmosphere, consis-
tane, CAS 115-25-3) is a potent greenhouse gas (GHG) with           tent with the observations. Historically, similar c-C4 F8 by-
a global warming potential of 10 200 on a 100-year timescale        product venting occurred in the US and Europe (Mühle et
(GWP100 ) based on a lifetime estimate of 3200 years (Forster       al., 2019), unnecessarily increasing the carbon footprint of
et al., 2021). Mühle et al. (2019) reported that global atmo-       this industry. Note that Ebnesajjad (2015) and e.g., Mierdel
spheric emissions of c-C4 F8 began in the late 1960s, reaching      et al. (2019) discuss research into the use of refined meth-
a plateau of ∼ 1.2 Gg yr−1 during the late 1970s to the late        ods of electrochemical fluorination (ECF) and waste recy-
1980s, followed by a decline to a plateau of ∼ 0.8 Gg yr−1          cling which may offer significantly reduced by-product for-
during the early 1990s to the early 2000s, and then in-             mation rates in addition to energy savings and overall waste
creased sharply reaching ∼ 2.2 Gg yr−1 in 2017. Emissions           reduction.
of c-C4 F8 from developed countries are reported under the             Closely related to c-C4 F8 (as a by-product of HCFC-
United Nations Framework Convention on Climate Change               22 pyrolysis) is hydrofluorocarbon-23 (HFC-23, CHF3 ), a
(UNFCCC). However, these reports from developed coun-               strong GHG as well, which has long been known to be a by-
tries account only for a small fraction of global emissions         product of the total (FS and non-FS) production of HCFC-22
of c-C4 F8 inferred from atmospheric measurements (Mühle            from chloroform (CHCl3 ), that is also often vented to the
et al., 2019), similar to the emissions gaps observed for           atmosphere, despite the existence of technical solutions, reg-
other synthetic GHGs (e.g., Montzka et al., 2018; Mühle             ulations, and financial incentives (e.g., Stanley et al., 2020).
et al., 2010; Stanley et al., 2020). This emissions gap re-            Here we show that global emissions of c-C4 F8 since 2002
sults partly from emissions in developing countries, which          are highly correlated with the amount of HCFC-22 produced
do not have to be reported to the UNFCCC and are there-             for feedstock (FS) uses, because almost all this FS HCFC-
fore missing, and/or from uncertainties in emissions reported       22 is pyrolyzed to produce TFE/HFP, a process with c-C4 F8
by developed countries. To understand the sources of recent         as a known by-product. This supports the hypothesis that re-
global c-C4 F8 emissions, Mühle et al. (2019) used Bayesian         cent global c-C4 F8 emissions are dominated by c-C4 F8 by-
inversions of atmospheric c-C4 F8 measurements made at              product emissions from the production of TFE/HFP, PTFE
sites of the Advanced Global Atmospheric Gases Experi-              and related fluoropolymers and fluorochemicals.
ment (AGAGE; Prinn et al., 2018) in East Asia and Europe
and from an aircraft campaign over India. For 2016, these
                                                                    2     Methods
limited regional measurements allowed Mühle et al. (2019)
to allocate ∼ 56 % of global c-C4 F8 emissions to specific          2.1    Atmospheric observations of c-C4 F8 and inverse
regions with significant emissions from eastern China (∼                   modeling of global emissions
32 %), Russia (∼ 12 %), and India (∼ 7 %). Spatial patterns
of these regional c-C4 F8 emissions were roughly consistent         We have extended the 1970–2017 AGAGE in situ c-C4 F8 at-
with locations of facilities that produce polytetrafluoroethy-      mospheric measurement record used by Mühle et al. (2019)
lene (PTFE, a polymer widely used for its non-stick and wa-         and produced updated global emissions through 2020. For
ter repellent properties, chemical, thermal, light, and electri-    this we used measurements of c-C4 F8 by “Medusa” gas chro-
cal resistance, high flexibility and low friction), related fluo-   matographic systems with quadrupole mass selective detec-
ropolymers, and the necessary precursor monomers tetraflu-          tion (GC/MSD) (Arnold et al., 2012; Miller et al., 2008)
oroethylene (TFE) and hexafluoropropylene (HFP), which              from five AGAGE stations: Mace Head, Ireland (MHD,
are produced via the pyrolysis of hydrochlorofluorocarbon-          53.3◦ N, 9.9◦ W); Trinidad Head, USA (THD, California,
22 (HCFC-22, CHClF2 ). c-C4 F8 , essentially the dimer of           41.0◦ N, 124.1◦ W); Ragged Point, Barbados (RPB, 13.2◦ N,
TFE, is one of several by-products/intermediates of this pro-       59.4◦ W); Cape Matatula, American Samoa (SMO, 14.2◦ S,
cess (Chinoy and Sunavala, 1987; Broyer et al., 1988; Gan-          170.6◦ W); Cape Grim, Australia (CGO, Tasmania, 40.7◦ S,
gal and Brothers, 2015; Harnisch, 1999; Ebnesajjad, 2015).          144.7◦ E). Ambient air and reference gas measurements are
Process control and optimization to reduce the formation of         alternated resulting in up to 12 fully calibrated samples per
c-C4 F8 and other by-products are complex, and under un-            day (Prinn et al., 2018). Reference gases are supplied by the
suitable conditions c-C4 F8 by-production could be as high          Scripps Institution of Oceanography (SIO) and all c-C4 F8
as 14 % (Ebnesajjad, 2015). On the other hand, Murphy et            data are reported on the SIO-14 calibration scale in parts-
al. (1997) demonstrated that co-feeding several percent of c-       per-trillion (ppt) dry-air mole fractions. Daily reference gas
C4 F8 to the HCFC-22 feed could reduce additional c-C4 F8           measurement precisions are ∼ 0.01–0.02 ppt (∼ 1 %–2 %);
formation to less than 0.5 % of the combined TFE and HFP            for more details see Mühle et al. (2019).
yield, thus increasing combined TFE and HFP yield to more              In situ data were filtered with the AGAGE statistical
than 96 %. But they also stated that perfect process control        method to remove pollution events (Cunnold et al., 2002).
may be impractical. In 2018, one of China’s largest TFE             For these baseline stations more than 99 % of the data were

Atmos. Chem. Phys., 22, 3371–3378, 2022                                              https://doi.org/10.5194/acp-22-3371-2022
J. Mühle et al.: Perfluorocyclobutane and HCFC-22 3373
tries were used here (UNEP, 2021). Additionally, HCFC-22
FS production data for China were taken from Table 4-1 in
the TEAP (2020) report for 2008 to 2018; this report contains
data used for the determination of the funding requirement
for the Multilateral Fund (MLF) for the implementation of
the MP. It also lists totals for A5 countries which show small
inconsistencies with the UNEP (2021) data, probably due to
recent updates. Data for the last year or two are often ad-
justed in the next report. Table 1 shows that Chinese HCFC-
22 FS production from 2008 to 2018 accounted for (84±6) %
of the A5 (developing countries) HCFC-22 FS production
Figure 1. Pollution-free monthly mean mole fraction calculated
((86 ± 3) % if the last year, 2018, is excluded), i.e., most of
from in situ c-C4 F8 measurements at five AGAGE sites using the
the HCFC-22 feedstock (FS) production in developing (A5)
AGAGE statistical method (Cunnold et al., 2002) (https://agage.mit.
edu/data/agage-data, last access: 18 August 2021). countries occurs in China.
Note, that we do not discuss HCFC-22 non-FS produc-
tion statistics, i.e., HCFC-22 produced for emissive uses
retained, reflecting minor regional c-C4 F8 emissions near (e.g., refrigeration and foam blowing). While critical for un-
these stations. In contrast, in East Asia strong and frequent derstanding HCFC-22 emissions and HCFC-22 atmospheric
pollution events were observed and corresponding strong burden, amounts of HCFC-22 produced for non-FS uses are
emissions were inferred, as detailed in Mühle et al. (2019). not relevant for c-C4 F8 emissions. We also do not discuss
Figure 1 shows the continued increase of pollution-free total HCFC-22 (non-FS plus FS) production. While critical
monthly mean c-C4 F8 mole fractions in the global atmo- for understanding HFC-23 by-product emissions (from to-
sphere since the start of in situ measurements. Atmospheric tal HCFC-22 production) and HFC-23 atmospheric burden,
abundances before in situ measurements were reconstructed they are not directly relevant for c-C4 F8 emission studies.
based on measurements of samples of the Cape Grim Air Only HCFC-22 that is produced for FS uses and pyrolyzed
Archive (CGAA) for the extratropical Southern Hemisphere to TFE/HFP with c-C4 F8 by-product is relevant for c-C4 F8
and archived air samples from various sources for the ex- emissions and c-C4 F8 atmospheric burden. It is worth noting
tratropical Northern Hemisphere (not shown) as detailed in though that the global HCFC-22 market is complex. For ex-
Mühle et al. (2019). The data were then used in conjunction ample, the decrease in HCFC-22 FS production in 2009 (de-
with the AGAGE 12-box two-dimensional model (Rigby et veloped countries and total global) was preceded by a large
al., 2013) and a Bayesian inverse method to update global increase in HCFC-22 FS production in developing countries
emissions (Table 1 and Fig. 2). The model describes the in 2008 (Table 1 and Fig. 2). This was a result of increased
transport and loss of trace gases in the global atmosphere and Chinese HCFC-22 production for demand-based FS uses,
calculates mole fractions in each model box with latitudinal most notably PTFE, which may have displaced exports into
divisions at 30◦ S, 0◦ and 30◦ N and pressure divisions at 500 China. Outside of China, there was also a shortage of hy-
and 200 hPa. Model transport parameters are varied season- drogen fluoride, needed to produce HCFC-22 and almost all
ally but repeated annually. In the model the c-C4 F8 lifetime other fluorocarbons (David Sherry, personal communication,
is set to infinity. Details of this inversion are given in Rigby 2022). It is also possible that some of the HCFC-22 FS pro-
et al. (2014) and Mühle et al. (2019). duced at the year-end was used (pyrolyzed) in the next year.
2.2 HCFC-22 feedstock (FS) production data
3 Results and discussion
To investigate whether the chemical relationship between
HCFC-22 pyrolysis and c-C4 F8 by-product (as discussed in Our updated global inversion results show that c-C4 F8 emis-
the Introduction) results in a correlation between HCFC- sions were relatively stable at ∼ 0.8 Gg yr−1 in the early
22 feedstock (FS) production and c-C4 F8 emissions, we 1990s to early 2000s. However, in 2002, c-C4 F8 emission
compiled HCFC-22 FS production statistics (Table 1 and growth resumed, reaching levels not seen before, with a rel-
Fig. 2). While production of HCFC-22 for such presumed atively steady increase to 2.26 Gg yr−1 in 2017 (Table 1 and
non-emissive FS uses are not regulated by the Montreal Pro- Fig. 2, black diamonds; these emissions are very similar
tocol on Substances that Deplete the Ozone Layer (MP), those in Mühle et al. (2019), which were based on a mostly
various types of data, including FS production, are reported identical, albeit shorter duration, AGAGE data set and in-
by all countries (parties) to the United Nations Environment verse method). Here, we find a stabilization at this emission
Programme (UNEP) under Article 7 of the MP. Specifically, level from 2017 to 2019, followed by a possible resumed in-
HCFC-22 FS production data for MP Article 5 (A5, develop- crease in emission growth to 2.32 Gg yr−1 (24 million metric
ing) countries and non-Article 5 (non-A5, developed) coun- tons of CO2 equivalents per year) in 2020 (however, differ-
https://doi.org/10.5194/acp-22-3371-2022 Atmos. Chem. Phys., 22, 3371–3378, 20223374 J. Mühle et al.: Perfluorocyclobutane and HCFC-22
Table 1. Global c-C4 F8 emissions determined from AGAGE atmospheric measurements and hydrochlorofluorocarbon-22 (HCFC-22) feed-
stock (FS) production from United Nations Environment Programme (UNEP) and Technology and Economic Assessment Panel (TEAP)
reports. Most of HCFC-22 feedstock (FS) production in developing (A5) countries occurs in China.
c-C4 F8 emissions HCFC-22 feedstock (FS) production
(Gg yr−1 , 1σ ) (Gg yr−1 , kt yr−1 )
Global Non-A5 (developed) A5 (developing) A5 China Global
countriesa countriesa onlyb (non-A5 + A5)a
1990 0.93 (0.76–1.11) 23.3 0.0 23.3
1991 0.87 (0.71–1.03) 69.2 7.0 76.2
1992 0.80 (0.65–0.97) 49.9 11.2 61.1
1993 0.76 (0.59–0.93) 40.1 10.5 50.6
1994 0.74 (0.57–0.89) 85.2 12.1 97.3
1995 0.74 (0.57–0.90) 61.2 21.7 82.9
1996 0.76 (0.61–0.91) 129.8 21.7 151.5
1997 0.77 (0.63–0.89) 147.7 18.8 166.5
1998 0.76 (0.61–0.90) 154.7 1.1c 155.7
1999 0.75 (0.60–0.89) 158.5 16.2 174.7
2000 0.74 (0.61–0.89) 135.2 0.1c 135.3
2001 0.74 (0.61–0.93) 152.4 0.3c 152.7
2002 0.77 (0.63–0.97) 163.1 34.2 197.3
2003 0.82 (0.66–0.97) 171.3 43.1 214.4
2004 0.89 (0.75–1.06) 203.1 59.8 262.9
2005 0.96 (0.83–1.14) 192.8 78.3 271.1
2006 1.03 (0.91–1.20) 193.1 92.1 285.2
2007 1.09 (0.95–1.23) 186.1 110.5 296.6
2008 1.17 (1.03–1.30) 174.2 194.3 166.1 368.5
2009 1.28 (1.13–1.43) 121.0 186.6 171.9 307.6
2010 1.43 (1.30–1.58) 165.2 244.9 214.7 410.2
2011 1.56 (1.46–1.71) 191.1 291.6 242.2 482.7
2012 1.65 (1.54–1.77) 180.1 302.2 262.2 482.4
2013 1.69 (1.58–1.82) 161.7 345.3 308.0 506.9
2014 1.77 (1.68–1.92) 179.2 357.6 302.9 536.8
2015 1.89 (1.79–2.04) 201.9 316.0 270.7 517.9
2016 2.09 (1.97–2.24) 193.4 365.9 290.3 559.4
2017 2.26 (2.13–2.39) 207.1 438.9 372.3 646.0
2018 2.28 (2.16–2.43) 208.5 484.5 339.7 693.0
2019 2.26 (2.11–2.40) 200.1 512.6 712.7
2020 2.32 (2.16–2.48)
a UNEP (2021). b See Table 4-1 in TEAP (2020). HCFC-22 FS production data for China before 2008 are not publicly available.
c China accounted for > 90 % of A5 HCFC-22 production during 1991 to 2007, but did not report for 1998, 2000, and 2001 to UNEP,
leading to the low A5 values for these years.
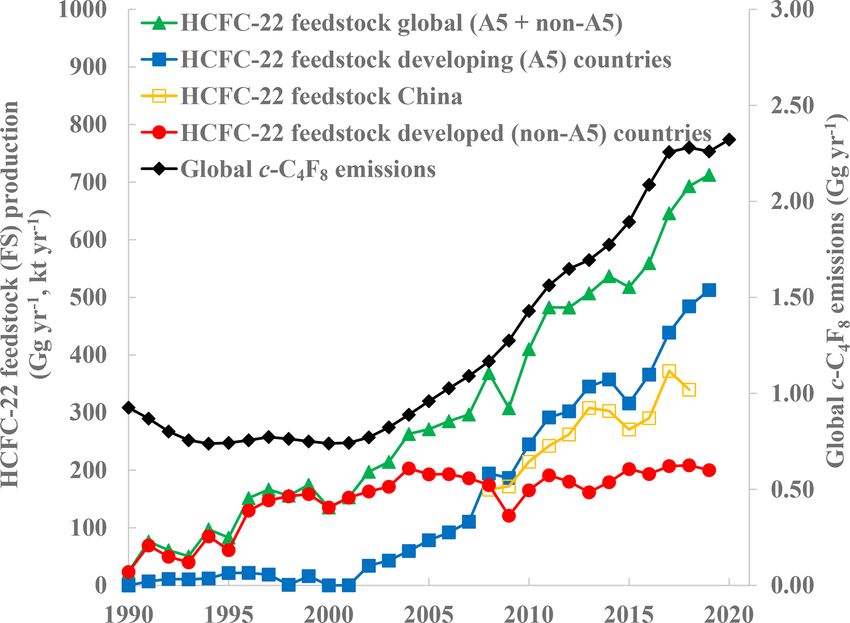
ences between the 2017–2020 emissions are not statistically We find a strong correlation between global HCFC-22 FS
significant). In comparison, global HCFC-22 production for production and inferred global c-C4 F8 emissions (R 2 = 0.97,
feedstock (FS) uses has increased relatively steadily since the p < 0.01) (Fig. 3, green triangles and fit, 2002–2019). While
early 1990s, initially driven by FS production in developed HCFC-22 FS production itself does not lead to c-C4 F8 by-
(non-A5) countries (Fig. 2, red circles). This growth in devel- production and emissions, it is estimated that almost all
oped (non-A5) countries slowed down in the early 2000s and (David Sherry and Andy Lindley, personal communications,
HCFC-22 FS production in developed countries has been rel- 2022) of global HCFC-22 FS production is used to produce
atively stable since then. The global growth in HCFC-22 FS TFE and HFP, to in turn produce PTFE and related fluo-
production since 2002 has been driven by the increase in pro- ropolymers and fluorochemicals, which causes the observed
duction in developing (A5) countries (Fig. 2, blue squares), strong correlation of HCFC-22 FS production with c-C4 F8
dominated by China (Fig. 2, open orange squares). Coinci- emissions. This would probably not be the case if a signifi-
dentally or not, this is the time frame of a steady increase of cant fraction of HCFC-22 FS production were used for other
inferred global c-C4 F8 emissions. processes without c-C4 F8 by-production and emissions. Note
Atmos. Chem. Phys., 22, 3371–3378, 2022 https://doi.org/10.5194/acp-22-3371-2022J. Mühle et al.: Perfluorocyclobutane and HCFC-22 3375
high-purity HFC-23 for refrigeration use and as feedstock
to manufacture iodotrifluoromethane, halon-1301 and from
this, fipronil pesticide, mefloquine (antimalarial) and DPP-
IV inhibitor (antidiabetic) pharmaceuticals (TEAP, 2021).
The observed post-2001 correlation between c-C4 F8
emissions and HCFC-22 FS use supports our hypothesis
that current global emissions of c-C4 F8 are dominated
by HCFC-22 FS use to produce TFE/HFP and related
products. The correlation indicates an emission factor
(EF) of (0.0031 ± 0.0001) kg c-C4 F8 emitted per kg of
HCFC-22 produced for FS use (to produce TFE/HFP) with
an intercept of 0.14 Gg yr−1 c-C4 F8 , presumably reflecting
c-C4 F8 emissions from other sources, such as semiconductor
(SC), photovoltaic (PV), liquid crystal display (LCD), and
micro-electromechanical system (MEMS) production. The
Figure 2. HCFC-22 feedstock (FS) production (Gg yr−1 ). Global
annual reports of the World Semiconductor Council (WSC)
HCFC-22 FS production (green triangles) is the sum of HCFC-22 (http://www.semiconductorcouncil.org/public-documents/
FS production in non-A5 (developed, red circles) and A5 (develop- joint-statements-from-prior-wsc-meetings/, last access:
ing, blue squares) countries. Since about 2002, the increasing trend 20 January 2022) contain estimates of c-C4 F8 emis-
of global HCFC-22 FS production is dominated by growth in A5 sions from SC production in China, Taiwan, Europe,
countries, particularly China (orange open squares), while HCFC- Japan, South Korea, and the United States. They range
22 FS production in non-A5 countries has been relatively stable. from ∼ 0.05 Gg yr−1 in 2012–2014 to ∼ 0.11 Gg yr−1 in
2018–2019, somewhat smaller than the 0.14 Gg yr−1 c-
C4 F8 intercept. We also updated the global c-C4 F8
bottom-up inventory from Mühle et al. (2019) using
the 2021 National Inventory Submissions to UNFCCC
(https://unfccc.int/ghg-inventories-annex-i-parties/2021,
last access: 23 April 2021) and then augmented this with
their top-down emission estimates for Western Japan,
South Korea, North Korea, and Taiwan (but not China).
The resulting emission estimates are ∼ 0.09 Gg yr−1 in
2012–2019 and include top-down c-C4 F8 emission estimates
from all processes such as SC, PV, LCD, and MEMS
production in these four countries, but also from any
HCFC-22 FS pyrolysis in these countries, most notably in
Japan. We did not include U.S. EPA emission estimates of
∼ 0.06 Gg yr−1 c-C4 F8 from U.S. fluorinated gas producers
(https://www.epa.gov/ghgreporting/data-sets, last access:
Figure 3. The relationship between A5 (developing, blue squares), 26 January 2022) in this updated estimate, as most of these c-
non-A5 (developed, red circles) countries and total global HCFC- C4 F8 emissions stem from facilities that pyrolyze HCFC-22
22 feedstock (FS, green triangles) production and global c-C4 F8 (Deborah Ottinger, personal communication, 2022). Overall,
(PFC-318) emissions (2002–2019). the data support our conclusion that currently c-C4 F8
emissions from sources other than HCFC-22 FS use (to
produce TFE/HFP) are small, perhaps ∼ 0.1–0.14 Gg yr−1 .
that the HCFC-22 to TFE route (with c-C4 F8 by-product) can Note that a fit of HCFC-22 FS production in develop-
also be used to produce HCFC-225 isomers and hydrofluo- ing (A5) countries and global c-C4 F8 emissions results in a
roolefin HFO-1234yf (CF3 -CF=CH2 ) (Sherry et al., 2019), similar EF (slope) of (0.0033 ± 0.0002) kg kg−1 (R 2 = 0.97,
with HFO-1234yf being the preferred replacement for HFC- p < 0.01, blue squares and fit, 2002–2019). The reason is
134a (CF3 -CFH2 ) in mobile air conditioning (MAC). that HCFC-22 FS use in developed (non-A5, see Fig. 2, red
Current estimates are that perhaps 3 % of HCFC-22 FS circles) countries has been essentially stable since the early
produced is used in reactions other than the TFE/HFP route 2000s (Fig. 3, red circles, 2002–2019) causing a change in
(David Sherry and Andy Lindley, personal communications, the offset rather than in the slope (EF). We therefore can-
2022) that is without c-C4 F8 by-product; products include not determine whether current c-C4 F8 emission factors from
sulfentrazone herbicide, pantoprazole (acid reflux) pharma- HCFC-22 FS use in developing (A5) and developed (non-
ceutical, isoflurane and desflurane anesthetics, as well as A5) countries are similar or not. Atmospheric measurements
https://doi.org/10.5194/acp-22-3371-2022 Atmos. Chem. Phys., 22, 3371–3378, 20223376 J. Mühle et al.: Perfluorocyclobutane and HCFC-22
covering individual countries and facilities are needed to de- 4 Summary and conclusions
termine this.
The global EF of ∼ 0.003 kg kg−1 or ∼ 0.3 % (by weight) Emissions of c-C4 F8 (PFC-318, perfluorocyclobutane) into
of c-C4 F8 emitted per HCFC-22 FS used are similar to the global atmosphere have steadily increased since 2002
the optimal production conditions explored by Murphy et from 0.77 to 2.32 Gg yr−1 in 2020 (24 million metric tons
al. (1997) of less than 0.5 % c-C4 F8 by-product of the com- of CO2 equivalents per year). We find that the chemical re-
bined TFE and HFP yield (excluding other by-products). lationship between industrial scale HCFC-22 pyrolysis and
Historic c-C4 F8 EFs were probably much higher, particu- c-C4 F8 by-production leads to a tight correlation between
larly during the early decades of PTFE production (1950– global HCFC-22 feedstock (FS) production and global c-
1990) when process controls or abatement were likely not in C4 F8 emissions from 2002 to 2019. This correlation arises as
place. From the 1980s onwards, it is likely that EFs steadily almost all of the HCFC-22 FS production is used to produce
improved with the advent of UNFCCC emission reporting TFE and HFP via HCFC-22 pyrolysis, with c-C4 F8 as by-
requirements in the 1990s, concerns about the environment, product. Emission factors are estimated to be ∼ 0.003 kg c-
climate change and product stewardship, abatement, and per- C4 F8 emitted per kg of HCFC-22 FS (to produce TFE and
haps collection of c-C4 F8 for use in the semiconductor in- HFP) or ∼ 0.3 % (by weight). In 2018, one of the largest
dustry, where it can be easily abated (Mühle et al., 2019; TFE producer in China confirmed c-C4 F8 by-product forma-
David Sherry, personal communication, 2022). We can in- tion, which, unless recovered or recycled, may lead to c-C4 F8
vestigate the EF for the period from 1996 to 2001, be- emissions. Historically, similar c-C4 F8 by-product venting
fore the start of any significant production of HCFC-22 for occurred in the United States and Europe and may still oc-
FS uses in developing (A5) countries, as c-C4 F8 emissions cur. Based on the available atmospheric measurements we
and developed (non-A5) HCFC-22 FS production were both cannot determine whether current EFs in developed (non-A5)
relatively stable (Fig. 2). Assuming that all of the HCFC- and developing (A5) countries are similar or dissimilar. At-
22 produced for FS uses in developed (non-A5) countries mospheric measurements covering individual countries and
was pyrolyzed to TFE/HFP with c-C4 F8 by-product emis- facilities are needed to investigate this.
sions and that other sources of c-C4 F8 were small, an EF of Closely related to emissions of c-C4 F8 are emissions of
0.0052 ± 0.0004 kg kg−1 could be calculated, which is larger hydrofluorocarbon-23 (HFC-23), also a strong GHG, which
than the global EF in recent years, suggesting that EF reduc- has long been a known by-product of the actual production of
tions were still progressing. HCFC-22 from chloroform (CHCl3 ). Emissions of HFC-23
Lastly, using the HCFC-22 FS production data for China contribute unnecessarily to the carbon footprint of HCFC-
(Table 1) and the top-down c-C4 F8 emission estimates from 22 industry despite technical solutions, regulations, and fi-
Mühle et al. (2019) we can also investigate emission factors nancial incentives (e.g., Stanley et al., 2020). Similarly, we
for China. This is of interest as (84 ± 6) % of HCFC-22 FS have shown strong evidence that use of HCFC-22 feedstock
production in developing (A5) countries occurred in China for pyrolysis to TFE/HFP to produce fluoropolymers and re-
(2008–2018). A caveat is that the underlying atmospheric lated fluorochemicals likely causes most of the global c-C4 F8
measurements were mostly sensitive to emissions in eastern emissions. To reduce overall global GHG emissions of the
China, which means that emissions from several production HCFC-22/TFE/HFP/PTFE industry, further efforts to miti-
complexes in other parts of China (see the Supplement and gate c-C4 F8 and HFC-23 emissions should be considered,
Fig. 7 in Mühle et al., 2019) with likely c-C4 F8 emissions e.g., through process optimization, abatement, or different
are probably missing. Still, dividing the c-C4 F8 emissions manufacturing processes such as refined methods of electro-
for eastern China of 0.67±0.13 (∼ 32 % of global emissions, chemical fluorination and waste recycling.
Mühle et al., 2019) for 2016/2017 by the HCFC-22 FS pro-
duction reported by China for these years (Table 1), results
in an EF of 0.0021 ± 0.0003 kg kg−1 . This is lower than the Code and data availability. The data used in this work are
EF determined for the total global (or all developing (A5) available in the Supplement. Most up-to-date and quality-
controlled AGAGE data are available at http://agage.mit.edu/
countries) in recent years, which seems unlikely, since the
data/agage-data (last access: 18 August 2021) (http://agage.eas.
increase in global (and A5 country) HCFC-22 FS production
gatech.edu/data_archive/agage/gc-ms-medusa/complete/, last ac-
is driven by increases in China (Table 1, Fig. 2). Most proba- cess: 18 August 2021; http://agage.eas.gatech.edu/data_archive/
bly, total Chinese c-C4 F8 emissions are larger than those de- agage/gc-ms-medusa/monthly/, last access: 18 August 2021) and/or
termined for eastern China. More atmospheric measurements upon request. AGAGE data are also regularly submitted to https:
covering other parts of China are needed to investigate this. //data.ess-dive.lbl.gov/data (last access: 18 August 2021); at the
time of writing, the most recent AGAGE data are available at
https://doi.org/10.15485/1841748 (Prinn et al., 2022). AGAGE 12-
box model code can be made available upon request by contacting
Matthew Rigby.
Atmos. Chem. Phys., 22, 3371–3378, 2022 https://doi.org/10.5194/acp-22-3371-2022J. Mühle et al.: Perfluorocyclobutane and HCFC-22 3377
Supplement. The supplement related to this article is available Department for Business, Energy and Industrial Strategy, UK
online at: https://doi.org/10.5194/acp-22-3371-2022-supplement. Government (grant no. 1537/06/2018), the National Oceanic and
Atmospheric Administration (grant no. 1305M319CNRMJ0028),
the Commonwealth Scientific and Industrial Research Or-
Author contributions. Measurements and/or oversight for mea- ganisation, the Bureau of Meteorology, Australian Govern-
surement collection were provided by JM, KMS, JK, SP, CMH, ment, the National Research Foundation of Korea (grant
PBK, PJF, SO’D, RS, and DY. CMH provided and maintained the no. 2020R1A2C3003774), and the Natural Environment Re-
gravimetric SIO calibration scale for c-C4 F8 . RHJW processed the search Council (grant nos. NE/S004211/1, NE/V002996/1, and
AGAGE data and produced pollution-free monthly mean c-C4 F8 NE/N016548/1).
abundances. MR and LMW performed the model analysis. PKS
wrote the GCWerks software to control the instruments, acquire
the data, collect the data from all stations, and perform calcula- Review statement. This paper was edited by Ivan Kourtchev and
tions necessary to provide calibrated end results. JM conceptual- reviewed by four anonymous referees.
ized the work, analyzed the data, visualized the data, and wrote the
manuscript with contributions from LJMK and all other co-authors.
LJMK provided most valuable insight into industrial processes and
collected UNEP data. RGP and RFW were responsible for the over-
all management and the funding for this work. References
Arnold, T., Mühle, J., Salameh, P. K., Harth, C. M., Ivy,
D. J., and Weiss, R. F.: Automated measurement of nitro-
Competing interests. The contact author has declared that nei-
gen trifluoride in ambient air, Anal. Chem., 84, 4798–4804,
ther they nor their co-authors have any competing interests.
https://doi.org/10.1021/ac300373e, 2012.
Broyer, E., Bekker, A. Y., and Ritter, A. B.: Kinetics of the pyrolysis
of chlorodifluoromethane, Ind. Eng. Chem. Res., 27, 208–211,
Disclaimer. Publisher’s note: Copernicus Publications remains https://doi.org/10.1021/ie00073a039, 1988.
neutral with regard to jurisdictional claims in published maps and Chinoy, P. B. and Sunavala, P. D.: Thermodynamics and kinetics
institutional affiliations. for the manufacture of tetrafluoroethylene by the pyrolysis of
chlorodifluoromethane, Ind. Eng. Chem. Res., 26, 1340–1344,
https://doi.org/10.1021/ie00067a013, 1987.
Acknowledgements. Overall operation of the AGAGE network, Cunnold, D. M., Steele, L. P., Fraser, P. J., Simmonds, P. G., Prinn,
including the measurements at Mace Head, Trinidad Head, Cape R. G., Weiss, R. F., Porter, L. W., O’Doherty, S., Langenfelds,
Matatula, Ragged Point, and Cape Grim, was supported by National R. L., Krummel, P. B., Wang, H. J., Emmons, L., Tie, X. X.,
Aeronautics and Space Administration grants to SIO and MIT. Ad- and Dlugokencky, E. J.: In situ measurements of atmospheric
ditional funding was provided by the Department for Business, En- methane at GAGE/AGAGE sites during 1985–2000 and result-
ergy & Industrial Strategy (BEIS) to the University of Bristol for ing source inferences, J. Geophys. Res., 107, ACH 20-21-20-18,
Mace Head and the National Oceanic and Atmospheric Admin- https://doi.org/10.1029/2001JD001226, 2002.
istration (NOAA) to the University of Bristol for Ragged Point. Ebnesajjad, S.: 6 – Preparation of Tetrafluoroethylene and
We thank the Commonwealth Scientific and Industrial Research Other Monomers, in: Fluoroplastics (Second Edition),
Organisation (CSIRO, Australia) and the Bureau of Meteorology 1 edn., William Andrew Publishing, Oxford, 48–75,
(Australia) for their ongoing long-term support and funding of the https://doi.org/10.1016/B978-1-4557-3199-2.00006-9, 2015.
Cape Grim station and the Cape Grim science program. Sunyoung Forster, P., Storelvmo, T., Armour, K., Collins, W., Dufresne, J.-
Park and operations of the Gosan station on Jeju Island, South Ko- L., Frame, D., Lunt, D. J., Mauritsen, T., Palmer, M. D., Watan-
rea, were supported by the National Research Foundation of Ko- abe, M., Wild, M., and Zhang, H.: The Earth’s energy budget,
rea (NRF) grant funded by the Korean government (MSIT). Lam- climate feedbacks, and climate sensitivity, in: Climate Change
bert J. M. Kuijpers was supported by A/gent. Matthew Rigby and 2021: The Physical Science Basis, Contribution of Working
Luke M. Western were supported by the UK Natural Environment Group I to the Sixth Assessment Report of the Intergovern-
Research Council. We are indebted to the staff and scientists at mental Panel on Climate Change, Chapter 7, Cambridge Uni-
AGAGE and other sites for their continuing contributions to pro- versity Press, Cambridge, United Kingdom and New York, NY,
duce high-quality measurements of atmospheric trace gases. We USA, https://www.ipcc.ch/report/ar6/wg1/ (last access: 10 Au-
thank David Sherry (Nolan Sherry & Associates), Andy Lindley gust 2021), 2021.
(UNEP Medical and Chemicals Technical Options Committee, MC- Gangal, S. V. and Brothers, P. D.: Perfluorinated Poly-
TOC) and Deborah Ottinger (U.S. EPA), as well as the four anony- mers, in: Kirk-Othmer Encyclopedia of Chemical Tech-
mous reviewers for their invaluable insights and excellent sugges- nology, John Wiley & Sons, Hoboken, New Jersey,
tions on how to improve the manuscript. https://doi.org/10.1002/0471238961.2005201807011407.a02.
pub3, 2015.
Harnisch, J.: Reactive Fluorine Compounds, in: Reactive Halogen
Financial support. This research has been supported by Compounds in the Atmosphere Vol. 4 Part E, The Handbook of
the National Aeronautics and Space Administration (grant Environmental Chemistry, Springer Berlin/Heidelberg, 81–111,
nos. NNX16AC96G, NNX16AC97G, and NNX16AC98G), the https://doi.org/10.1007/10628761_3, 1999.
https://doi.org/10.5194/acp-22-3371-2022 Atmos. Chem. Phys., 22, 3371–3378, 20223378 J. Mühle et al.: Perfluorocyclobutane and HCFC-22 Mierdel, K., Jess, A., Gerdes, T., Schmidt, A., and Hintzer, K.: Prinn, R., Weiss, R., Arduini, J., Arnold, T., DeWitt, H. L., Fraser, Energy and Resource Efficient Production of Fluoroalkenes P., Ganesan, A., Gasore, J., Harth, C., Hermansen, O., Kim, in High Temperature Microreactors, ChemEngineering, 3, 77, J., Krummel, P., Loh, Z., Lunder, C., Maione, M., Manning, https://doi.org/10.3390/chemengineering3040077, 2019. A., Miller, B., Mitrevski, B., Mühle, J., O’Doherty, S., Park, Miller, B. R., Weiss, R. F., Salameh, P. K., Tanhua, T., Gre- S., Reimann, S., Rigby, M., Saito, T., Salameh, P., Schmidt, ally, B. R., Mühle, J., and Simmonds, P. G.: Medusa: A R., Simmonds, P., Steele, P., Vollmer, M., Wang, H., Yao, sample preconcentration and GC/MS detector system for in B., Young, D., and Zhou, L.: The Advanced Global Atmo- situ measurements of atmospheric trace halocarbons, hydro- spheric Gases Experiment (AGAGE) Data. Advanced Global At- carbons, and sulfur compounds, Anal. Chem., 80, 1536–1545, mospheric Gases Experiment (AGAGE), ESS-DIVE repository https://doi.org/10.1021/ac702084k, 2008. [data set], https://doi.org/10.15485/1841748, 2022. Montzka, S. A., Velders, G. J. M., Krummel, P. B., Mühle, J., Orkin, Rigby, M., Prinn, R. G., O’Doherty, S., Montzka, S. A., McCulloch, V. L., Park, S., Shah, N., Walter-Terrinonim H., Bernath, P., A., Harth, C. M., Mühle, J., Salameh, P. K., Weiss, R. F., Young, Boone, C., Hu, L., Kurylo, M. J., Elvidge, E. L., Maione, M., D., Simmonds, P. G., Hall, B. D., Dutton, G. S., Nance, D., Mon- Miller, B. R., O’Doherty, S., Rigby, M., Simpson, I. J., Vollmer, deel, D. J., Elkins, J. W., Krummel, P. B., Steele, L. P., and M. K., Weiss, R. F., Kuijpers, L. J. M., and Sturges, W. T.: Hy- Fraser, P. J.: Re-evaluation of the lifetimes of the major CFCs and drofluorocarbons (HFCs) (Chapter 2), in: Scientific Assessment CH3 CCl3 using atmospheric trends, Atmos. Chem. Phys., 13, of Ozone Depletion: 2018, Global Ozone Research and Monitor- 2691–2702, https://doi.org/10.5194/acp-13-2691-2013, 2013. ing Project–Report No. 58, World Meteorological Organization, Rigby, M., Prinn, R. G., O’Doherty, S., Miller, B. R., Ivy, D., Geneva, Switzerland, ISBN 978-1-7329317-1-8, 2018. Mühle, J., Harth, C. M., Salameh, P. K., Arnold, T., Weiss, R. Mühle, J., Ganesan, A. L., Miller, B. R., Salameh, P. K., Harth, F., Krummel, P. B., Steele, L. P., Fraser, P. J., Young, D., and C. M., Greally, B. R., Rigby, M., Porter, L. W., Steele, L. P., Simmonds, P. G.: Recent and future trends in synthetic green- Trudinger, C. M., Krummel, P. B., O’Doherty, S., Fraser, P. J., house gas radiative forcing, Geophys. Res. Lett., 41, 2623–2630, Simmonds, P. G., Prinn, R. G., and Weiss, R. F.: Perfluorocarbons https://doi.org/10.1002/2013gl059099, 2014. in the global atmosphere: tetrafluoromethane, hexafluoroethane, Sherry, D., Nolan, M., Seidel, S., and Andersen, S. O.: HFO- and octafluoropropane, Atmos. Chem. Phys., 10, 5145–5164, 1234yf: An Examination of Projected Long-Term Costs of https://doi.org/10.5194/acp-10-5145-2010, 2010. Production, report, https://www.c2es.org/document/hfo-1234yf- Mühle, J., Trudinger, C. M., Western, L. M., Rigby, M., Vollmer, an-examination-of-projected-long-term-costs-of-production/ M. K., Park, S., Manning, A. J., Say, D., Ganesan, A., Steele, (last access: 4 September 2020), 2019. L. P., Ivy, D. J., Arnold, T., Li, S., Stohl, A., Harth, C. M., Stanley, K. M., Say, D., Mühle, J., Harth, C. M., Krummel, P. B., Salameh, P. K., McCulloch, A., O’Doherty, S., Park, M.-K., Jo, Young, D., O’Doherty, S. J., Salameh, P. K., Simmonds, P. G., C. O., Young, D., Stanley, K. M., Krummel, P. B., Mitrevski, Weiss, R. F., Prinn, R. G., Fraser, P. J., and Rigby, M.: Increase B., Hermansen, O., Lunder, C., Evangeliou, N., Yao, B., Kim, J., in global emissions of HFC-23 despite near-total expected reduc- Hmiel, B., Buizert, C., Petrenko, V. V., Arduini, J., Maione, M., tions, Nat. Commun., 11, 397, https://doi.org/10.1038/s41467- Etheridge, D. M., Michalopoulou, E., Czerniak, M., Severing- 019-13899-4, 2020. haus, J. P., Reimann, S., Simmonds, P. G., Fraser, P. J., Prinn, R. TEAP: Technology and Economic Assessment Panel, G., and Weiss, R. F.: Perfluorocyclobutane (PFC-318, c-C4 F8 ) in May 2020, Volume 3, Assessment of the Funding Re- the global atmosphere, Atmos. Chem. Phys., 19, 10335–10359, quirement for the Replenishment of the Multilateral https://doi.org/10.5194/acp-19-10335-2019, 2019. Fund for the Period 2021–2023, Nairobi, Kenya, 108, Murphy, P., Schleinix, H., and Van Bramer, D.: Synthesis of tetraflu- https://ozone.unep.org/system/files/documents/TEAP_decision_ oroethylene, Patent 5,672,784, 30 September 1997. XXXI-1_replenishment-task-force-report_may2020.pdf (last Prinn, R. G., Weiss, R. F., Arduini, J., Arnold, T., DeWitt, H. L., access: 24 November 2020), 2020. Fraser, P. J., Ganesan, A. L., Gasore, J., Harth, C. M., Her- TEAP: Technology and Economic Assessment Panel, September mansen, O., Kim, J., Krummel, P. B., Li, S., Loh, Z. M., Lun- 2021, Volume 1, Report of the Technology and Economic der, C. R., Maione, M., Manning, A. J., Miller, B. R., Mitrevski, Assessment Panel, Nairobi, Kenya, 117, https://ozone.unep.org/ B., Mühle, J., O’Doherty, S., Park, S., Reimann, S., Rigby, M., system/files/documents/TEAP-2021-Progress-report.pdf (last Saito, T., Salameh, P. K., Schmidt, R., Simmonds, P. G., Steele, access: 4 February 2022), 2021. L. P., Vollmer, M. K., Wang, R. H., Yao, B., Yokouchi, Y., Young, UNEP: Data on HCFC-22 production as reported under Article 7 by D., and Zhou, L.: History of chemically and radiatively impor- parties to the Montreal Protocol, 1989–2019, United Nations En- tant atmospheric gases from the Advanced Global Atmospheric vironment Programme, Ozone Secretariat, Nairobi, Kenya, 2021. Gases Experiment (AGAGE), Earth Syst. Sci. Data, 10, 985– 1018, https://doi.org/10.5194/essd-10-985-2018, 2018. Atmos. Chem. Phys., 22, 3371–3378, 2022 https://doi.org/10.5194/acp-22-3371-2022
You can also read