Corporate Presentation - Crescent Point Energy Corp.

Page created by Erica King
 
CONTINUE READING
Corporate Presentation - Crescent Point Energy Corp.
CORPORATE PRESENTATION

                         May 2022
‫׀‬

                         Corporate Presentation
CRESCENT POINT

                                                                        CRESCENT POINT
                                                  Bringing Energy To Our World - The Right Way
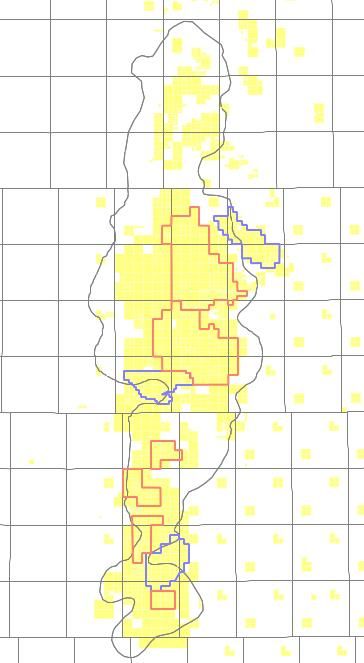
Corporate Presentation - Crescent Point Energy Corp.
CPG At A Glance
                            CPG (TSX and NYSE)
CORPORATE PRESENTATION

                            Market Capitalization                                                            $5.5 billion

                            Net Debt                                                                         $1.8 billion                     Central Alberta

                                                                                                                                                                         Southeast
                            Enterprise Value                                                                 $7.2 billion                                              Saskatchewan

                            Annualized Dividend                                                             $0.26/share
                                                                                                                                             Southwest
                            Dividend Yield                                                                          ~3.0%                   Saskatchewan                North Dakota
‫׀‬
CRESCENT POINT

                            Average Daily Trading Volume                                           19.4 million shares
                                                                                                                                                                                   Asset Characteristics
                            2022 Guidance & Excess Cash Flow                                                                                                             ✓         High rate of return & quick payout wells

                            Annual Average Production                                     133,000 – 137,000 boe/d
                                                                                                                                                                         ✓         Top quartile netbacks
                                                                                                                                                                         ✓         Liquids weighted asset base
                                    % Liquids                                                                        ~80%
                                                                                                                                                                         ✓         Low risk drilling inventory
                            Development Capital Expenditures                                      $875 – $900 million                                                    ✓         Long life, low decline assets
                            Excess Cash Flow                                                        $1.2 – $1.4 billion                                                  ✓         Strong market access & scalability
                            (US$80 - US$100 WTI)

                         Numbers may not add due to rounding. Avg. daily trading volume based on CDN and US volumes from trailing 3-months as of May 6, 2022. Enterprise value, net debt and excess cash flow are specified financial
                                                                                                                                                                                                                                           2
                         measures - refer to the Specified Financial Measures section. Market capitalization, enterprise value and dividend yield based on share price as of market close on May 6, 2022. Net debt as at March 31, 2022.
Corporate Presentation - Crescent Point Energy Corp.
Differentiated Asset Base Generates Significant Excess Cash Flow
                                                   Top Quartile Operating Netback                                                                                                        Attractive Royalty Regime
                                                                           2022E Operating Netback                                                               40%                                      2022E Royalty Rate
CORPORATE PRESENTATION

                                         $100
                                                                                                                                                                                                                       ~30%
                                         $75                                                                                                                     30%
                               $ / Boe

                                         $50                                                                                                                     20%
                                                                                                                                                                                 ~14%                                                                    25-40% in
                                                                                                                                                                                                                                                      royalties based
                                         $25                                                                                                                     10%                                                                                  on net revenue

                                          $0                                                                                                                     0%
                                                   Peer 1

                                                                  Peer 2

                                                                             Peer 3

                                                                                      Peer 4

                                                                                                Peer 5

                                                                                                         Peer 6

                                                                                                                  Peer 7

                                                                                                                           Peer 8

                                                                                                                                    Peer 9
                                                            CPG

                                                                                                                                             Peer 10

                                                                                                                                                       Peer 11
                                                                                                                                                                                  CPG                                Major U.S.                   Oil Sands Projects
                                                                                                                                                                                                                    Basins (Avg.)                   (Post-Payout)
‫׀‬
CRESCENT POINT

                                                                  Strong Differentials                                                                                                          Low Decline Assets
                                                2022E Oil & Condensate Production Breakdown by Stream                                                                                           2022E Corporate Decline Rate
                                                                                                                                                                 40%
                                                 Condensate (20%)                              C5                                ~35% of production
                                                                                                                               received pricing near /           30%
                                                                                               UHC                             above WTI in Q1 2022

                                                                                               MSW                                                               20%
                                                       Light Oil (60%)

                                                                                               LSB                                                               10%

                                                                                                                                                                  0%

                                                                                                                                                                                                                                Peer 6

                                                                                                                                                                                                                                                  Peer 8
                                                                                                                                                                       Peer 1

                                                                                                                                                                                Peer 2

                                                                                                                                                                                                 Peer 3

                                                                                                                                                                                                           Peer 4

                                                                                                                                                                                                                       Peer 5

                                                                                                                                                                                                                                         Peer 7

                                                                                                                                                                                                                                                           Peer 9
                                                                                                                                                                                          CPG

                                                                                                                                                                                                                                                                    Peer 10

                                                                                                                                                                                                                                                                              Peer 11
                                                  Medium Oil (20%)
                                                                                               FOS
                                                 (premium to WCS)

                         Operating netback is a specified financial measure - refer to the Specified Financial Measures section. Peer List: ARX, BTE, EOG, ERF, FANG, NVA, OVV, PXD, TOU, VET, WCP. Major U.S. Basins include Permian,
                         Eagle Ford and Bakken. Oil sands projects post-payout net revenue is gross revenue less operating costs, capital costs, return allowance and other costs, plus other net proceeds; source: Government of Alberta.
                                                                                                                                                                                                                                                                                        3
                         CPG royalty rate based on mid-point of guidance. Operating netback, royalty rate and decline rate source: Peters & Co. Equity Research (May 2, 2022; 2022 strip of US$96.85/bbl WTI & CAD/USD FX of $0.78).
Corporate Presentation - Crescent Point Energy Corp.
Q1 2022 Highlights
CORPORATE PRESENTATION

                                   Significant Excess                                                             Increasing                          Strong
                                  Cash Flow Generation                                                         Return of Capital               Operational Execution
‫׀‬
CRESCENT POINT

                          ~$290MM of excess cash flow in Q1                                          Increased quarterly dividend >40%     Achieved emissions intensity reduction
                          2022, supporting further debt reduction                                     to $0.065/sh ($0.26/sh annualized)    target of 50% ahead of 2025 timeframe
                           and return of capital to shareholders

                         On-track to achieve near-term net debt                                          Repurchased ~13.5MM shares           Further reduced drilling days in
                            target of $1.3B during Q3 2022E                                             (~$110MM) since December 2021        Kaybob Duvernay and North Dakota

                                                                                                                                                                                 4
                         Timeline to achieve near-term net debt target is based on strip commodity prices as of May 3, 2022.
Disciplined 2022 Capital Expenditures Budget

                                                    Capital Expenditures                                             Production
CORPORATE PRESENTATION

                                                                  4%                                                    5%
                                                                                                                                   20%
                                                                                       24%                    15%
                                                 19%
                                                                                             SW SK

                                                                                             SE SK
‫׀‬

                                                        $875 - $900MM                        Central AB
                                                                                                                  133,000 - 137,000
CRESCENT POINT

                                                                                                                       boe/d
                                                                                             North Dakota
                                                                                                            27%
                                                                                             Other
                                                  27%                                  26%                                            33%

                          •      Narrowed capital expenditures guidance, reflecting an increased cost inflation assumption of up to 15% (net of efficiencies)

                          •      Production guidance remains unchanged
                                                                                                                                                                5
                         Prior 2022 capital expenditures guidance was $825 - $900MM.
Managing Budget in an Inflationary Environment

                                                                         2022 Capital Expenditures Guidance Progression
CORPORATE PRESENTATION

                                            $1,000

                                                                                                                                                         $875 - $900MM
                                             $900 $825 - $900MM                                     $825 - $900MM
                           Millions $ CAD

                                             $800
‫׀‬
CRESCENT POINT

                                             $700

                                             $600

                                             $500
                                                        Sept. 2021       Inflation   Efficiencies      Dec. 2021       Inflation     Efficiencies &         Q1 2022
                                                     Prelim. Guidance   Assumption                  Formal Guidance   Assumption   Disciplined Capital      Narrowed
                                                                                                                                       Spending             Guidance

                                                           Mitigating cost inflation by realizing efficiencies and supply chain management

                                                                                                                                                                         6
2022 Cash Flow Sensitivity & Allocation

                                                               ~$950MM - $1.1B of available funds in 2022 (at US$80 – US$100 WTI) after dividends and planned
CORPORATE PRESENTATION

                                                                share repurchases for further debt reduction, return of capital to shareholders and other initiatives

                                                                                                                                          ~$1.2 - $1.4B
                                                                                                                                                                              ~$140MM
                                                                                                                                                                                                           Up to $150MM
                                         US$100 WTI
                                          US$80 WTI
‫׀‬
CRESCENT POINT

                                                                                                             ~$80MM
                                                                        $875 - $900MM

                                         Adjusted Funds               Development Capital                 Other Corporate                Excess Cash Flow                       Dividend               H1 2022 Planned Share
                                              Flow                       Expenditures                          Items                                                                                        Repurchases

                                                            2022 budget maximizes excess cash flow and generates strong full-cycle returns
                         Adjusted funds flow is a specified financial measure - refer to the Specified Financial Measures section. Dividend payment is based on quarterly dividend $0.045/share in Q1 and $0.065/share for Q2 – Q4 and 572MM
                         shares outstanding. ‘Other Corporate Items’ is comprised of capitalized G&A, reclamation activities and capital lease payments.
                                                                                                                                                                                                                                               7
                         Completed ~$110MM of planned share repurchases between December 6, 2021 and May 6, 2022, including ~$18MM in December. Q1/22 dividend was accrued in Q4/21.
Significant Tax Pools Enhance Excess Cash Flow
CORPORATE PRESENTATION

                                                 Consolidated Tax Pools                                                                                    2023E Cash Taxes
                                                                Billions $ CAD                                                                               % of Before Tax Cash Flow
                                                                                                                                15%

                                                                  $0.6
                                                                  $0.6
                                                                                    $2.0

                                                                                                                                10%
‫׀‬

                                                               ~$10B
CRESCENT POINT

                                                  $5.0
                                                  $4.8                                       $2.2
                                                                                           $2.2
                                                                                                                                 5%

                                                       NCLs                                                                               0%
                                                                                                                                 0%
                                                       U.S. NOLs                                                                         CPG Peer 1 Peer 2 Peer 3 Peer 4 Peer 5 Peer 6 Peer 7
                                                       Other Canadian Resource Pools
                                                       Other U.S. Pools

                         CDN Peer List: ARX, BTE, ERF, NVA, TOU, VET, WCP. Consolidated tax pools as at March 31, 2022. U.S. tax pools converted at CAD/USD FX of $0.80.
                                                                                                                                                                                                     8
                         2023E Cash Taxes: Peters & Co. Equity Research (May 2, 2022; 2022 strip of US$96.85/bbl WTI & CAD/USD FX of $0.78, 2023 strip of US$84.93/bbl WTI & CAD/USD FX of $0.78).
5 Year Outlook (2022 – 2026)
                                                                                                   Cumulative Excess Cash Flow & Net Debt / Funds Flow
CORPORATE PRESENTATION

                                                 $6.0                                       $6.0                                                                                                          1.0x                               1.0x

                                                    Cumulative After-Tax Excess Cash Flow

                                                                                                                                                                                                                     Net Debt / Funds Flow
                                                 $4.0                                       $4.0                                                                                                          0.0x                               0.0x
                                                               (Billions $ CAD)
‫׀‬

                                                 $2.0                                       $2.0                                                                                                          -1.0x                              -1.0x
CRESCENT POINT

                                                 $0.0                                       $0.0                                                                                                          -2.0x                              -2.0x
                                                                                                2022E         2023E                2024E                          2025E                          2026E

                                                                                                                US$60 WTI        US$70 WTI                  US$80 WTI
                                                                                                                                                                                              Tax as a % of Funds Flow
                                                                                                                                                                                     US$60 WTI - n/a
                           •      Annual average production in the range of 133,000 – 137,000 boe/d                                                                                  US$70 WTI -
Returns Based Capital Allocation Framework & Excess Cash Flow Priorities

                                                         ASSET LEVEL
CORPORATE PRESENTATION

                                                                                                                           CORPORATE LEVEL

                                                                                                                                     Funds Flow
                                                                                                                             (Maximize with a cost discipline)

                                                               Base Plan
                                                         •    Risk Adjusted Returns
                                                              and Value Added
                                                              (Well & Project Level)
                                                                                                                             Maintenance Capital
                                                                                                                   (Total spending in context of balance sheet and returns)
‫׀‬
CRESCENT POINT

                                              Long-Term                     Environmental
                                          •   Decline Mitigation            •   ARO
                                          •   Step-out Drilling             •   Emissions Reduction
                                                                                                                        Balance Sheet / Core Dividend
                                          •   Land Expiries                 •   Asset Integrity
                                          •   Other Projects                •   Spill Prevention

                                                                                                                    Follow-on decisions compete for capital based on
                                                                                                                   expected returns and long-term corporate objectives

                                                                                                      Additional        Additional         Organic           M&A /
                                                                                                                                                                              Long-Term
                                                                                                        Debt            Return of          Growth           Enhance
                                                                                                                                                                               & Other
                                                                                                      Reduction          Capital                            Portfolio

                         ARO: Asset Retirement Obligations.                                                                                                                               10
Increasing Shareholder Returns
                                                          Reducing Net Debt                                                                                 Return of Capital to Shareholders
CORPORATE PRESENTATION

                                                       On track to achieve near-term net debt                                                               ~30% of excess cash flow to be returned to shareholders
                                                               target during Q3 2022                                                                         during H1 2022; this level continues to increase as the
                                              $2.5                                                                                                   $120    Company moves closer to its near-term net debt target

                                              $2.0

                                                                                                                                    Millions $ CAD
                                                                                                                                                     $80
                             Billions $ CAD

                                              $1.5                                                   $1.3B
‫׀‬
CRESCENT POINT

                                              $1.0
                                                                                                                                                     $40

                                              $0.5

                                              $0.0                                                                                                    $0
                                                     YE 2021              Q1 2022                Near-Term                                                  Q1 - Q3 2021     Q4 2021          Q1 2022     Q2 2022E
                                                                                               Net Debt Target
                                                                                                                                                                 Dividend      Executed / Planned Share Repurchases

                           Expect to release updated return of capital framework as CPG moves closer to attaining its near-term net debt target
                         Q1/22 dividend was accrued in Q4/21 and Q4/21 dividend was accrued in Q3/21.
                                                                                                                                                                                                                       11
                         Dividend payment is based on a quarterly dividend of $0.0025/share in Q1 – Q3 2021, $0.03/share in Q4 2021, $0.045/share in Q1 2022 and $0.065/share for Q2 2022E.
Kaybob Duvernay Advantage
                                                                                                                                                Production Results From First Fully Operated Pad
                                                                                                                                                                     Cumulative Condensate Production
CORPORATE PRESENTATION

                         • Low operating expenses and royalty rates                                                                                60,000
                                    • Benefit from existing infrastructure
                                                                                                                                                   40,000

                                                                                                                                             bbl
                         • Strong execution to date                                                                                                20,000
                                    • Lowered drilling days by >30% since entering the play,
                                      averaging
Kaybob Duvernay Provides Condensate Exposure

                                                                                  WCSB Condensate Supply / Demand Balance
CORPORATE PRESENTATION

                                             1000

                                                                        Canadian condensate pricing benefits from a high reliance on imported volumes from the U.S. and
                                                                         a strong expected demand outlook due to oil sands growth, which uses condensate as a diluent
                                             800

                                             600
                                    Mbbl/d
‫׀‬
CRESCENT POINT

                                             400

                                             200

                                               0
                                                    2010         2011     2012    2013    2014    2015    2016    2017     2018    2019   2020   2021    2022E 2023E 2024E 2025E

                                                                                          WCSB Production                Imports          WCSB Demand

                                             ~20% of CPG’s 2022E liquids production is condensate and receives strong pricing relative to WTI
                                                                                                                                                                                   13
                         Source: Peters & Co. Equity Research.
Principles for Success
                                Management execution and initiatives centered on balance sheet strength and sustainability
CORPORATE PRESENTATION
‫׀‬
CRESCENT POINT

                                                                     Strategic initiatives supported by strong ESG focus
                                                                                                                             14
                         ESG: Environmental, Social and Governance
Strategy & Focus
CORPORATE PRESENTATION

                                 Risk-Adjusted Returns – Concentrated in low-risk, high-return assets

                                 Capital Discipline – Returns-based capital allocation framework

                                 Balance Sheet Strength – Improving leverage profile provides financial and operational flexibility
‫׀‬
CRESCENT POINT

                                 Return of Capital – Focused on excess cash flow generation to optimize shareholder returns

                                 Sustainability – Strong ESG practices and focus on long-term profitability

                                 Operational Excellence – Significant technical expertise as a leader in horizontal drilling and decline mitigation

                                                                                                                                                      15
Strong ESG Practices
CORPORATE PRESENTATION

                                                  Environment                                                            Social & Safety                             Governance

                             Achieved emissions intensity reduction target                                       Safety-centric culture resulting in   Diverse, independent, experienced and highly
                              of 50% well ahead of expected 2025 timeframe                                          five-year low SIF incidents        skilled Board with oversight of ESG strategy

                                    Environmental Stewardship Funding                                       Commitment to diversity and inclusion          Compensation aligned with long-term
                                of 3-5% of annual maintenance capital budget                               with our employees and community partners    shareholder returns and ESG performance
‫׀‬
CRESCENT POINT

                                  Targeting 30% reduction in inactive well                                      >$30MM committed to communities        Integrated ESG into supplier screening process
                                             inventory by 2031                                                          since inception

                                              Committed to increased ESG transparency and disclosure through Annual Sustainability Reports
                         ARO: Asset Retirement Obligations. SIF: Serious Injury and Fatality Frequency (including potential).                                                                           16
Commitment to Environmental Stewardship
                         • Achieved emissions intensity reduction target of 50% well ahead of 2025 timeframe
CORPORATE PRESENTATION

                               • Includes a 70% reduction in absolute methane emissions
                               • Working to establish new targets and will provide more details along with sustainability report in early H2 2022

                         • Target to reduce inactive well inventory by 30% by 2031, excluding impact of dispositions
                           •   >500 inactive wells safely retired in 2021 with another 350 planned retirements in 2022

                         • Progressing on standards for freshwater use in operations
‫׀‬

                                    2017 Baseline                      2025 Target                           Achieved Targets
CRESCENT POINT

                                                                                                                50%
                                                                                                                Reduction in GHG
                                        Emission                         Emission                               emissions intensity
                                        Intensity:                       Intensity:
                                          0.041                            0.021
                                       tCO2e/boe                        tCO2e/boe                               70%
                                                                                                                Reduction in absolute
                                                                                                                methane emissions

                                             Vent     Flare    Fugem      Fuel
                                                                                                                                                    17
Our Purpose
CORPORATE PRESENTATION
‫׀‬

                                       Bringing Energy To Our World
CRESCENT POINT

                                              – The Right Way

                                                                      18
CRESCENT POINT   ‫׀‬   CORPORATE PRESENTATION

                         Appendix
                                              October 2018
Capital Markets Summary & Guidance

                            Capital Markets Summary                                                                                           2022 Guidance
CORPORATE PRESENTATION

                            CPG (TSX and NYSE)                                                                                                                                                                                    Prior                      Revised
                            Trading Price (May. 6, 2022)                                  C$9.54 (TSX), US$7.39 (NYSE)
                                                                                                                                              Annual Avg. Production (mboe/d)(1)                                               133 – 137                     133 – 137
                            Shares Outstanding                                                                           571.6 million
                                                                                                                                              Capital Expenditures
                                                                                                                                               Development Capital Expenditures ($MM)                                        $825 - $900                   $875 - $900
                            Avg. Daily Trading Volume                                                                      19.4 million                                                                                             $40                           $40
                                                                                                                                                  Capitalized G&A ($MM)

                            Dividend Yield                                                                                        ~3.0%       Total ($MM) (2)                                                                $865 - $940                   $915 - $940
‫׀‬

                            Market Capitalization                                                                           $5.5 billion
                                                                                                                                              Other Information for 2022 Guidance
CRESCENT POINT

                                                                                                                                                 Reclamation Activities ($MM) (3)                                                $20                           $20
                            Net Debt                                                                                        $1.8 billion         Capital Lease Payments ($MM)                                                    $20                           $20
                                                                                                                                                 Annual Operating Expenses ($/boe)                                          $13.25 - $13.75               $13.75 - $14.25
                            Enterprise Value                                                                                $7.2 billion         Royalties                                                                  12.5% - 13.5%                 13.5% - 14.0%

                         Numbers may not add due to rounding.                                                                                1) Total annual average production (boe/d) is comprised of approximately 80% Oil, Condensate & Liquids and 20% Natural Gas
                         Avg. daily trading volume based on CDN and US volumes from trailing 3-months as of May 6, 2022                      2) Land expenditures and net property acquisitions and dispositions are not included. Development capital expenditures spend is
                         Divided yield is based on second quarter 2022 dividend that equates to $0.26 per share per annum                       allocated on an approximate basis as follows: 85% drilling & development and 15% facilities & seismic
                         Shares outstanding (common shares) as at May 6, 2022                                                                3) Reflects Crescent Point's portion of its expected total budget
                         Market capitalization, enterprise value and dividend yield based on share price as of market close on May 6, 2022
                         Net debt as at March 31, 2022

                                                                                                                                                                                                                                                                               20
Hedging Strategy Protects Excess Cash Flow Generation
CORPORATE PRESENTATION

                                                                          60,000                                Hedging Summary
                                                                                            ~50%
                                                 Hedge Volume (bbl/d)                                            ~45%                       ~45%
                                                                          40,000

                                                                                                                                                               ~20%
                                                                          20,000

                                                                                                                                                                          ~10%
‫׀‬
CRESCENT POINT

                                                                               -
                                                                                           Q2 2022E           Q3 2022E                     Q4 2022E           Q1 2023E   Q2 2023E
                                                                             Swap (C$)      $83.03              $83.04                      $83.04             $90.04
                                                                        Bought Put (C$)     $77.25              $77.25                      $77.25             $96.00
                               Wtd. Avg.
                                 3-Way                                    Sold Call (C$)    $88.18              $88.18                      $88.18            $118.11
                              Collar Prices
                                                                          Sold Put (C$)     $66.40              $66.40                      $66.40             $76.00

                              Wtd. Avg.                                      Floor (C$)     $75.69              $75.69                      $75.69             $91.00     $102.74
                             Collar Prices                                  Ceiling (C$)    $88.22              $88.22                      $88.22            $105.43     $116.37

                                                                                                      Collars                  3-Way Collars          Swaps

                                                                                                                                                                                    21
                         Hedged volumes as at May 6, 2022. Hedged production is a percentage of oil and liquids net of royalty interest.
Significant Financial Flexibility & Liquidity

                                                                                                    Senior Note Maturity Schedule
CORPORATE PRESENTATION

                                                          $750

                                                                 Significant excess cash flow generation and liquidity in place for upcoming senior note maturities

                                                          $500
                                         Millions $ CAD
‫׀‬

                                                          $250
CRESCENT POINT

                                                           $0
                                                                     2022                     2023                      2024                      2025                      2026    2027

                               • Reduced net debt by ~$230MM in Q1 2022

                               • Current credit facilities total $2.3B, with unutilized credit capacity of >$2.0B as at March 31, 2022

                               • ~80% of net debt currently comprised of senior notes

                         Senior notes include underlying currency swaps. Excess cash flow is prior to return of capital to shareholders. 2022 senior note maturities occur in Q2.          22
Operational Excellence & Continuous Improvement
                                                                                                     Experienced Operator                                                                                        Knowledge Transfer and Innovation
                                                                                                       Top 10 North American operators                                                                               Continued reduction in drilling & completions costs
                            Hz Wells Drilled & Completed
CORPORATE PRESENTATION

                                                                          8,000                                                                                                                                                  (Down ~30% since 2017)
                                                                                                                                                                                                        $800
                                                                          6,000
                                    (2010-2020)

                                                                                                                                                                                       CAD$/meter
                                                                                                                                                                                                        $600

                                                                          4,000
                                                                                                                                                                                                        $400

                                                                          2,000                                                                                                                         $200

                                                                             0                                                                                                                           $0
                                                                                                                                                                                                                  2017          2018           2019               2020          2021
                                                                                  Peer 1

                                                                                            Peer 2

                                                                                                              Peer 3

                                                                                                                        Peer 4

                                                                                                                                    Peer 5

                                                                                                                                             Peer 6

                                                                                                                                                         Peer 7

                                                                                                                                                                  Peer 8

                                                                                                                                                                              Peer 9
                                                                                                     CPG

                                                                                                                                                                                                                                     Completion        Drilling
‫׀‬
CRESCENT POINT

                                                                                                      Safety-Centric Culture                                                                                                           ESG Focus
                                          Incidents/200k Exposure Hours

                                                                                  Focus on safe operations resulting in multi-year low safety scores                                                                         Corporate GHG emissions reduction
                                                                                                                                                                                                        2.50                                                                       0.05
                                                                           0.3

                                                                                                                                                                                       Millions tCO2e

                                                                                                                                                                                                                                                                                          tCO2e/boe
                                                                                                                                                                                                        2.00                                                                       0.04
                                                                           0.2                                                                                                                          1.50                                                                       0.03

                                                                                                                                                                                                        1.00                                                                       0.02
                                                                           0.1
                                                                                                                                                                                                        0.50                                                                       0.01

                                                                           0.0                                                                                                                            -                                                                        0
                                                                                     2017              2018                      2019                 2020                 2021                                   2017        2018         2019          2020            2021
                                                                                                                       SIF          LTIF                                                                  Direct (Scope 1)        Indirect (Scope 2)          Emission Intensity (Scope 1)

                                                                          Experienced operator with a high performance culture and focus on safe operations and realizing efficiencies
                         Horizontal (Hz) Wells Drilled source: Enverus; SIF: Serious Injury and Fatality Frequency (including potential), LTIF: Lost Time Injury Frequency                                                        23
                         Peers include CHK, CNQ, COP, CVX, DVN, EOG, OXY, WCP & XOM. Drilling & Completion data based on weighted average for Key Focus Areas and North Dakota (normalized based on 2020 meters drilled & completed)
Southeast Saskatchewan
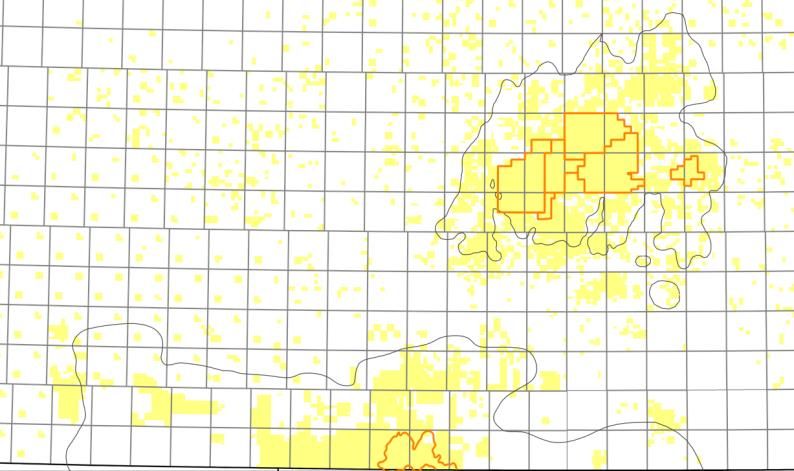
                             •      Primary development focused on Bakken, Torquay and conventional zones
CORPORATE PRESENTATION

                                                                                                                                                                                      SK
                             •      Secondary development benefitting from strong waterflood response in direct offset production
                                    with opportunity for further expansion

                             •      Successfully advancing and expanding the play through the implementation of new
                                    technology and step-out drilling

                             •      Piloting a carbon dioxide (CO2) flood for potential storage and / or
                                    enhanced oil recovery
‫׀‬
CRESCENT POINT

                                                                        Key Statistics (2022E)                                                                                Viewfield

                                   Expected Production                          Capital Budget                                  NOI

                                               33%                                     26%                                     35%

                                                                                                                                                      Flat Lake

                                                                       SE SK                      Remainder                           Pool Boundary         Waterflood Boundary       CPG Land

                         All figures are approximates unless otherwise specified. NOI: net operating income (as at US$80/bbl WTI).                                                               24
Kaybob Duvernay
                           • Low-risk, delineated play in the heart of condensate rich fairway
CORPORATE PRESENTATION

                           • Largest allocation in 2022 budget given competitive economics, strong initial
                             operational results and production growth outlook
                                                                                                                                                AB
                           • Enhancing returns through cost efficiencies and improved productivity

                           • Targeting economic reserves additions through unbooked locations and
                             undeveloped land position
‫׀‬
CRESCENT POINT

                                                                  Key Statistics (2022E)

                             Expected Production                         Capital Budget                                  NOI

                                        27%                                     27%                                     25%

                                                             Kaybob Duvernay                   Remainder
                                                                                                                                     CPG Land

                         All figures are approximates unless otherwise specified. NOI: net operating income (as at US$80/bbl WTI).                   25
Southwest Saskatchewan
                            •      Primary development focused on Lower / Upper Shaunavon and conventional zones
CORPORATE PRESENTATION

                            •      Secondary and tertiary development continues to expand through the advancement
                                   of water and polymer floods

                            •      Expanded economic boundaries through 2021 step-out drilling program

                            •      Continue to enhance environmental initiatives including further gas conservation
                                   and reduced freshwater usage
‫׀‬

                                                                                                                                                      Shaunavon
CRESCENT POINT

                                                                       Key Statistics (2022E)

                                   Expected Production                          Capital Budget                                  NOI

                                               20%                                     24%                                     22%    SK

                                                                                                                                           Pool boundary     Waterflood boundary

                                                                   SW SK                          Remainder                                Polymer flood boundary       CPG Land

                         All figures are approximates unless otherwise specified. NOI: net operating income (as at US$80/bbl WTI).                                                 26
North Dakota
                            •      High-impact wells with competitive full-cycle returns and repeatability
CORPORATE PRESENTATION

                            •      ~10 years of experience in the play with a track record of well cost reductions

                            •      Maximizing efficiencies through multi-well pad development and completions optimization

                            •      Enhancing water management to reduce costs and freshwater use
                                                                                                                                                       ND
‫׀‬
CRESCENT POINT

                                                                     Key Statistics (2022E)

                                 Expected Production                         Capital Budget                                  NOI
                                                                                                                                     Williams County

                                            15%                                     19%                                     14%

                                                                   North Dakota                  Remainder                                CPG Land

                         All figures are approximates unless otherwise specified. NOI: net operating income (as at US$80/bbl WTI).                          27
Board of Directors
                                              Barbara Munroe                                                                             Mike Jackson           1   2

                                              Chair of the Board                                                                         More than 30 years in corporate and investment banking holding
CORPORATE PRESENTATION

                                              More than 30 years of legal experience and industry diversification.                       several senior management roles with Scotiabank.
                                              Former EVP with WestJet Airlines.

                                              Craig Bryksa            3                                                                  Jennifer F. Koury              2       4

                                              President & Chief Executive Officer                                                        Extensive business leadership and governance background.
                                              Over 20 years of oil and gas experience, including over 15 years at                        Former executive with BHP Billiton and Enerplus.
                                              Crescent Point in several senior management roles.

                                              James E. Craddock                       2    4       5                                     Francois Langlois                  1       3   5

                                              Over 30 years of upstream exploration and production experience.                           More than 35 years of domestic and international oil and gas
                                              Former Chairman and CEO of Rosetta Resources.                                              experience. Former SVP, Exploration and Production with Suncor.
‫׀‬
CRESCENT POINT

                                              John P. Dielwart                3       5                                                  Myron M. Stadnyk                   3       4   5

                                              Over 40 years of experience in the oil and gas sector. Founding                            Over 35 years of business, industry, leadership and governance
                                              member of ARC Resources.                                                                   experience. Former President and CEO of ARC Resources.

                                              Ted Goldthorpe              1       2                                                      Mindy Wight            1   4

                                              Financial professional and Managing Partner in charge of the Global                        Tax and financial professional with over 15 years of experience. CFO
                                              Credit Business for BC Partners.                                                           and Treasurer of the Board for the Nch’kay Development Organization.

                                               1                                               2                         3                       4                                               5
                                         Audit                            CG & Nominating                          ES&S               HR & Compensation                                     Reserves
                                       Committee                            Committee                            Committee                Committee                                         Committee
                                 Financial risk management                        Board renewal              Stakeholder engagement       Corporate culture                             Operational excellence
                                         Cybersecurity                                    Diversity                  Environment       Compensation alignment
                                     Financial information                            Governance                 Safe operations        Employee engagement
                                                                                                                                                                                                                 28
                         CG: Corporate Governance. ES&S: Environmental, Safety & Sustainability.
Forward Looking Information
                         This presentation contains “forward-looking statements” within the meaning of applicable securities legislation, such as section 27A of the Securities Act of 1933 and section 21E of the Securities Exchange Act of 1934, including estimates of future production, cash flows and reserves,
                         business plans for drilling and exploration, the estimated amounts and timing of capital expenditures, the assumptions upon which estimates are based and related sensitivity analyses, and other expectations, beliefs, plans, objectives, assumptions or statements about future events or
                         performance (often, but not always, using words or phrases such as “expects” or “does not expect”, “is expected” or “2022E”) and includes: 2022 guidance and excess cash flow expectations, including annual average production of 133,000 – 137,000 mboe/d, percentage of production that
                         are liquids, development capital expenditures of $875-$900 million, excess cash flow of $1.2 – $1.4 billion (at US$80 – US$100 WTI); asset characteristics including its low risk drilling inventory, long life, low decline assets, strong market access and scalability; 2022E operating netback
                         (and peer comparison), 2022E royalty rate (and comparison), 2022E oil and condensate production breakdown by stream; 2022E corporate decline rate (and comparison); CPG differentiated asset base generating significant excess cash flow; on-track to achieve near-term net debt targe of
                         $1.3B during Q3 2022; disciplined 2022 capital expenditures budget and production by area; cost inflation assumption of up to 15%; unchanged annual average production guidance unchanged in light of cost inflation; efforts to mitigate cost inflation; 2022 cash flow sensitivity and
CORPORATE PRESENTATION

                         allocation; ~$950MM - $1.1B of available funds in 2022 (at US$80 – US$100 WTI) after dividends and planned share repurchases for further debt reduction, return of capital to shareholders, and other initiatives; expected dividend payments; adjusted funds flow at $US80 -$US100 WTI;
                         ~$80MM of 2022 other corporate items; ~$140MM in dividends in 2022; up to $150MM in H1/22 planned share repurchases; 2022 budget maximizes excess cash flow and generates strong full-cycle returns; significant tax pools enhancing excess cash flow; 2023E cash taxes of peers and
                         2023E CPG cash taxes; cumulative excess cash flow and net debt / funds flow at US$60, $US70 and $US80 WTI; expected tax as % of funds flow in the next five years; expected annual production and development capital expenditures over the next five years;year end net debt / funds
                         flow between 2022-2026 at US$60, $US70 and $US80 WTI; generating attractive returns for shareholders by returning capital, including a dividend, and debt–adjusted per share growth; excess cash flow priorities; expect to release updated return of capital framework as CPG moves closer
                         to attaining its near-term net debt target; ~30% of excess cash flow to be returned to shareholders during H1 2022; this level continues to increase as the Company moves closer to its near-term net debt target; expected total amounts of capital returned to shareholders (as balance sheet
                         improves) in Q1 and Q2 (and the ways in which such capital is returned); scalability in the Kaybob Duvernay, including significant opportunity to identify new drilling locations given large undeveloped land position; Kaybob Duvernay excess cash flow generation in 2022; Kaybob Duvernay
                         2022E NOI less capex (US$80 WTI); Kaybob Duvernay 2022E production growth; expected supply and demand for, and imports of, condensate in the WCSB; percentage of 2022E Kaybob Duvernay liquids production that is condensate; strategy and focus and constituent elements;
                         environmental stewardship funding of 3-5% of annual maintenance capital budget; 30% reduction in inactive well inventory by 2031, excluding impact of dispositions; details on new emissions target and release of sustainability report in early H2/22; 350 planned well retirements in 2022;
                         progressing on standards for freshwater use in operations; Crescent Point’s annual guidance for 2022, including, but not limited to capitalized G&A of $40 million, reclamation activities of $20 million, capital lease payments of $20 million, annual operating expenses of $13.75 - $ 14.25/boe,
                         and royalties of 13.5%-14.0%; hedging strategy and its benefits; prioritizing net debt reduction with the majority of near-term excess cash flow; significant excess cash flow generation and liquidity in place for upcoming senior note maturities; excess cash flow available for funding senior
                         note maturities at a range of WTI prices; Southeast Saskatchewan expectations including: opportunities for further waterflood expansion; advancing and expanding the play, benefits of a CO2 flood and 2022E key statistics including, expected production, capital budget and NOI; Kaybob
                         Duvernay expectations including: 2022 budget allocation, given competitive economics, strong initial operational results and production growth outlook, enhanced returns through cost efficiencies and improved productivity, targeting economic reserves additions through unbooked locations
                         and undeveloped land positions, and 2022E key statistics including, expected production, capital budget and NOI; Southwest Saskatchewan expectations including: decline mitigation opportunities, enhanced environmental initiatives, and 2022E key statistics including, expected
                         production, capital budget and NOI; and North Dakota expectations (including completive full-cycle returns and repeatability, enhancing water management to reduce costs and freshwater use; and 2022E key statistics including, expected production, capital budget and NOI.
                         There are numerous uncertainties inherent in estimating crude oil, natural gas and NGL reserves and the future cash flow attributed to such reserves. The reserves and associated cash flows therefrom are based upon a number of variable factors and assumptions, such as historical
                         production from the properties, production rates, ultimate reserve recovery, timing and amount of capital expenditures, marketability of oil and natural gas, royalty rates, the assumed effects of regulation by governmental agencies and future operating expenses, all of which may vary
                         materially. Actual reserve values may be greater than or less than the estimates provided herein. Also, estimates of reserves and future net revenue for individual properties may not reflect the same confidence level as estimates and future net revenue for all properties due to the effect of
                         aggregation. Information relating to “reserves” is deemed to be forward-looking information, as it involves the implied assessment, based on certain estimates and assumptions, that the reserves described exist in the quantities predicted or estimated, and that the reserves described can be
                         profitably produced in the future. All required reserve information for the Corporation is contained in its Annual Information Form for the year ended December 31, 2021, which is accessible at www.sedar.com. With respect to disclosure contained herein regarding resources other than
‫׀‬

                         reserves, there is uncertainty that it will be commercially viable to produce any portion of the resources and there is significant uncertainty regarding the ultimate recoverability of such resources.
                         All forward-looking statements are based on Crescent Point’s beliefs and assumptions based on information available at the time the assumption was made. Crescent Point believes that the expectations reflected in these forward-looking statements are reasonable but no assurance can be
CRESCENT POINT

                         given that these expectations will prove to be correct and such forward-looking statements included in this report should not be unduly relied upon. By their nature, such forward-looking statements are subject to a number of risks, uncertainties and assumptions, which could cause actual
                         results or other expectations to differ materially from those anticipated, expressed or implied by such statements, including those material risks discussed in the Company’s Annual Information Form for the year ended December 31, 2021 under "Risk Factor s“ and our Management’s
                         Discussion and Analysis for the year ended December 31, 2021, under the headings "Risk Factors" and "Forward-Looking Information“ and for the three months ended March 31, 2022, under the heading “Forward-Looking Information”. The material assumptions are disclosed in the
                         Management’s Discussion and Analysis for the year ended December 31, 2021, under the headings "Capital Expenditures", "Liquidity and Capital Resources", "Critical Accounting Estimates", "Risk Factors", "Changes in Accounting Policies" and "Guidance“ and in the Management’s
                         Discussion and Analysis for the three months ended March 31, 2022, under the headings “Overview”, “Commodity Derivatives”, “Liquidity and Capital Resources”, “Guidance”, “Royalties” and “Operating Expenses”. In addition, risk factors include: financial risk of marketing reserves at an
                         acceptable price given market conditions; volatility in market prices for oil and natural gas, decisions or actions of OPEC and non-OPEC countries in respect of supplies of oil and gas; delays in business operations or delivery of services due to pipeline restrictions, rail blockades,
                         outbreaks, blowouts and business closures and social distancing measures mandated by public health authorities in response to COVID-19; uncertainty regarding the benefits and costs of acquisitions and dispositions; the risk of carrying out operations with minimal environmental impact;
                         industry conditions including changes in laws and regulations including the adoption of new environmental laws and regulations and changes in how they are interpreted and enforced; uncertainties associated with estimating oil and natural gas reserves; r isks and uncertainties related to oil
                         and gas interests and operations on Indigenous lands; economic risk of finding and producing reserves at a reasonable cost; uncertainties associated with partner plans and approvals; operational matters related to non-operated properties; increased competition for, among other things,
                         capital, acquisitions of reserves and undeveloped lands; competition for and availability of qualified personnel or management; incorrect assessments of the value and likelihood of acquisitions and dispositions, and exploration and development programs; unexpected geological, technical,
                         drilling, construction, processing and transportation problems; the impact of severe weather events; availability of insurance; fluctuations in foreign exchange and interest rates; stock market volatility; general economic, market and business conditions, including uncertainty in the demand
                         for oil and gas and economic activity in general as a result of the COVID-19 pandemic; uncertainties associated with regulatory approvals; geopolitical conflict, including the Russian invasion of Ukraine; uncertainty of government policy changes; the impact of the implementation of the
                         Canada-United States Mexico Agreement; uncertainties associated with credit facilities and counterparty credit risk; cybersecurity risks; changes in income tax laws, tax laws, crown royalty rates and incentive programs relating to the oil and gas industry; the wide-ranging impacts of the
                         COVID-19 pandemic, including on demand, health and supply chain; and other factors, many of which are outside the control of the Company. The impact of any one risk, uncertainty or factor on a particular forward-looking statement is not determinable with certainty as these are
                         interdependent and Crescent Point’s future course of action depends on management’s assessment of all information available at the relevant time.
                         In addition, with respect to forward-looking information contained in this presentation, assumptions have been made regarding, among other things: future crude oil and natural gas prices; future interests rates and currency exchange rates; future cost escalation under different pricing
                         scenarios; the corporation's future production levels; the applicability of technologies for recovery and production of the corporation's reserves and improvements therein; the recoverability of the corporation's reserves; Crescent Point’s ability to market its production at acceptable prices;
                         future capital expenditures; future cash flows from production meeting the expectations stated in this presentation; future sources of funding for the corporation's capital program; the corporation's future debt levels; geological and engineering estimates in respect of the corporation's
                         reserves; the geography of the areas in which the corporation is conducting exploration and development activities; the impact of competition on the corporation; the corporation's ability to obtain financing on acceptable terms.
                         These assumptions, risks and uncertainties could cause actual results or other expectations to differ materially from those anticipated, expressed or implied by such statements. The impact of any one assumption, risk, uncertainty or factor on a particular forward-looking statement is not
                         determinable with certainty as these are interdependent. Except as required by law, Crescent Point assumes no obligation to update forward-looking statements should circumstances or management's estimates or opinions change. Certain information contained herein has been prepared
                         by third-party sources. Included in this presentation are Crescent Point’s 2022 guidance in respect of capital expenditures and average annual production, 5-year outlook, and 2022 expectations, which are based on various assumptions as to production levels, commodity prices and other
                         assumptions and are provided for illustration only and are based on budgets and forecasts that have not been finalized and are subject to a variety of contingencies including prior years' results. To the extent such estimates constitute a “financial outlook” or “future oriented financial
                         information” in this presentation, as defined by applicable securities legislation, such information has been approved by management of Crescent Point. Such financial outlook or future oriented financial information is provided for the purpose of providing information about management’s
                         current expectations and plans relating to the future. Readers are cautioned that reliance on such information may not be appropriate for other purposes.

                                                                                                                                                                                                                                                                                                                         29
Disclosure Committee
                         NOTE TO READER REGARDING DISCLOSURE
CORPORATE PRESENTATION

                         In addition to obtaining all necessary Board approvals, the Company’s long-established Disclosure Committee’s mandate is to review and confirm the accuracy of the data and
                         information contained in the documents, including this presentation, Crescent Point uses to communicate to the public. This review and confirmation process is formally completed prior to
                         any such disclosure being released. This Committee is comprised of senior representatives (including officers) from each of the following departments: accounting and finance;
                         engineering and operations (including drilling and completions, environment, health and safety and regulatory); exploration and geosciences; investor relations; land; legal; ESG;
                         marketing and reserves.

                         This presentation contains “forward-looking statements” within the meaning of applicable securities legislation, such as section 27A of the Securities Act of 1933 and section 21E of the
                         Securities Exchange Act of 1934, including estimates of future production, cash flows and reserves, business plans for drilling and exploration, the estimated amounts and timing of
                         capital expenditures, the assumptions upon which estimates are based and related sensitivity analyses, and other expectations, beliefs, plans, objectives, assumptions or statements
                         about future events or performance. Please see the “Forward-Looking Statements” section of this presentation for additional details regarding such statements.
‫׀‬
CRESCENT POINT

                                                                                                                                                                                                                      30
Definitions / Specified Financial Measures
                         Throughout this presentation the Company uses the terms “operating netback”, “adjusted funds flow”, “excess cash flow”,
                         “enterprise value”, “net debt” and “net debt / funds flow” (equivalent to net debt to adjusted funds flow from operations), which
CORPORATE PRESENTATION

                         are specified financial measures under National Instrument 52-112 Non-GAAP and Other Financial Measures Disclosure.
                         Specified financial measures do not have any standardized meaning prescribed by IFRS and, there, may not be comparable
                         with the calculation of similar measures presented by other entities.
                         Operating netback is a non-GAAP ratio and is calculated as total operating netback divided by total production. Operating
                         netback is a common metric used in the oil and gas industry and is used to measure operating results on a per boe basis.
                         The most directly comparable financial measure for excess cash flow and adjusted funds flow disclosed in the Company’s
                         financial statements is cash flow from operating activities, which, for the quarter ended March 31, 2022, was $426.1 million.
                         The most directly comparable financial measure for net debt disclosed in the Company’s financial statements is long-term debt,
‫׀‬

                         which for the quarter ended March 31, 2022, was $1.8 billion. For the quarter ended March 31, 2022, total operating netback,
CRESCENT POINT

                         operating netback, excess cash flow, adjusted funds flow and net debt were $745.0 million, $62.33/boe, $289.3 million, $534.0
                         million and $1.8 billion, respectively.
                         For an explanation of the composition of operating netback, adjusted funds flow, excess cash flow, net debt and net debt /
                         funds flow, how they provide useful information to an investor and quantitative reconciliations to the applicable GAAP
                         measures, see the Company’s MD&A available online for the three months ended March 31, 2022 at www.sedar.com, or
                         EDGAR at www.sec.gov and on our website at www.crescentpointenergy.com. The section of the MD&A entitled “Specified
                         Financial Measures” is incorporated herein by reference. There are no significant differences in the calculations between
                         historical and forward-looking specified financial measures.
                         Management believes the presentation of the specified financial measures above provide useful information to investors and
                         shareholders as the measures provide increased transparency and the ability to better analyze performance against prior
                         periods on a comparable basis. This information should not be considered in isolation or as a substitute for measures prepare d
                         in accordance with IFRS.
                                                                                                                                                             31
Reserves and Drilling Data
                         Where applicable, a barrels of oil equivalent ("boe") conversion rate of six thousand cubic feet of natural gas to one barrel of oil equivalent (6Mcf:1bbl) has been used based on an energy
                         equivalent conversion method primarily applicable at the burner tip. Given that the value ratio based on the current price of crude oil as compared to natural gas is significantly different than
CORPORATE PRESENTATION

                         the energy equivalency of the 6:1 conversion ratio, utilizing the 6:1 conversion ratio may be misleading as an indication of value.

                         This presentation contains metrics commonly used in the oil and natural gas industry, including “operating netback”, “FD&A” costs, “F&D costs”, “payout”, “recycle ratio”, and "decline rate".
                         These terms do not have a standardized meaning and may not be comparable to similar measures presented by other companies and, therefore, should not be used to make such
                         comparisons. Readers are cautioned as to the reliability of oil and gas metrics used in this presentation. Management uses these oil and gas metrics for its own performance measurements
                         and to provide investors with measures to compare the Company’s performance over time; however, such measures are not reliable indicators of the Company’s future performance, which
                         may not compare to the Company’s performance in previous periods, and therefore should not be unduly relied upon.

                         Finding and development (F&D) costs are calculated by dividing the development capital expenditures by the applicable reserves additions. F&D costs can include or exclude changes to
                         future development capital costs. Finding, development and acquisition costs (FD&A) are equivalent to F&D costs plus the costs of acquiring and disposing particular assets.

                         Operating netback is calculated on a per boe basis as oil and gas sales, less royalties, operating and transportation expenses. Netback is used by management to measure operating results
‫׀‬

                         on a per boe basis to better analyze performance against prior periods on a comparable basis
CRESCENT POINT

                         Recycle Ratio is calculated as operating netback divided by FD&A. Management uses recycle ratio for its own performance measurements and to provide shareholders with measures to
                         compare the Company’s performance over time.

                         Payout is the point at which all costs associated with leasing, exploring, drilling and operating have been recovered from the production of a well. It is an indication of profitability.

                         Decline rate is the reduction in the rate of production from one period to the next. This rate is usually expressed on an annual basis. Management uses decline rate to assess future
                         productivity of the Company’s assets.

                         Certain terms used herein but not defined are defined in National Instrument 51-101 – Standards of Disclosure for Oil and Gas Activities (“NI 51-101”), CSA Staff Notice 51-324 – Revised
                         Glossary to NI 51-101 Standards of Disclosure for Oil and Gas Activities (“CSA Staff Notice 51-324”) and/or the COGE Handbook and, unless the context otherwise requires, shall have the
                         same meanings herein as in NI 51-101, CSA Staff Notice 51-324 and the COGE Handbook, as the case may be.

                         Net asset value (NAV) is a snapshot in time as at year-end, and is based on the Company’s reserves evaluated using the independent evaluators forecast for future prices, costs and foreign
                         exchange rates. The Company’s NAV is calculated on a before tax basis and is the sum of the present value of proved developed producing reserves based on three evaluators' average
                         (McDaniel, GLJ Ltd. and Sproule Associates Ltd.) December 31, 2021 escalated price forecast, the fair value for the Company’s oil and gas hedges based on such December 31, 2021
                         escalated price forecast, and less outstanding net debt. The NAV per share is calculated on a fully diluted basis.

                                                                                                                                                                                                                              32
Reserves and Drilling Data
                         At the time of the acquisition, the Company retained McDaniel to evaluate the reserves associated with, and prepare a reserves report (the “McDaniel Report”) on the Kaybob
                         Duvernay assets (the “Assets”). The McDaniel report is dated, and prepared as of, February 11, 2021 and has an effective date of December 31, 2020. All other reserves data
CORPORATE PRESENTATION

                         contained in this presentation, and effective for year ended 2021, is contained in the Corporation’s AIF for the year ended, December 31, 2021, available on SEDAR (the “Reserves
                         Report”). McDaniel prepared the McDaniel Report in accordance with the standards contained in NI 51-101 and the COGE Handbook that were in effect at the relevant time. There
                         are numerous uncertainties inherent in estimating quantities of crude oil, natural gas and NGL reserves and the future cash f lows attributed to such reserves. The reserve and
                         associated cash flow information set forth above are estimates only. In general, estimates of economically recoverable crude oil, natural gas and NGL reserves and the future net
                         cash flows therefrom are based upon a number of variable factors and assumptions, such as historical production from the properties, production rates, ultimate reserve recovery,
                         timing and amount of capital expenditures, marketability of oil and natural gas, royalty rates, the assumed effects of regulation by governmental agencies and future operating
                         costs, all of which may vary materially. For these reasons, estimates of the economically recoverable crude oil, NGL and natural gas reserves attributable to any particular group of
                         properties, classification of such reserves based on risk of recovery and estimates of future net revenues associated with reserves prepared by different engineers, or by the same
                         engineers at different times, may vary. The Company’s actual production, revenues, taxes and development and operating expenditures with respect to its reserves will vary from
                         estimates thereof and such variations could be material.

                         The categories of reserves associated with the booked type well are proved and probable. The type well was audited by independent reserves evaluator, McDaniel, effective
‫׀‬

                         December 31, 2021. A limited amount of production data is available to make comparisons of production results to the booked type well and results may not be indicative of longer-
CRESCENT POINT

                         term performance. Kaybob Duvernay production was ~30,000 boe/d in 2021 (57% condensate, 8% NGL and 35% shale gas).

                         This presentation discloses approximately 200 potential net drilling locations of which 90 are booked as proved plus probable. Proved plus probable locations consist of proposed
                         drilling locations identified in the Reserves Report that have proved and/or probable reserves, as applicable, attributed to them. The Company’s ability to drill and develop these
                         locations and the drilling locations on which the Company actually drills wells depends on a number of uncertainties and factors, including, but not limited to, the availability of
                         capital, equipment and personnel, oil and natural gas prices, costs, inclement weather, seasonal restrictions, drilling results, additional geological, geophysical and reservoir
                         information that is obtained, production rate recovery, gathering system and transportation constraints, the net price received for commodities produced, regulatory approvals and
                         regulatory changes. As a result of these uncertainties, there can be no assurance that the potential future drilling locations that the Company has identified will ever be drilled and,
                         if drilled, that such locations will result in additional crude oil, natural gas or NGLs produced. As such, the Company’s actual drilling activities may differ materially from those
                         presently identified, which could adversely affect the company’s business. The estimates for reserves for individual properties may not reflect the same confidence level as
                         estimates of reserves for all properties due to the effects of aggregation. The recovery and reserve estimates of the Company’s reserves provided herein are estimates only and
                         there is no guarantee that the estimated reserves will be recovered.

                         NI 51-101 includes condensate within the natural gas liquids (NGLs) product type. The Company has disclosed condensate as combined with crude oil and separately from other
                         natural gas liquids in this presentation since the price of condensate as compared to other natural gas liquids is currently significantly higher and the Company believes that this
                         crude oil and condensate presentation provides a more accurate description of its operations and results therefrom.

                                                                                                                                                                                                                    33
Reserves and Drilling Data
                         Notice to US Readers
CORPORATE PRESENTATION

                         The oil and natural gas reserves contained in this presentation have generally been prepared in accordance with Canadian disclosure standards, which are not comparable in all
                         respects of United States or other foreign disclosure standards. For example, the United States Securities and Exchange Commission (the "SEC") generally permits oil and gas
                         issuers, in their filings with the SEC, to disclose only proved reserves (as defined in SEC rules),but permits the optional disclosure of "probable reserves" and "possible reserves"
                         (each as defined in SEC rules). Canadian securities laws require oil and gas issuers, in their filings with Canadian securities regulators, to disclose not only proved reserves (which
                         are defined differently from the SEC rules) but also probable reserves and permits optional disclosure of "possible reserves", each as defined in NI 51-101. Accordingly, "proved
                         reserves", "probable reserves" and "possible reserves" disclosed in this presentation may not be comparable to US standards, and in this presentation, Crescent Point has
                         disclosed reserves designated as "proved plus probable reserves". Probable reserves are higher-risk and are generally believed to be less likely to be accurately estimated or
                         recovered than proved reserves. "Possible reserves" are higher risk than "probable reserves" and are generally believed to be less likely to be accurately estimated or recovered
                         than "probable reserves". In addition, under Canadian disclosure requirements and industry practice, reserves and production are reported using gross volumes, which are volumes
                         prior to deduction of royalties and similar payments. The SEC rules require reserves and production to be presented using net volumes, after deduction of applicable royalties and
                         similar payments. Moreover, Crescent Point has determined and disclosed estimated future net revenue from its reserves using forecast prices and costs, whereas the SEC rules
                         require that reserves be estimated using a 12-month average price, calculated as the arithmetic average of the first-day-of-the-month price for each month within the 12-month
                         period prior to the end of the reporting period. Consequently, Crescent Point's reserve estimates and production volumes in this presentation may not be comparable to those
‫׀‬

                         made by companies using United States reporting and disclosure standards. Further, the SEC rules are based on unescalated costs and forecasts. All amounts in the presentation
                         are stated in Canadian dollars unless otherwise specified.
CRESCENT POINT

                                                                                                                                                                                                                   34
CORPORATE PRESENTATION

                         Crescent Point Energy Corp.
                         Suite 2000, 585 8th Ave SW
                         Calgary, AB
                         T2P 1G1

                         Investor Relations
‫׀‬

                         (403) 767-6930
CRESCENT POINT

                         (855) 767-6923
                         investor@crescentpointenergy.com

                         Other Contacts & Website
                         media@crescentpointenergy.com
                         sustainability@crescentpointenergy.com
                         www.crescentpointenergy.com

                                                                  35
You can also read