The Pantry, Inc. Concerned Pantry Shareholders February 2014 - Enhancing Stockholder Value at The Pantry - SEC.gov
←
→
Page content transcription
If your browser does not render page correctly, please read the page content below
The Pantry, Inc.

Concerned Pantry Shareholders
February 2014

Enhancing Stockholder Value at The Pantry

                                1
Disclaimer
This presentation is for discussion and general informational purposes only. It does not have regard to the specific
investment objective, financial situation, suitability, or the particular need of any specific person who may receive this
presentation, and should not be taken as advice on the merits of any investment decision. The views expressed herein
represent the opinions of JCP Investment Management, LLC (“JCP”) and Lone Star Value Management, LLC (“Lone
Star Value”), and are based on publicly available information with respect to The Pantry, Inc. (the “Issuer”). Certain
financial information and data used herein have been derived or obtained from public filings, including filings made by
the Issuer with the Securities and Exchange Commission (“SEC”), and other sources.
JCP and Lone Star Value have not sought or obtained consent from any third party to use any statements or information
indicated herein as having been obtained or derived from statements made or published by third parties. Any such
statements or information should not be viewed as indicating the support of such third party for the views expressed
herein. No warranty is made that data or information, whether derived or obtained from filings made with the SEC or
from any third party, are accurate.
Except for the historical information contained herein, the matters addressed in this presentation are forward-looking
                                                                                                       forward
statements that involve certain risks and uncertainties. You should be aware that actual results may differ materially
from those contained in the forward-looking
                                      looking statements.
JCP and Lone Star Value shall not be responsible or have any liability for any misinformation contained in any SEC
filing, any third party report or this presentation. There is no assurance or guarantee with respect to the prices at which
any securities of the Issuer will trade, and such securities may not trade at prices that may be implied herein. The
estimates, projections and pro forma information set forth herein are based on assumptions which JCP and Lone Star
Value believe to be reasonable, but there can be no assurance or guarantee that actual results or performance of the
Issuer will not differ, and such differences may be material. This presentation does not recommend the purchase or sale
of any security.
JCP and Lone Star Value reserve the right to change any of their opinions expressed herein at any time as they deem
appropriate. JCP and Lone Star Value disclaim any obligation to update the information contained herein.
Under no circumstances is this presentation to be used or considered as an offer to sell or a solicitation of an offer to
buy any security.

                                                              2
Table of Contents
I. Why We are Invested in The Pantry
II. History of Poor Performance and Undervaluation
III. Concerned Pantry Shareholders (CPS) Has a Better
Plan
IV. Our Nominees Are More Qualified
Appendix
Company / Industry Overview
3Why We are Invested in The Pantry
• We began researching The Pantry in April 2012 and our research indicated that an opportunity existed to create
significant value for Pantry shareholders
• Change is necessary at the Company given its terrible performance over the past several years across almost any
measure:
– Stock price performance has been disappointing : The Total Shareholder Return over the last -3, -5
and -10 years has been negative,, The Pantry underperformed their Peer’s and underperformed the broader
equity markets
– Operating performance has been poor: Adjusted EBITDA has declined from +$280 million in FY 2009 to
$202 million in FY 2013
– Capital allocation has been very poor: The Company has spent more than $900 million in capital
expenditures and more than $900 million in acquisitions in the last 10 years and EBITDA has barely
increased
– Management Turnover: 4 CEOs in 5 years. In the last 2 weeks, the Senior Vice President of Operations
resigned
– Highly Leveraged: The Company continues to struggle under more than $900 million in debt and capital
leases and does not have a handle on its current covenant structure
– Corporate Governance Issues: The average Board tenure is +7 years with some members of the Board
having served for 9 to 11 years, current Directors hold less than 1% of the stock, have been net sellers of
the stock since 2010 and the Board has received more than $8.5 million in compensation over this period of
underperformance
4Why We are Invested in The Pantry
Change is urgently needed at The Pantry.
After 10 years the Board has repeatedly failed to
produce shareholder value after multiple attempts.
We have nominated directors who are highly-
highly
qualified and offer a better plan for the future of The
Pantry.
There is a substantial opportunity to create value for
the benefit of all Pantry shareholders in food service,
real estate, and corporate governance.
5Our Nominees Can Create Positive Change
• Our Nominees have corporate governance experience,
experience capital allocation experience, operating
experience, and will explore all options to unlock value.
value We believe these are all necessary to
execute on a new plan for The Pantry.
– Todd Diener - Former executive officer of Brinker International, Inc. (“Brinker”). At Brinker he most recently
served as the President of Chili’s Grill & Bar (“Chili’s”) and On the Border restaurants with more than 1,500
stores and over $2.0 billion in revenue. Mr. Diener’s over 28 years of experience in a senior capacity at
Chili’s provide him with deep strategic and operational expertise in exploring ways to improve financial
performance and maximize returns of a public retail company.
– James Pappas - Chairman of the Board of Morgan’s Foods (Ticker: MRFD), a public company with more
than 70 KFC restaurants, Taco Bell restaurants and Pizza Hut Express restaurants. Previously, Mr. Pappas
was with the Investment Banking / Leveraged Finance Division of Goldman Sachs Group, Inc. (NYSE:GS),
and prior to that with Banc of America Securities. Mr. Pappas is the Managing Member of JCP Investment
Management, LLC.
– Josh Schechter - Director of Aderans Co., Ltd., a multi-national
multi company engaged in hair-related business,
and Executive Chairman of Aderans America Holdings, Inc. Mr. Schechter is a former Managing Director of
Steel Partners Ltd., a privately owned investment partnership and co-President of Steel Partners Japan
Asset Management, LP, a private company offering investment services. Mr. Schechter served on the
Board of Directors of WHX Corporation (n/k/a Handy & Harman Ltd.) (NASDAQ: HNH), a diversified
manufacturer of engineered niche industrial products with leading market positions in many of the markets it
serves and the Board of Directors of Puroflow,
Puroflow Inc. (n/k/a Argan, Inc.) (NYSE:AGX), a provider of a full
range of power and special filtration products for aerospace and other industrial uses.
6Why We are Invested in The Pantry
The current Board is composed of Directors who
have continuously failed to create value for
shareholders over the past 10 years.
Ed Holman, Thomas Murnane,
Murnane and Robert Bernstock
have been on the Board for 9 - 12 years and are
responsible for overseeing terrible performance and
4 CEOs
7History of Poor Performance Compels
Change on the Board
810 Years of Poor Performance
• This performance demonstrates in our view that the Board of Directors’
interests have not been aligned with shareholders – our nominees are
committed to increasing shareholder value
Share Price Performance (1)
1-Year 3-Year 5-Year 10-Year
S&P 500 19% 36% 116% 57%
Russell 3000 21% 38% 127% 66%
MSCI ACWI: Food & Staples Retailing 9% 28% 69% 62%
2012 The Pantry Proxy Group(2) 16% 96% 299% 282%
2013 The Pantry Proxy Group(3) 22% 88% 226% 163%
ISS Group (4) 21% 61% 583% 244%
Most Similar Competitors (5) 40% 193% 396% 438%
The Pantry, Inc (PTRY) 9% -12% -20% -36%
Underperformance vs. S&P500 -10% -48% -136% -93%
Underperformance vs. Most Similar Competitors -31% -205% -416% -474%
Source: Bloomberg
1. Performance as of 2/11/14 Dividends not reinvested.
2. 2012 The Pantry Proxy Group consists of companies used in the Company's proxy statement
3. 2013 The Pantry Proxy Group consists of companies used in the Company's proxy statement
4. ISS Group includes ABG, DDS, ODP, SAH, TA, BKS, GME, A/DE, U/FI, GPI.
5. Includes ATD/B, CASY, SUSS. 10 Year share price performance excludes SUSS as information is not available for that time period
p
910 Years of Poor Performance (cont.)
• The Pantry has underperformed its direct competitors by a wide margin
• Our nominees offer a better plan to create shareholder value
10 Year Share Price Performance %
PTRY SUSS ATD/B CASY
800
700
600
500
400
300
200
100
-
1010 Years of Poor Performance (cont.)
• The Pantry’s most similar competitors which are public companies include Casey’s,
Susser and Alimentation Couche-Tard
Tard
• The Pantry’s long-term stock price underperformance has significantly lagged its
peers and the relevant stock indices
• We believe there is still significant opportunity to release value at the Pantry
and our nominees would be the catalyst to do so
1-Year 3-Year 5-Year 10-Year
Alimentation Couche-Tard, Inc (ATD/B) 58% 225% 569% 584%
Casey's General Stores, Inc (CASY) 23% 57% 218% 292%
Susser Holdings Corporation (SUSS) 39% 297% 400% N/A
M ost Similar Competitors 40% 193% 396% 438%
S&P 500 19% 36% 116% 57%
The Pantry, Inc (PTRY) 9% -12% -20% -36%
/ote: CST and MUSA do not have sufficient long-term data and does not include dividends reinvested.
Source: Bloomberg as of February 11, 2014.
1110 Years of Poor Performance (cont.)
• The Pantry’s stock price has declined more than 30% cumulatively in 10 years. During this time,
The Company has generated a total of $1.5 billion in cash flow from operations and spent
approximately $900 million in capital expenditures
• The Pantry has produced very poor returns on invested capital
• Our nominees are focused and highly qualified to help reposition The Pantry for future
growth
12Historically Poor Capital Allocation
• Over the last 10 years the Company has spent more than $900 million in total capital
expenditures and failed to create any shareholder value
• Additionally, the Company has generated $1.5 billion in cash flow from operations which has
also been reinvested into The Company and yet the stock price has declined over 10 years
creating no shareholder value. EBITDA has declined significantly in the last 5 years
• The majority of the current Board approved these poor performing investments. This
same group should not be responsible for another large investment program
End of Period Total Capital Cash Flow from
Year Stores Expenditures Operations EBITDA
2004 1,361 51,916 116,972 173,200
2005 1,400 73,387 133,581 215,700
2006 1,493 96,826 154,263 279,000
2007 1,644 146,390 140,636 215,500
2008 1,653 109,496 157,504 250,400
2009 1,673 122,656 169,436 281,300
2010 1,638 101,127 154,825 237,600
2011 1,649 100,726 178,710 231,700
2012 1,578 69,261 144,017 210,100
2013 1,548 88,069 128,111 202,400
Totals 959,854 1,478,055
/ote: Per SEC filings.
13Historically Poor Capital Allocation (cont.)
The Pantry has spent a total of +$900 million on Acquisition
Related capital expenditures in the last 10 years buying +600
stores which has not created any shareholder value
Year Total Capital Expenditures Acquisition Related Total Capex + Acquisitions EBITDA
2004 51,916 185,607 237,523 173,200
2005 73,387 103,068 176,455 215,700
2006 96,826 126,791 223,617 279,000
2007 146,390 395,809 542,199 215,500
2008 109,496 14,696 124,192 250,400
2009 122,656 48,768 171,424 281,300
2010 101,127 10 101,137 237,600
2011 100,726 47,564 148,290 231,700
2012 69,261 0 69,261 210,100
2013 88,069 1,723 89,792 202,400
Total 959,854 924,036 1,883,890
Historical investments have failed to produce EBITDA growth
Our Nominees have the right capital allocation experience
14Historically Poor Capital Allocation (cont.)
• For FY 2014 the Company has forecasted $110 million in capital expenditures. We don’t believe
this Board has proven it is capable of overseeing such a large capital outlay
– The Company has not clearly stated its expected return on these investments
• The Pantry spent more than $10 million in FY 2013 building new stores. Shareholders have not
been given proper disclosure of the expected return on those capital expenditures and have
seen no evidence of positive returns since EBITDA declined during FY 2013
• We have yet to see any tangible evidence that the “New Store Models” are making a difference
to EBITDA. Growing 3 stores a year on 1,500 stores is not an advantageous use of cash
considering the large debt load and significant store base
• The Board has authorized these expenditures without apparently understanding the ramifications
of 1) failing to generate a return on the investment and 2) not paying down the debt which
management is having trouble managing
• Our nominees will focus on disciplined capital allocation and generating positive returns
• Do you want the same Board to oversee $110 million in capital expenditures for FY 2014?
15Poor Performance = Poor Shareholder Return
• The Pantry trades at a significant discount given its poor capital allocation and poor operating
performance over the last 10 years
• Without significant change in The Pantry’s capital allocation strategy, the discount to its peers and
the broader market is unlikely to change
• We believe our Board nominees can work constructively with the Board and management in
order to improve operating performance and returns on capital
FY 2014E EV/FY 2014E
Market Value EV EBITDA EBITDA
Casey’s (CASY) 2,594 3,294 389 8.5x
Alimentation Couche-Tard (ATD/B) 14,387 16,770 1,622 10.3x
Susser Holdings (SUSS) 1,275 1,615 166 9.8x
Average - - - 9.5x
Median - - - 9.8x
The Pantry (PTRY) 323 1,235 215 5.7x
/ote: Per Bloomberg as of February 11th, 2014.
16Fuel Declines Are Concerning
• Fuel volumes have declined over the last five years
• We believe the Board is neglecting these declines and not paying adequate attention to
competitors such as Sheetz and QuickTrip as they appear to be taking market share
• The Pantry has underperformed its peers
Same Store Fuel Gallons % Change
Year PTRY SUSS CASY Couche-Tard
2005 4.7% 5.4% 1.9% 6.3%
2006 3.1% 4.8% 4.4% 6.0%
2007 1.0% 5.0% 1.4% 2.9%
2008 -4.4% 2.6% -2.0% -0.2%
2009 -3.3% 2.4% 1.0% -6.4%
2010 -4.9% 2.5% -0.1% 1.0%
2011 -7.4% 4.9% 1.6% 0.7%
2012 -3.1% 5.8% -1.5% 0.1%
2013 -4.8% N/A 0.1% 0.6%
2004-2013 -18.1% 38.6% 6.9% 10.9%
/ote: SUSS is based on 2004-2012
Couche-Tard is for the US same store retail gallons
Casey's reflects same-store gallons sold
Susser reflects average retail gallons sold per store
17Fuel Declines Are Concerning (cont.)
• The effects of volume decreases have constrained fuel gross profit at The Pantry, while Susser, Casey’s
and Couche-Tard
Tard have enjoyed healthy cash flows
• Susser has increased fuel cash flows more than 104% over the last 10 years
• Casey’s has increased fuel cash flows more than 82% over the last 10 years
• Couche-Tard
Tard has increased fuel cash flows more than 103% over the last 10 years
• Pantry has increased fuel cash flows by a meager 6% over the last 10 years
Estimated Fuel Gross Profit % Change per Store
Year PTRY SUSS (1) CASY Couche-Tard (2)(3)
(4)
2005 25.7% 9.8% 9.4%
2006 23.3% 6.6% 11.2% 19.0%
2007 -27.4% -19.6% -4.5% 3.6%
2008 16.1% 75.6% 36.0% 18.9%
2009 17.3% -15.0% -6.2% 25.6%
2010 -13.2% 28.9% 7.6% -11.6%
2011 -3.5% 30.9% 11.3% 12.5%
2012 -14.5% -1.4% 2.9% 16.7%
2013 -3.4% -12.2% -0.2% -4.9%
2004-2013 5.9% 105.0% 82.3% 103.4%
/ote: SUSS is based on 2005-2012. All figures are end of FY Fuel Gross Profit / EOP Stores change over prior year.
1. 2013 Figures on based on last twelve months ended September 29, 2013
2. Excludes Gross Profit from their Statoil acquisition in 2013. Cumulative from 2006.
3. Accounting standard in 2011 switched from GAAP to IFRS, our reported gross profit in 2011 is based on IFRS, under GAAP gross profit in 2011
was a reported $700.6mm
4. Material business change leading to outlying figures.
18Fuel Declines Are Concerning (cont.)
With the debt covenant issues The Company is having, we are concerned the
Board is not focused on the possible issues with Letters of Credit for fuel
• Meanwhile, in much of The Pantry's core terrain, top-scale
top operators are ramping up
new retail models and offerings
• RaceTrac is plowing through more of the South, Sheetz and QuikTrip are expanding
smartly in the Southeast. Wawa and Thorntons are investing in Florida. New 7-
Elevens are springing forth across the region with improved foodservice programs
• The company's major vendors (including Marathon Oil, BP, and McLane) have
required significant letters of credit be posted by The Pantry in order to do business
with the company
• As of the first quarter of fiscal 2014, The Pantry had $83.6 million of letters of credit
outstanding. Although some of these letters of credit are related to self-insurance
self
programs and regulatory requirements (the company does not break out letter of
credit usage), the need for letters of credit in such volume means that if The Pantry
ran into trouble with its bank group over covenant violations the loss of letter of credit
availability would likely be devastating to the company in a short period of time
19EBITDA Declines are Concerning
• EBITDA has decreased over the last 10 years and capital allocation has
produced no return to shareholders
• Ed Holman, Thomas Murnane and Robert Bernstock have overseen this decline
EBITDA
300,000
250,000
200,000
150,000
100,000
50,000
-
2006 2007 2008 2009 2010 2011 2012 2013
204 CEOs in 5 Years – Continued Management
Turnover
• 2002 – Thomas Murnane Joins Board
“This cultural success is about people.
• 2005 – Ed Holman and Robert Bernstock Join Board It’s most important that people
understand where we’re going and are
focused along that clear path. It’s
• 2009 – Ed Holman becomes Chairman about holistic brand building.”
• 2009 – CEO Peter Sodini steps down -John Fisher, The Pantry, SVP of
Marketing and Merchandising,
-Convenience Store News, November
• 2009 – CEO Terry Marks joins from Coca Cola
2011.
– New head of marketing
– New CFO John Fisher quit in
– New CIO
January 2013 after less
– New Human Resources Director
than 3 years
• 2011 – CEO Terry Marks resigns to run Hooters
• 2011 – Chairman Ed Holman Interim CEO
• 2012 – 2013 – Dennis Hatchell CEO starts in 2012
– CFO Quits
– COO Quits, Hires a new one, COO quits again (Feb 2014)
– CIO Quits
– Head of Marketing quits to join Marks at Hooters
• Feb 2014 - Senior Vice President of Operations Quits
21More Senior Management Turnover
• On February 3, 2014, P. Joseph Venezia,
Venezia Senior Vice President, Operations,
resigned from The Pantry effective February 14, 2014 to pursue another career
opportunity
• As Senior Vice President of Operations Joe Venezia was an integral part of the team and
one of the most senior operations leaders under Dennis Hatchell, the CEO
• Mr. Veneiza came to The Pantry about a year ago and has been spoken very highly of by
the current CEO since then. Mr. Veneiza had a background at TitleMax, Walmart and
P&G
• Mr. Veneiza has been an integral part of The Pantry and we are concerned that his
resignation was caused by a lack of confidence in the track the Board has set for The
Company
• The Pantry has a history of senior management turnover
• High management turnover proves this Board has not found a solution despite
multiple attempts
22Board Has Overseen Poor Performance
• Six members of the Board have served for more than 7 years and have overseen The
Pantry’s poor performance
• Chairman of the Board is one of the longest tenured persons on the Board
• Our Nominees would bring operating expertise, capital allocation experience
and shareholder representation that the Board has never had. Now is the time
for change.
Time on 10 Year Pantry Performance
Director Board Title 80
70
60
Thomas M. Murnane 12 Director
50
Edwin J. Holman 9 Chairman
40
Robert F. Bernstock 9 Director
30
Wilfred A. Finnegan 8 Director 20
Terry L. McElroy 8 Director 10
Mark D. Miles 8 Director -
Dennis Hatchell 2 Director
Kathleen Guion 1 Director
23Concerned Pantry Shareholders (CPS) Plan
24Opportunities to Create Value
1. Reassess Capital Expenditures
• Closely monitor the proposed remodel program until ROIC is clearly articulated
• Suspend New Store Program until ROIC is clearly articulated
• Focus on Capital Expenditures that will generate meaningful ROIC
2. Real Estate Monetization
• Consider monetizing at least 150 stores and pay down Term Loan
• Estimated value of between $200 million and $250 million
3. Restructure Store Base
• Based on feedback from industry participants, we believe 300 – 500 stores are underperformers and could
potentially be a drain on resources
• Consider Dealer / Distributor Model that Racetrac executed with Raceway
• Underperforming stores could be sold for cash and allow the company to invest capital in the nearly 1,000
stores which are well positioned to grow. Frees up management time away from poor performing stores
4. Implement Better Quick Service Restaurant Plan
• Hire outside professionals who have experience in the space
• Explore opportunities with current franchisors and additional franchisors
• Focus on proprietary food offering
5. Enhance Corporate Governance
• Increase share ownership, allow for stockholder written consents, special shareholder meetings
251. Reassess Capital Expenditures
• The Pantry has forecasted to spend $110 million in capital expenditures for
2014
• The Pantry continues to spend millions without exhibiting any increase in
EBITDA
• “We completed 28 remodels during the first quarter. These remodels were focused in our high potential
markets, which is how we prioritize our spending. As just mentioned, we are evaluating the performance
of all completed remodels and incorporated what we learned to constantly refine and improve our results.”
Dennis Hatchell, 2013 Conference Call
• “We opened a new store in St. Augustine during the quarter. This store is off to a great start. We continue
to see potential in our new store format. We are actively pursuing high potential sites in targeted markets
for future growth.”
• The Company has been “evaluating” store performance for a significant
amount of time with little result
• “The Pantry will begin to remodel 10 percent of its stores every year”, President and CEO
Dennis Hatchell during an August 2012 call
• “Will consider acquisitions in what the company deems “high priority” markets”, according
to Dennis Hatchell during the Q4 2013 conference call
• Our nominees will analyze this spending – given the historical returns
to shareholders, do you want the Board to be responsible for this?
262. Real Estate Monetization
• The Company currently owns 410 sites of the more than 1,500 sites
• Buyers of convenience store properties have indicated approximately $500 to $600 million
value in 300 of the +400 owned stores
• This valuation confirms our belief that good stores, with no environmental issues can be
worth between $1.5 million to $2.0 million in a sale-lease
sale back scenario
– Implied capitalization rate of 7.25% to 8.25%
• Significant opportunities through alternative capital/ownership structures
– In 2012, Susser Holdings created an MLP by placing its Fuel Distribution business and several real estate
properties into a new entity
– Susser Holdings remains public and Susser Petroleum (MLP) is now public and distributes gas to Susser
Holdings stores. Big success
• Our nominees believe there is a similar but slightly different opportunity for The
Pantry
• Our nominees will focus on ALL opportunities to create value with the Owned and
Leased Real Estate
272. Real Estate Monetization (cont.)
• A significant portion of The Company’s store leases are up for renewal within the next four
years
• The Company should monetize underperforming stores – we believe these stores could
account for up to 300 – 500 stores
Lease
Expiration With Renewal Options Without Renewal Options Total Leased
391 31 422
2013 - 2017
2018 - 2022 522 13 535
171 3 174
2023 - 2027
2028 - 2032 2 1 3
— 2 2
2033 - 2037
1,086 50 1,136
282. Real Estate Monetization (cont.)
• Many of the acquisitions through which the Pantry has grown were accomplished by a
combination of (i)) cash payment to the prior owner and (ii) leasing the prior owner’s owned
properties under long-term
term leases at high rents
• Several critical variables affect what can/should be done with each site in the Company’s
portfolio, including:
– Cash Flow (historical and future trends) at a specific site;
– Overall Company performance (i.e. If the Company performs well, rent reductions and/or landlord capital contributions become
more available. If the Company is in financial difficulty, opportunity exists to restructure both short-term
short AND long-term leases
through application of optimal leverage);
– Quality of Location, inclusive of both business and real estate;
– Competitive Landscape (e.g. availability alternative convenience or land sites, competitors moving into the market/sub-market,
market/sub
etc.);
– Clean up responsibilities upon closure, if applicable;
– Impact of leaving a location controlled by multi-site
site landlord (i.e. if you move out of certain problem sites/poor performers, the
landlord may be uncooperative with others in which the company is looking to stay). This is a complexity that must always be
examined and administered through intelligent lease restructuring efforts;
– Lease term remaining – both primary lease term and options;
– Capital planning (i.e. the more significant the investment, the more the landlord may contribute)
– Lease rents compared to market;
– Landlord reporting of financial results at any site (i.e. the more the landlord knows, the more transparent the negotiation). Goal is
to keep financial reporting to landlords at an absolute minimum, as it makes the space more marketable to replacement tenants
and reduces lease negotiation leverage.
Our nominees are focused on accessing the tremendous amount
of value in the leases rolling off over the next several years
292. Real Estate Monetization (cont.)
• The Pantry has a substantial amount of value embedded in its owned real estate, leases
and company owned stores
• Our nominees will work to unlock this value
Estimated Estimated Estimated
100% Sale 50% Sale 50% Sale
of Real Estate of Real Estate REIT/MLP Formation
Current Properties 300 300 300
Estimated Appraised Value $500 million $500 million $500 million
Estimated Cash Proceeds $500 million $250 million $250 million
Pro Forma Share Ownership - - $250 million
303. Restructure Store Base
• The Company has a
significant amount of
Charlotte (474 stores) Jacksonville (269 stores)
value in these 6 #1 #2 #3 #1 #2 #3
Metropolitan Areas.
• Charlotte, Jacksonville
and Columbia are their
strongest MA’s
Columbia (241 stores) Nashville (162 stores)
• Some markets are worth
#1 #2 #3
substantially more than #1 #2 #3
others
• Our nominees will
work with management
and the Board to do a
full analysis of each Memphis (82 stores) New Orleans (56 stores)
market and work to get
to a store base that #1 #2 #3 #1 #2 #3
financially makes
sense for The Pantry
314. Implement A Better QSR Plan
• The implementation of quick service restaurants in convenience stores over the last
10 years has been a significant traffic and cash flow driver for competitors such as
Susser and Casey’s
• While The Pantry does have quick service restaurants, many of their competitors
have a much larger % of their revenues coming from Foodservice
• The Company has not capitalized on the QSR opportunity
– In December 2011, the Company began the “Fresh Initiative Program” – we have heard very little about this
program in the years hence and the effect it’s had on the Company
– The Pantry began testing Noble Roman’s Pizza in January of 2012 in Indianapolis based stores
– The Pantry began testing Taco Del Mar restaurants in May 2013 in two stores
– The Pantry began testing Little Caesar’s pizza in October 2013 in Charolotte
– “Additionally, we opened four new QSRs during the quarter, bringing our total to 221. Three of these new
QSRs were Little Caesar pizza restaurants and we are pleased with the results that we are seeing with this
new partnership.” Q1 2014
• The Board has proven incapable of overseeing these programs
• We would bring expertise in the Restaurant industry to take advantage of this
opportunity: 1) Focusing on ROIC, 2) Creating an Urgent Build Plan, 3)
Creating Restaurant Partnerships, and 4) Exploring Proprietary QSR Concepts
324. Implement A Better QSR Plan (cont.)
Our nominees will take advantage of this opportunity in an urgent
manner
• A significant profit opportunity through
% Foodservice / Total Merchandise
QSR growth
17%
• The current Board doesn’t have the
background to address this opportunity
11% 11%
• The Pantry has significant competition 9% 9%
9%
entering their markets and it is urgent
that The Company defend their position
• We do not believe the incumbent Board
has significant expertise to execute on
this opportunity as they have yet to show
an ability
1
• Our nominees are experienced
restaurateurs with long term
relationships in the restaurant space 1 NACS 2012 State of the Industry Annual Report
33ANALYSIS: Can The Pantry Be Saved?
Saved
CSP Daily News
Independent convenience store news agrees
• “Others are suggesting The Pantry downsize to its regional strengths, to withdraw from markets where it is No. 3,
4 or 5 in consumer choice and shift capital into the Carolinas and Florida and a handful of other select markets.
• The dissident group of stakeholders, calling themselves Concerned Pantry Shareholders
and nominating three candidates with seemingly solid retail backgrounds to The Pantry's
board, has accurately identified the many problems plaguing The Pantry.
• I believe if The Pantry is to have a chance it will require radical steps to restore trust with creditors and vendors,
including the following:
• New Management Team and Board: It is critical The Pantry install a team that includes the brightest minds in the
c-store
store channel. Not just retailing, but convenience specifically. Currently, there is not a single c-store
c member on
the executive team. That must change.
• Debt: I agree with those who believe The Pantry should cull its network, withdraw from weaker markets and
significantly attack its debt.
• C-Store Retail Strategy: To its credit, The Pantry has undertaken some important initiatives, ramping up its
coffee program and freshening its foodservice offering. Yet, when compared to leading chains in The Pantry's
markets, the company pales much in the way coffee consumers strongly prefer Dunkin Donuts over McDonald's
for their morning java. There is little in the food or coffee offering that would pull a consumer from Sheetz, Wawa,
QuikTrip or RaceTrac.
• Fuel: The company is using the KSS fuel software system and has been tooling with pricing strategies and profit
projections. What is most challenging, though, is the national decline in fuel consumption and that The Pantry's
street prices are neither the lowest, nor is its inside offering robust enough to generate enough dual users--those
users
who both fuel up and shop inside.”
34Change at the Board is Long Overdue
• Concerned Pantry Shareholders (CPS) is committed to realizing full value
for all shareholders
• We are significant shareholders whose interests are aligned with all
shareholders
– We have been purchasing shares of The Company. The current directors have been net sellers
• Our slate has significant experience
– Operational
– Restaurant / Retail Focus
– Proven capital allocators
• Commitment to the highest levels of corporate governance
• We have nominated directors who are highly qualified and offer
a better plan for the future of The Pantry
35Our Board Nominees: Highly Qualified and Independent
• Todd Diener
Former President of Chili’s Grill & Bar
– Former executive officer of Brinker International, Inc. (“Brinker”)
where he most recently served as the President of Chili’s Grill & Bar
(“Chili’s”) and On the Border restaurants. During this time, Chili’s
was one of the largest casual dining restaurant chains in the world
with more than 1,200 locations in the United States and 200
international locations in 28 countries. In his role as President of • +$2.8 billion Revenue
Chili’s, Mr. Diener led all aspects of the brand, including finance, • + 1,500 Restaurants
P&L, marketing, operations, real estate, human resources and
franchising.
– Prior to his role as President of Chili’s and On the Border, Mr.
Diener served in the roles of Executive Vice President and Chief
Operating Officer of Brinker, where he was responsible for more
than 1,500 restaurants. Mr. Diener oversaw company-owned
company and
franchised operations for On the Border, Macaroni Grill, Maggiano’s
and Corner Bakery Café restaurants in the United States and 24
other countries.
– Mr. Diener’s over 28 years of experience in a senior capacity at
Chili’s provide him with deep strategic and operational expertise in
exploring ways to improve financial performance and maximize
returns of a public retail company.
36Our Board Nominees: Highly Qualified and Independent
• James Pappas
Chairman of the Board, Morgan’s Food’s
Managing Member, JCP Investment Management, LLC • + 70 Restaurants
• Ohio, Pennsylvania,
– Goldman Sachs, Banc of America Securities West Virginia, New York,
– 10 years of investment banking, investment Missouri, Missouri
management and capital allocation experience
– Significant quick-service
service restaurant industry
experience having focused on restaurants for 10
years in investment banking and as Managing
Member of JCP
– JCP owns approximately 253,000 shares of stock
•Managing
Managing Member of JCP Investment Management, LLC (“JCP Management”) and the sole member of JCP Investment Holdings, LLC (“JCP (“JC
Holdings”), the investment manager and general partner, respectively, of certain entities whose principal business is investing
investi in securities. Mr.
Pappas also currently serves as the Chairman of the Board of Morgan’s Foods (OTC:MRFD), a public company that operates through throug wholly-
owned subsidiaries KFC restaurants under franchises from KFC Corporation, Taco Bell restaurants under franchises from Taco Bell Be
Corporation and Pizza Hut Express restaurants under licenses from Pizza Hut Corporation. Mr. Pappas is also the Chairman of the t
Compensation and Leadership Committee of Morgan’s Foods. From 2005 until 2007, Mr. Pappas worked for The Goldman Sachs Group, Inc. I
(NYSE:GS) (“Goldman Sachs”), a multinational investment banking and securities firm, in their Investment Banking / Leveraged Finance
Division. As part of the Goldman Sachs Leveraged Finance Group, Mr. Pappas advised private equity groups and corporations on appropriate
leveraged buyout, recapitalization and refinancing alternatives. Prior to Goldman Sachs, Mr. Pappas worked at Banc of America Securities,
S the
investment banking arm of Bank of America (NYSE:BAC), a multinational banking and financial services corporation, where he focused
fo on
Consumer and Retail Investment Banking, providing advice on a wide range of transactions including mergers and acquisitions, financings,
restructurings and buyside engagements. Mr. Pappas received a BBA, and a Masters in Finance from Texas A&M University.
37Our Board Nominees: Highly Qualified and Independent
• Joshua Schechter
Managing Director, Steel Partners
– Experienced value investment manager
– 10 years of investment management experience
– Served on board of directors of Handy and Harmon, Puroflow, Jackson
Products and Aderans Co., Ltd
– Significant M&A and operational excellence experience
– Mr. Schechter owns approximately 13,000 shares
• From 2001 to 2013, Mr. Schechter served as Managing Director of Steel Partners Ltd., a privately owned hedge fund
sponsor, and its affiliates. Mr. Schechter has served as co-President
co of Steel Partners Japan Asset Management, LP, a
private company offering investment services, since 2008. From 2005 until 2008, Mr. Schechter served on the Board of
Directors of WHX Corporation (n/k/a Handy & Harman Ltd.) (NASDAQ: HNH), a diversified manufacturer of engineered
niche industrial products with leading market positions in many of the markets it serves. Mr. Schechter was also a
member of the Board of Directors of Puroflow,, Inc. (n/k/a Argan, Inc.) (NYSE:AGX), a provider of a full range of power
industry and telecommunications infrastructure services, from 2001 until 2003. Mr. Schechter earned an MPA in
Professional Accounting, and a BBA from The University of Texas at Austin. Mr. Schechter’s experience in a variety of
industries together with his managerial experience in a variety of roles will enable him to provide invaluable oversight to
the Company’s Board.
38Board Incumbents Have Not Created Value in 10 Years
The majority of the Board has overseen negative shareholder returns over the past
10 years
Since the beginning of 2010, The Pantry’s directors have sold 22,096 shares of
common stock in the open market and have purchased only 2,535 shares,
according to The Company’s public filings
• Ed Holman
• During his tenure on the Board of over 9 years the stock price has declined by over 50%
• No convenience store experience, no fuel experience, no restaurant experience
• As Chairman, after speaking with industry professionals, we believe that Ed has been a primary issue with
attracting a strong CEO and management team – having already been through 4 CEOs in 5 years
• Thomas Murnane
• During his tenure on the Board over 10 years the total shareholder return has been poor
• As Head of the Nominating Committee, Tom has not properly assessed performance relative to tenure
• No convenience store experience, no fuel experience, no restaurant experience
• Robert Bernstock
• During his tenure on the Board of over 9 years the stock price has declined by over 50%
• An investigation by the Office of Inspector General of Mr. Bernstock uncovered numerous ethics
infractions, including granting millions of dollars of no-bid
no contracts during his role as VP of Mailing and
Shipping Services for USPS. He later resigned.
• We have nominated directors who have invested in The Company, offer a
better plan and have the relevant experience to execute on it
39Director Pay is Excessive Given Performance
Board compensation has increased consistently, every year since
2007 for a total increase of 44% or 6.3% compounded over the
last 6 years
• From 2007 to 2012 the Board was paid $4.3 million in cash pay and $4.2
million in stock compensation for a total of $8.5 million over 6 years
• If The Company was having success, performance should be rewarded, but
this has not been the case
• Our nominees are willing to work for 80% less, will have a strong
shareholder representation and set Board pay at levels which are
reasonable and tied to creation of shareholder value
40We Have Tried to Reach a Mutually Agreeable
Resolution with Pantry
CPS has invested significant time and effort in an attempt to reach
a settlement agreement with The Pantry.
• We are seeking to work constructively with the rest of the Board and
management
• Our Nominees have corporate governance experience,
experience capital
allocation experience, operating experience,
experience and will explore all
options to unlock value
• We have nominated directors who we believe are highly
qualified, offer new perspectives and have a better plan for the
future of The Pantry
41Nominees Are Ready to Create Value
High management turnover proves this Board has not found a
solution despite multiple attempts
Each of our nominees is highly capable and qualified to help
turnaround The Pantry having restaurant operations, capital
allocation and corporate governance experience
There is a TREMENDOUS opportunity to create value at the Pantry
and our nominees will work tirelessly to achieve that value
42Appendix
43Company Profile
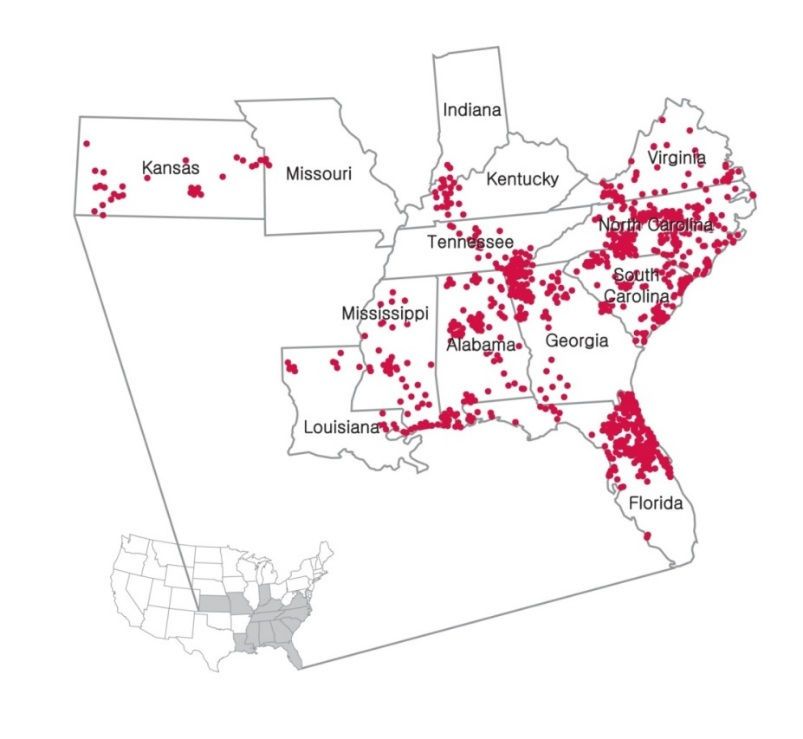
• Headquartered in Cary, North Carolina, State FY 2013 % Stores
Florida 24.2
Pantry has 90% of its stores in Florida, North Carolina 22.5
North Carolina, South Carolina, Georgia, South Carolina 17.2
Alabama, Tennessee and Mississippi Georgia 7.2
Alabama 7.1
Tennessee 6.3
• Started in the 1960’s, The Company Mississippi 6.1
Other 9.4
went on a significant acquisition spree in
the 1980’s and ’90’s Total 100.0
• IPO in 1999 to reduce debt
• The Pantry's stores offer a broad
selection of merchandise, as well as fuel
and other ancillary services designed to
appeal to the convenience needs of its
customers
44Revenue Contribution
Category Sales1 QSRs
Currently over 220 in-store QSRs
World’s 5th largest operator of Subway
Other Non-Food Services restaurants
Merchandise 4%
5%
Other Tobacco
6%
Cigarettes
30%
Packaged Beverage
16%
Services
ATMs
Foodservice
11% Grocery Lottery
13%
Beer/Wine Car wash
15%
Prepaid products / money orders
1 Results as of LTM June 2013
45GAAP Financials
($ in thousands) Twelve Months Ended
September 24, September 30, September 29, September 27, June 27,
2009 2010 2011 2012 2013
Adjusted EBITDA $ 283,541 $ 239,848 $ 231,728 $ 210,126 $ 206,152
Impairment charges (2,084) (267,079) (12,555) (6,257) (5,469)
Gain (loss) on extinguishment of debt 4,007 (791) (15) (5,532) (2,993)
Interest expense, net (91,483) (88,256) (87,491) (84,219) (90,155)
Depreciation and amortization (108,712) (120,605) (117,025) (119,672) (120,800)
Income tax benefit (expense) (31,178) 71,268 (4,827) 3,007 4,506
Net income (loss) $ 54,091 $ (165,615) $ 9,815 $ (2,547) $ (8,759)
Adjusted EBITDA $ 283,541 $ 239,848 $ 231,728 $ 210,126 $ 206,152
Gain (loss) on extinguishment of debt 4,007 (791) (15) (5,532) (2,993)
Interest expense, net (91,483) (88,256) (87,491) (84,219) (90,155)
Income tax (expense) benefit (31,178) 71,268 (4,827) 3,007 4,506
Stock-based compensation expense 6,367 3,478 2,153 2,823 3,001
Changes in operating assets and liabilities (18,050) (13,593) 6,621 6,931 (17,555)
Expense (Benefit) for deferred income taxes 10,337 (68,611) 22,071 (2,516) (1,868)
Other 5,895 11,482 8,470 13,397 8,542
Net cash provided by operating activities $ 169,436 $ 154,825 $ 178,710 $ 144,017 $ 109,630
Additions to property and equipment, net (117,244) (97,511) (92,760) (54,980) (63,876)
Acquisitions of businesses, net (48,768) (10) (47,564) - (502)
Net cash used in investing activities $ (166,012) $ (97,521) $ (140,324) $ (54,980) $ (64,378)
Net cash used in financing activities $ (50,732) $ (26,547) $ (25,255) $ (213,630) $ (180,899)
Net increase (decrease) in cash $ (47,308) $ 30,757 $ 13,131 $ (124,593) $ (135,647)
46The Pantry, Inc.
Concerned Pantry Shareholders
February 2014
Enhancing Stockholder Value at The Pantry
ISS Follow Up Materials
1Competitors Have Had Huge Success
• 10 Years ago The Pantry boasted the 2nd largest store base
• The Pantry has produced negative returns to shareholders over this time period
• Direct competitors have had a tremendous amount of success
End of Period Store Base EBITDA
Year PTRY SUSS(1) CASY ATD/B Year PTRY SUSS CASY ATD/B
FY 2004 1,361 306 1,358 4,881 FY 2004 $173 $47 $116 $234
FY 2013 1,548 559 1,749 6,094 FY 2013 202 177 322 1,390
10 Year Cumulative 14% 83% 29% 25% 10 Year Cumulative 17% 277% 178% 495%
Source: SEC Filings. Source: SEC Filings.
1. Most recently reported figure for 2013, SUSS has !ote: Susser is at FY 2006 IPO and FY
not yet reported FY 2013 2013 is Sept LTM.
2Need to Drive Traffic to the Stores
• Merchandise gross profit remains the largest driver of overall cash flow in the
convenience store space. Currently, The Pantry generates 75% of gross profit from
inside sales
• Driving total site traffic to the stores is essential to success
% of Gross Profit
Fuel Inside Sales and Other
Pantry 25% 75%
Casey's 22% 78%
Susser 34% 66%
Alimentation Couche-Tard 36% 64%
Average 29% 71%
!ote: FY 2013 except Susser,, which is LTM September.
3You can also read