Results for the half year ended 31 December 2021 - 23 February 2022 - APA Group

Page created by Warren Dawson
 
CONTINUE READING
Results for the half year ended 31 December 2021 - 23 February 2022 - APA Group
Results for the half year
ended 31 December 2021
23 February 2022
Results for the half year ended 31 December 2021 - 23 February 2022 - APA Group
disclaimer

This presentation has been prepared by Australian Pipeline Limited (ACN 091 344 704) as responsible entity of the Australian                                performance to differ materially from such forward-looking statements, opinions and estimates.
Pipeline Trust (ARSN 091 678 778) and APT Investment Trust (ARSN 115 585 441) (APA Group).
                                                                                                                                                            Investors should form their own views as to these matters and any assumptions on which any forward-looking statements are
The information in this presentation does not contain all the information which a prospective investor may require in evaluating a                          based. APA Group assumes no obligation to update or revise such information to reflect any change in expectations or
possible investment in APA Group and should be read in conjunction with the APA Group’s other periodic and continuous                                       assumptions.
disclosure announcements which are available at www.apa.com.au.
                                                                                                                                                            Investment risk: An investment in securities in APA Group is subject to investment and other known and unknown risks, some
All references to dollars, cents or ‘$’ in this presentation are to Australian currency, unless otherwise stated.                                           of which are beyond the control of APA Group. APA Group does not guarantee any particular rate of return or the performance of
                                                                                                                                                            APA Group.
Not financial product advice: Please note that Australian Pipeline Limited is not licensed to provide financial product advice in
relation to securities in the APA Group. This presentation is for information purposes only and is not financial product or                                 Non-IFRS financial measures: APA Group results are reported under International Financial Reporting Standards (IFRS).
investment advice or a recommendation to acquire APA Group securities and has been prepared without taking into account the                                 However, investors should be aware that this presentation includes certain financial measures that are non-IFRS financial
objectives, financial situation or needs of individuals. Before making an investment decision, prospective investors should                                 measures for the purposes of providing a more comprehensive understanding of the performance of the APA Group. These non-
consider the appropriateness of the information having regard to their own objectives, financial situation and needs and seek                               IFRS financial measures include FCF, EBIT, EBITDA and other “normalised” measures. Such non-IFRS information is unaudited,
professional advice if necessary.                                                                                                                           however the numbers have been extracted from the audited financial statements.

Past performance: Past performance information should not be relied upon as (and is not) an indication of future performance.                               Not an offer: This presentation does not constitute an offer, invitation or recommendation to subscribe for or purchase any
                                                                                                                                                            security. In particular, this presentation does not constitute an offer to sell, or a solicitation of an offer to buy, any securities in the
Forward looking statements: This presentation contains certain forward looking information, including about APA Group, which                                United States. Securities may not be offered or sold, directly or indirectly, in the United States or to persons that are acting for the
is subject to risk factors. “Forward-looking statements” may include indications of, and guidance on, future earnings and financial                         account or benefit of persons in the United States, unless they have been registered under the U.S. Securities Act of 1933, as
position and performance, statements regarding APA Group’s future strategies and capital expenditure, statements regarding                                  amended (the U.S. Securities Act), or are offered and sold in a transaction exempt from, or not subject to, the registration
estimates of future demand and consumption and statements regarding climate change and other environmental and energy                                       requirements of the U.S. Securities Act and any other applicable state securities laws.
transition scenarios. Forward-looking statements can generally be identified by the use of forward-looking words such as,
'expect', 'anticipate', 'likely', 'intend', 'could', 'may', 'predict', 'plan', 'propose', 'will', 'believe', 'forecast', 'estimate', 'target', 'outlook',   Non-GAAP financial measures: Investors should be aware that certain financial data included in this presentation are "non-
'guidance' and other similar expressions and include, but are not limited to, forecast EBIT and EBITDA, free cash flow, operating                           GAAP financial measures" under Regulation G of the U.S. Securities Exchange Act of 1934, as amended. These measures are
cash flow, distribution guidance and estimated asset life.                                                                                                  EBITDA, normalised EBITDA and statutory EBITDA. The disclosure of such non-GAAP financial measures in the manner
                                                                                                                                                            included in the presentation may not be permissible in a registration statement under the U.S. Securities Act. These non-GAAP
APA Group believes that there are reasonable grounds for these forward looking statements and due care and attention have                                   financial measures do not have a standardised meaning prescribed by Australian Accounting Standards and therefore may not
been used in preparing this presentation. However, the forward looking statements, opinions and estimates provided in this                                  be comparable to similarly titled measures presented by other entities, and should not be construed as an alternative to other
presentation are based on assumptions and contingencies which are subject to change without notice, as are statements about                                 financial measures determined in accordance with Australian Accounting Standards. Although APA Group believes these non-
market and industry trends, which are based on interpretations of current market conditions and are subject to risk factors                                 GAAP financial measures provide useful information to users in measuring the financial performance and condition of its
associated with the industries in which APA Group operates. Forward-looking statements, opinions and estimates are not                                      business, investors are cautioned not to place undue reliance on any non-GAAP financial measures included in this presentation.
guarantees or predictions of future performance and involve known and unknown risks and uncertainties and other factors, many
of which are beyond the control of APA Group, and may involve significant elements of subjective judgement and assumptions as                               Acknowledgement: Certain icons used in the presentation were designed by Freepik, Icongreek26, Nikita Golubev, Eucalyp and
to future events which may or may not be correct. There can be no assurance that actual outcomes will not materially differ from                            Srip from Flaticon.
these forward-looking statements, opinions and estimates. A number of important factors could cause actual results or

                            APA 1H22 Results Investor Presentation                                                                                                                                                                                                                                    2
Results for the half year ended 31 December 2021 - 23 February 2022 - APA Group
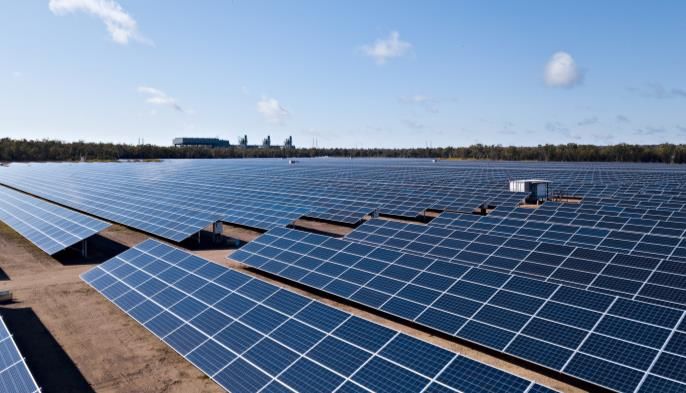
In the spirit of reconciliation APA
                     acknowledges the Traditional
                   Custodians of country throughout
                 Australia and their connections to land,
                           sea and community.

                We pay our respects to their elders past
                and present, and extend that respect to
                all Aboriginal and Torres Strait Islander
                             Peoples today.

APA 1H22 Results Investor Presentation                      3
Results for the half year ended 31 December 2021 - 23 February 2022 - APA Group
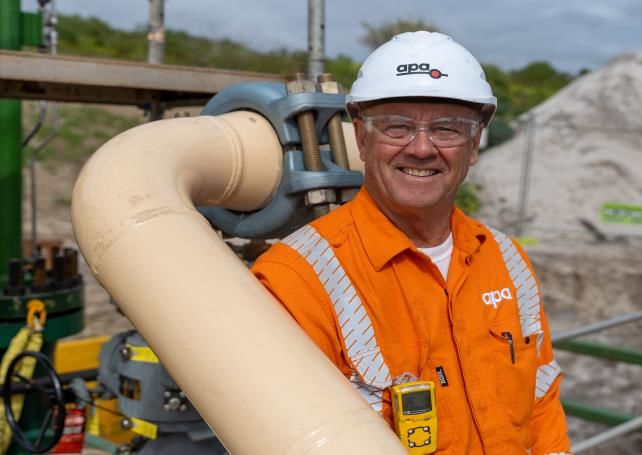
Our people are the keys to our success

                                         4
Results for the half year ended 31 December 2021 - 23 February 2022 - APA Group
APA is a leading energy infrastructure business

  Creating value for our Securityholders and the                                                            Diverse energy infrastructure portfolio
  Community
  • Developing and operating critical energy                                                 Gas infrastructure                                             Power Generation
    infrastructure
                                                                                                 Transmission (1)                                             Renewable energy (1)
      – Australia's largest gas pipeline owner and
        operator                                                                                 >15,000 km transmission                                      342 MW Wind
                                                                                                 pipelines                                                    237 MW Solar
      – Connecting regions with electricity
        transmission                                                                             Storage
                                                                                                 12,000 tonnes LNG                                            Gas fired (1)
      – Powering industry and communities with gas                                                                                                            440 MW
                                                                                                 18 PJ gas
        and renewable energy
  • Earnings stability from highly contracted and                                                Processing (1)
    regulated operations                                                                         90 TJ/day processing plants
                                                                                                                                                        Electricity transmission
  • Maintaining investment discipline and
    a competitive cost of capital                                                                Distribution(2)
                                                                                                 >29,500 km gas mains and
  • Paying $2.8 billion in distributions to                                                      pipelines                                                    243 km high voltage lines(1)
    our securityholders in the last 5 years                                                      >1.4 million gas customers

(1) Includes 100% of assets operated and/or under construction by APA Group, which form part of Energy Investments segment, including SEA Gas and EII (partially owned)
(2) Includes 100% of assets operated by APA Group in Queensland, New South Wales, Victoria and South Australia

                 APA 1H22 Results Investor Presentation                                                                                                                                      5
Results for the half year ended 31 December 2021 - 23 February 2022 - APA Group
Relentless focus on operational reliability, health, safety and wellbeing

        Reliable                                                 99.9%                                                                                                                             ~32% reduction
                                                                                                                                    Safety at the                                                  in Total Recordable
        infrastructure                                           Gas transmission
                                                                 nominations delivery(1)                                            forefront                                                      Injury Frequency Rate
        operations                                                                                                                                                                                 (TRIFR)(2)

                                                                                                                                                    Total Recordable Injury Frequency
                                      >97%                                                                                                          Rate(3)
                                      Gas transmission compressors                                                                      16
                                                                                                                                                                                                                       APA Overall
                                      average reliability
                                                                                                                                        12

                                                                                                                                                                                                                8.7 Contractors
                                                                                                                                          8

                                                                                                                                                                                                                 5.1
                                      ~94%                                                                                                4
                                                                                                                                                                                                                2.3 Employee
                                      Availability factor with 511 GWh of
                                                                                                                                          0
                                      renewable energy                                                                                     FY18              FY19               FY20     1H21      FY21     1H22

Notes:
(1) As at 1H22. (2) TRIFR reduction from 1H22 period versus the previous corresponding period of 1H21. TRIFR is measured as the number of lost time and medically treated injuries sustained per million hours worked. Data includes both employees
and contractors. (3)The FY21 Actual TRIFR rate has been amended from 6.3 to 5.7 in response to receipt of additional contractor hours post the FY21 result

                        APA 1H22 Results Investor Presentation                                                                                                                                                                        6
Solid 1H22 financial results

• Solid financial performance reflecting recent investments, improving conditions for gas infrastructure and the broader economic recovery

                       Revenue up 4.3% with                                                                                                                                    FCF up 22.6% driven by
                       positive contributions                                                        Underlying                                                                higher EBITDA, lower
                       from every operating                                                          EBITDA up 4.5%(1)                                                         interest costs and lower
                       segment(1)                                                                                                                                              tax paid

• Distribution growth reflects strong cash conversion, benefits from the March 2021 debt refinancing activities and a positive outlook

                                                                                                     FY22 distribution                                                         Favourably exposed to
                       1H22 distribution of
                                                                                                     guidance of 53.0 cps                                                      rising inflation with
                       25.0 cps, 4.2% increase
                                                                                                     retained, 3.9% increase                                                   almost 100% of
                       on 1H21                                                                                                                                                 contracted revenues
                                                                                                     on FY21
                                                                                                                                                                               linked to inflation indices

 Notes:
 (1) Revenue excluding pass-through and underlying EBITDA excludes significant items; 1H22 Profit after tax including significant items was $155.6 million; 1H21 loss $15.5m

                     APA 1H22 Results Investor Presentation                                                                                                                                                  7
Strong progress on the execution of APA's strategy

   Gas, electricity and                             • $150m investment in Mica Creek Solar      Next generation energy     • Parmelia Gas Pipeline Hydrogen Project phase 2
   renewables infrastructure                          Farm                                      technologies               • Proposal for a hydrogen feasibility study in the
   investments                                      • Kurri Kurri Lateral subject to FID        (Pathfinder Program)         Victorian Transmission System
                                                    • East Coast Grid expansion                                            • Feasibility study for Central Queensland Hydrogen
                                                    • Strategic investment in Basslink senior                                Project
                                                      secured debt (100%)                                                  • Mid-West Blue Hydrogen and Carbon Capture and
                                                    • Organic growth pipeline now in excess                                  Storage feasibility study
                                                      of $1.4b for FY22 to FY24

   Respond to the changing                          • Stakeholder engagement on Victorian       Disciplined investments    • $1.8b of liquidity from cash and undrawn debt
   needs of our customers                             Transmission System and Roma              and maintaining a strong     facilities(1)
   and communities                                    Brisbane Pipeline                         balance sheet              • Significant credit metric headroom to fund growth
                                                    • Collaboration with Boonthamurra                                        and / or support potential future capital
                                                      People of southwest Queensland                                         management initiatives
                                                    • Gruyere battery energy storage system                                • Average debt tenor at 7.4 years with average cost
                                                      complete; commissioning of 13MWp                                       of debt at 4.6%(1)
                                                      solar expected Q3 FY22                                               • FY22 distribution guidance of 53c, up 3.9%
                                                                                                                             maintained

Notes:
(1) As at 31 December 2021

                  APA 1H22 Results Investor Presentation                                                                                                                8
Gas will play a critical role in Australia's energy system as an essential
companion to renewables and a critical industrial energy source

    • In Australia, gas accounts for:
                                                                                   National Electricity Market (NEM)           Gas is typically around half the
        – 27% of primary energy                                                            Generation mix(1)                    emissions intensity of coal(2)
          consumption                                                                                Gas
                                                                                                   6.6%      Hydro
        – 21% of electricity generation                                                                                          1.18
                                                                                                          7.2%
        – 7% of the electricity generation in                                                                                                     0.90
          the NEM                                                                                                    Wind
                                                                                                            10.4%
    • Gas is critical for:                                                                                                                                       0.47
                                                                                              203 TWh
        – firming of renewable energy
                                                                                                             10.9%
                                                                                     64.7%                           Solar
        – to support industry, including high                                                                                       NEM Tonnes of CO2e per MWh
                                                                              Coal                          0.2%
          heat and hard to abate sectors                                                                                                      (Scope 1 & 2)
                                                                                                                   Battery
    • Natural gas is the most efficient and                                                                        and other   Brown Coal   Black Coal   Gas (CCGT & OCGT)

      cleanest firming energy source

Notes:
(1) National Electricity Market (East Coast Australia) 2021 OpenNEM data
(2) National Greenhouse and Energy Reporting data, Clean Energy Regulator (2020)

                   APA 1H22 Results Investor Presentation                                                                                                                    9
Removing coal power generation from South Australia increased gas as
a proportion of the state’s energy mix to 35%
                                                                                14.4 TWh   14.9 TWh
                                                                                  5.7%
    • Five years after South Australia removed coal from                                    18.0%
      its energy system, gas continues to play a vital role to
      support renewables and has grown from 31% to 35% of the                    29.9%                Battery and other
      energy mix(1)                                                                                   Solar
    • When renewable power generation supply is low, gas                                              Wind
      provides the necessary firming to keep the state's lights on                          38.5%     Gas
                                                                                                      Coal
    • With no coal power generation, South Australia relies on
                                                                                 31.1%                Imports
      35% gas power generation. Australia's NEM relies on 65% of
      coal power generation and 7% of gas power generation
    • The recent European experience, where energy prices have
      more than doubled, demonstrates the risks associated with
      not having enough gas in the energy mix(2)                                 18.0%      35.1%

                                                                                 15.3%
                                                                                            7.7%

Notes:                                                                           2016       2021
(1) OpenNEM Data
(2) Source: https://www.iss.europa.eu/content/europes-energy-crisis-conundrum

                                                                                                                          10
                   APA 1H22 Results Investor Presentation
APA continues to make progress with our organic growth pipeline across
all energy markets
    Gas infrastructure

                         East Coast Grid Expansion                 Northern Goldfields Interconnect        Kurri Kurri Lateral Pipeline

                         • Increasing winter peak capacity up to   • A new 580km pipeline that increases   • Proposed development of gas pipeline
                           25% through two-staged expansion                                                  to the Hunter Power Project with the
                                                                     capacity to the Goldfields region
                                                                                                             ability to deliver blended hydrogen to
                         • Capital investment of ~$270m            • Capital investment of ~$460m            the receipt station
                                                                                                           • Capital investment of ~$250m
Electricity and

                          Gruyere Hybrid Energy Microgrid           Mica Creek Solar Farm
 renewables

                          • Combined gas, renewable energy          • 88MW solar farm backed by gas
                            and battery storage energy solution       power generation; biggest off-grid
                                                                      solar in Australia
                          • Capital investment ~$40m
                                                                    • Capital investment ~$150m

                         APA 1H22 Results Investor Presentation                                                                                       11
APA is executing its strategy to grow its electricity footprint with a
strategic investment to acquire 100% of Basslink senior secured debt

                                                                                                 Acquisition of 100% of Basslink senior secured debt(1)
                                                                                                 Debt acquired at a discount to face value. APA intends to work constructively with
                                                                                                 the receivers and managers, and Hydro Tasmania and the State of Tasmania, to
                                                                                                 put Basslink on a stable footing and ultimately convert it into a regulated asset

                                                                                                 Attractive electricity transmission asset
                                                                                                 Aligns with APA's strategic focus on contracted and regulated
                                                                                                 energy infrastructure and our support for renewable energy generation

                                                                                                 Platform for further growth
                                                                                                 Through its involvement in Basslink, APA will be well placed to support and
                                                                                                 potentially participate in adjacent energy opportunities
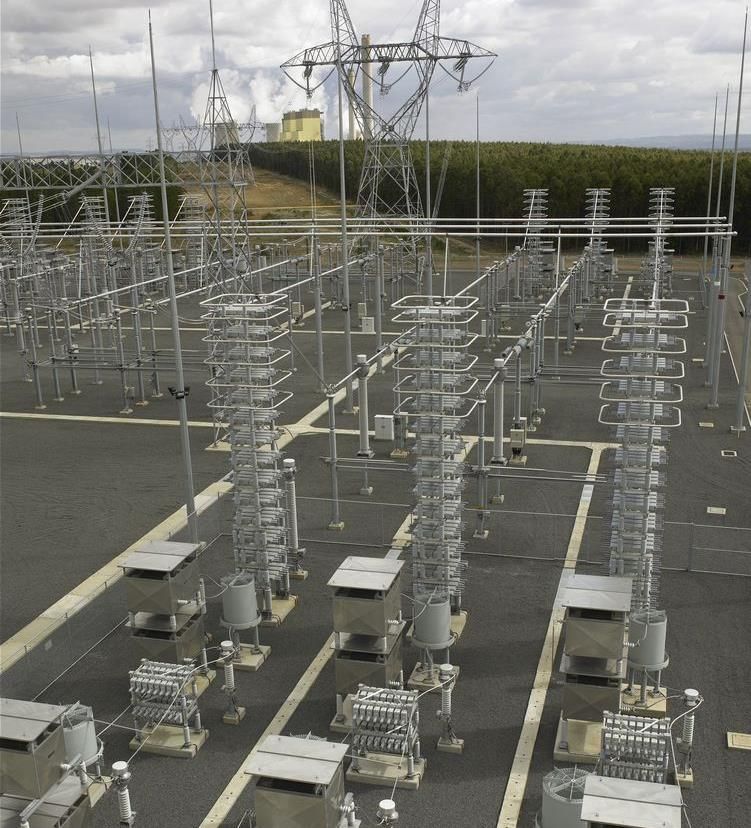
 Triple tuned harmonic filter in Loy Yang AC yard

Notes:
(1) As at 23 February 2022, APA has rights to acquire 84% of Basslink senior secured debt, subject to satisfaction of conditions precedent; taking total to 100%. See announcement lodged with the
ASX on 21 February 2022

                    APA 1H22 Results Investor Presentation                                                                                                                                           12
APA is also playing a critical role in Australia's energy transition via its
investment in future energy technologies

 Parmelia Gas Pipeline Hydrogen Project              Victorian Transmission System                   Net Zero 2050

                                                     • Proposal to develop Australia’s first         • Progressing our ambition to achieve
 • Proposed 100% hydrogen conversion of
                                                       blueprint for state-wide hydrogen               Net Zero operational emissions
   a section of existing pipeline in Western
                                                       blending                                        (Scope 1 and 2) by 2050 with
   Australia
                                                     • Hydrogen safety proposal to                     interim targets to be released during
 • Phase 2 underway - lab testing of the               test network under access arrangement           2022
   pipeline materials in gaseous hydrogen
                                                                                                     • Joined as Founding Members of
   conditions
                                                                                                       Materials & Embodied Carbon
                                                                                                       Leaders’ Alliance to be a part of an
                                                                                                       industry-wide and cross-sector
 Central Queensland Hydrogen Project                 Mid-West Blue H2 & CCS Project
                                                                                                       conversation seeking to stimulate
 • Feasibility study into the development of         • Feasibility study to identify opportunities     demand for low-carbon materials,
   a large scale renewable hydrogen project            to commercialise and distribute low-cost        including steel and concrete.
   in Central Queensland with exports to               blue hydrogen                                 • Joined CEO Climate Leaders
   Japan                                             • Potential use of the Cliff Head oil project     Coalition
                                                       to store carbon dioxide

            APA 1H22 Results Investor Presentation                                                                                             13
Progressing our Sustainability Roadmap to 2024
                               BUILD                                                            ACCELERATE                                                        MAINTAIN & EVOLVE

        Priority issues to be built into strengths                        Fundamental issues which require strengthening Existing plans & processes to evolve via ESG lens

 • Climate Change Transition & Risk                                       •   Environmental and heritage management                                •   Safety, Health & Wellbeing
 • Community & Social Performance                                                                                                                  •   Diversity & Inclusion
 • First Nations People                                                                                                                            •   People & Culture
                                                                                                                                                   •   Governance & Risk Management

  PROGRESS IN 1H22

 ➢ Net Zero & Climate Transformation Program underway                     ➢ Participating in the Global Compact Network                            ➢ COVID Response Manager appointed ensuring
 ➢ Joined the CEO Climate Leaders’ Coalition and the UN                     Australia Sustainable Development Goal (SDG)                             agility in our health and wellbeing response
   Global Compact                                                           Ambition Accelerator
                                                                                                                                                   ➢ Enhanced parental leave policy established(1)
 ➢ Supporting people in vulnerable circumstances through                  ➢ New Perth office certified with a 5 star NABERS
                                                                            energy rating                                                          ➢ Culture Survey puts APA in the top quartile of global
   the Uniting Energy Support Program
                                                                                                                                                     businesses for employee engagement(2)
 ➢ Social impact studies underway for Kurri Kurri and                     ➢ Heritage e-learning package rolled out to boost
   Central Queensland hydrogen project                                      awareness and capability in built heritage, cultural                   ➢ Ongoing enhancement of modern slavery risk
                                                                            heritage and natural heritage                                            management activities
 ➢ Strategy to define our approach and outcomes for
   Community and Social Performance underway                                                                                                       ➢ Appointment of Responsible Sourcing Manager

 ➢ A new Indigenous Land Use Agreement (ILUA) in place
   for the development of a compressor site on the South
   West Queensland Pipeline, to underpin the expansion
   of the East Coast Grid

Notes:
(1) These beneficial changes were developed following a benchmarking review against our industry peers and other leading businesses
(2) The 2021 Culture Survey benchmarked APA against other global businesses on: Engagement Capital; Engagement; Discretionary effort; Intent to Stay; and Employee Inclusion

                   APA 1H22 Results Investor Presentation                                                                                                                                                    14
Financial
performance

Adam Watson
Chief Financial Officer

     APA 1H22 Results Investor Presentation   15
1H22 solid financial performance

                          $1.1 billion                                                  $859.8 million             $515.1 million
                            up 4.3%                                                       up 4.5%                    up 22.6%

                           Revenue(1)                                                Underlying EBITDA(1)         Free Cash Flow

                                                                                          25.0 cents                $1.8 billion
                        $155.6 million
                                                                                           up 4.2%
                                                                                                               Cash and undrawn debt
                      Profit after tax(2)
                                                                                   Distribution Per Security         facilities(3)

Notes:
(1) Revenue excluding pass-through, underlying EBITDA excludes significant items
(2) 1H22 profit after tax $155.6 million;1H21 loss $15.5m post significant items
(3) As at 31 Dec 2021

                   APA 1H22 Results Investor Presentation                                                                              16
1H22 Revenue – positive contributions from all operating segments

Key Drivers
•   Favourable tariff escalation given exposure to Australian and US inflation indices
•   Operating revenue growth across all segments, with particularly strong growth from the Victorian Transmission System and Diamantina Power Station
•   Higher earnings from customer contribution works in Asset Management

                                                                                              $0.0m          $2.2m         $1,117.7m
                                                                                 $9.5m

                                                                   $19.5m

                                                        $5.6m

                                      $13.6m
              $1,071.8m

            1H21 Revenue Tariff Escalation              FX rate   Operational   Asset Mgt      Energy     Other income   1H22 Revenue
            ex passthrough                                         Revenue                  Investments                  ex passthrough

               APA 1H22 Results Investor Presentation                                                                                                   17
1H22 Expenditure - operating cost discipline and investment in
capability to support long term growth
Key Drivers
• Ongoing discipline in management of Operations & Maintenance
• Higher bidding costs associated with corporate development activities
• Higher insurance premiums, and enhancements across technology, sustainability and leadership capability

                                                                                                                                                 $257.6m

                                                                                                                             $8.1m

                   $246.4m                                     ($0.1m)                                     $4.4m
                                                                                            ($1.2m)

           1H21 Underlying Opex1                 Operations &              Asset Management           Strategic Growth   Corporate costs   1H22 Underlying Opex
                                                 Maintenance                                               Projects

Notes
1. Excluding cloud SaaS costs following the IFRIC Agenda Decision published in April 2021

                              APA 1H22 Results Investor Presentation                                                                                              18
1H22 Free Cash Flow and Distributions - solid earnings growth and
benefits stemming from recent capital management initiatives

Key Drivers
                                                                                                                                                             Distribution target
• Lower tax payments and interest paid as a result of the March 2021 $2.2b debt refinance                                                                    • Payout ratio of 60-70% of Free Cash Flow(1)
• Favourable working capital management including construction capital contribution received                                                                 • Fully funds maintenance capex
• Lower Stay-In-Business (SIB) capex following completion of the Diamantina Power Station                                                                    • Supports appropriate level of funding for
  overhaul in 1H21                                                                                                                                             organic growth capex

                                                                                                                                $515.1m
                                                                                                               $5.5m                                         FY22 distributions
                                                                                            $21.3m
                                                                           $7.1m                                                                             • 1H22 interim distribution of 25.0 cps, up 4.2%
                                                         $23.5m
                                        $0.6m                                                                                                                • Payout ratio of 57.3%
                    $37.0m
 $420.0m                                                                                                                                                     • FY22 total distributions guidance of 53.0 cps, up
                                                                                                                                                               3.9%

  1H21           Underlying            Equity            Tax Paid        Interest          Working           SIB Capex            1H22
   FCF            EBITDA            Income and                           Paid (net)         Capital                               FCF
                                   Distributions                                         & Provisions
                                   received (net)

   Notes:
   (1) Free Cash Flow is Operating Cash Flow less SIB capex (SIB capex includes operational assets lifecycle replacement costs and technology lifecycle costs)

                APA 1H22 Results Investor Presentation                                                                                                                                                     19
Growing organic growth pipeline, now in excess of $1.4 billion(1)

                                                                      FY22                             FY23                       FY24

  Select major growth projects

  Northern Goldfields Interconnect                                                                            $460m

  Gruyere Hybrid Energy Microgrid                                                         $40m

  Western Outer Ring Main                                                                                       $167m

  ECG Expansion stage 1 & 2(2)                                                                                                         $270m

  Mica Creek Solar Farm                                                                                               $150m

  Kurri Kurri Pipeline(3)                                                                                                     ~$250m

 Notes:
 (1) As at 23 February 2022
 (2) East Coast Grid expansion stage 2, are subject to customer demand and final investment decision
 (3) $250m is a high level APA estimate only

                 APA 1H22 Results Investor Presentation                                                                                        20
Capital strategy complements strong investment fundamentals

                                               Strong distributions
       Stable business                                                    Enhanced investor
                                               (60% to 70% of free
       operations and solid                                               engagement and
                                               cash flow on a full year
       cash flow conversion                                               communication
                                               basis)

         High level of liquidity                                          Strong balance sheet
                                               Low cost of capital and
         reflects prudent treasury                                        enhanced by liability
                                               strong support for APA
         policy and supports                                              management exercise in
                                               credit
         growth funding                                                   March 2021

      APA 1H22 Results Investor Presentation                                                       21
APA is positively leveraged to rising inflation

          Majority of APA’s revenue is                                                              100% of drawn debt hedged
                                                                                                                                                                                                        High EBITDA margins(3)
             indexed to inflation(1)                                                               with average maturity of 7 yrs(2)

                             CPI linked revenue                                                                       Drawn debt hedged                                                                         EBITDA as % of revenue
                             Other revenue                                                                                                                                                                      Costs as % of revenue

            With the majority of our revenues linked to inflation and our drawn debt fully hedged, our high
            operating margins means the majority of the revenue benefit flows through to free cash flow

Notes:
(1) Contracts within Australia that contain inflation linked escalations typically apply a formula based on either quarterly, bi annual or annual Australian Consumer Price Index (CPI). The Wallumbilla Gladstone Pipeline contract escalates annually, on 1 January each
year, based on November US inflation. For the CY22 the increase due to US inflation will be 7.5%.
(2) As at 31 December 2021
(3) For 1H22 excluding passthrough revenue and significant items

                       APA 1H22 Results Investor Presentation                                                                                                                                                                                                                22
Capital management delivering a strong balance sheet to support
growth

                                                                                                                                                                                                                    FFO : Debt of
                                                                                                                                                                                                                    11.5% providing
                                                                                                                      BBB / Baa2 ratings with
                          $1.8b of liquidity                                                                                                                                                                        headroom to fund growth
                                                                                                                      Stable outlooks
                                                                                                                                                                                                                    and support capital
                                                                                                                                                                                                                    management1

                                                                                                                     Average cost of debt
                          No material debt
                                                                                                                     4.6% (1H21 5.2%)                                                                               Drawn debt is 100%
                          refinancing
                                                                                                                     and average maturity 7                                                                         hedged
                          obligations until FY25
                                                                                                                     years (1H21 6 years)

Notes: All figures at 31 December 2021 unless otherwise specified
1. We are in the process of amending our constitution to facilitate buy backs. Any assessment regarding the implementation of a buyback will be done with reference to our ability to create securityholder value

                       APA 1H22 Results Investor Presentation                                                                                                                                                                                 23
FY22 Financial outlook

    Distribution                                                                                                       Beneficiary of
    reconfirmed                                              FY22 distribution per                                     rising inflation                                   Rising inflation having a favourable
                                                             security 53.0 cps                                                                                            impact on earnings, with almost all
                                                             reconfirmed, a                                                                                               revenue inflation linked
                                                             3.9% increase on FY21

    Wallumbilla Gas                                                                                                   Investing to create
    Pipeline                                                 Wallumbilla Gas Pipeline                                 long term value                                     Ongoing investment in business
                                                             FX enters next phase of                                                                                      development and systems and
                                                             hedge relationship in                                                                                        processes including cloud / SaaS
                                                             March 2022(1); cash flow                                                                                     based technology solutions
                                                             impact immaterial

Notes:
(1) This is expected to result in a net reduction in revenue (and EBITDA) for 2H22 of ~$14 million (non-cash). The annualised impact to revenue (and EBITDA) from FY23 onwards is expected to ~$36 million (non cash). The impact
on operating cash flows is expected to be immaterial. The next phase of the hedge relationship concludes in late CY25

                    APA 1H22 Results Investor Presentation                                                                                                                                                                          24
Summary and
Outlook

Rob Wheals
CEO and Managing Director

    APA 1H22 Results Investor Presentation   25
Strong business fundamentals, delivering on strategy and attractive
growth opportunities to create securityholder value

           Leading energy                                      Delivering on our                              Attractive growth
      infrastructure company                                        strategy                                    opportunities

• Solid 1H22 financial performance                   • Organic pipeline in excess of $1.4billion    • Further investment in gas infrastructure to
• Improved safety performance                        • Development of Mica Creek Solar Farm           complement renewables as coal is
                                                                                                      withdrawn
• Maintained strong operational reliability          • Progressing Kurri Kurri Lateral Pipeline
                                                                                                    • Gas is essential to support high heat and
• FY22 DPS 53.0 cps reconfirmed, +3.9% on            • Acquiring 100% interest in Basslink senior
                                                                                                      hard to abate industrial users
  FY21                                                 secured debt
                                                                                                    • Ongoing investment in electricity
• Strong balance sheet with headroom to              • Pathfinder Program to deliver new energy
                                                                                                      infrastructure
  fund growth / support capital management             infrastructure solutions
                                                                                                    • Participation in Renewable Energy Zones
• Beneficiary of rising inflation                    • Progressing Net Zero 2050 ambitions with
• Diversified revenue sources across a                 interim targets communicated in 2022
  range of markets and services

       We have the strategy and capability to deliver our vision to be world class in energy solutions
            APA 1H22 Results Investor Presentation                                                                                                  26
Q&A Session

  APA 1H22 Results Investor Presentation   27
Supplementary
information

   APA 1H22 Results Investor Presentation   28
APA overview

   APA 1H22 Results Investor Presentation   29
Existing APA operational footprint diversified across a range of energy
infrastructure assets

    Assets
    Gas pipelines, processing & storage
    Gas-fired generation
    Renewables generation
    Electricity transmission

    Customers
    Servicing ~80 wholesale and
    >1.4 million network customers

    Operations
    >1,200 employee spread across more than 50
    locations in Operations & Maintenance, Engineering,
    Health, Safety & Environment and Networks
    operations

Note: Gruyere Hybrid Energy Microgrid is under construction

                   APA 1H22 Results Investor Presentation                 30
Energy Infrastructure revenue by
Low risk business model
                                                          Revenue type
                                                                                 11.7%                    Capacity charge
• Solid risk management processes in place                                 2.3%                           Regulated

• Continue to manage counterparty risks by:                               8.9%      ~87%                  Contracted fixed
                                                                                    Take or               Throughput & other variable
  • Diversification of customers and industry exposures                              pay/                 Flexible short term
                                                                                   regulated              Other
  • Assessment of counterparty creditworthiness                                                75.3%

  • Entering into stable contracted revenue to support
    major capital spend
                                                          Customer
                                                                                                          A- rated or better
                                                          credit rating     10.1%
                                                                                                          BBB to BBB+ rated
                                                                          6.0%                            Investment grade
                                                                                    ~84%         41.1%
                                                                                                          Not rated
                                                                                  Investment
                                                                                    Grade                 Sub-investment grade

                                                                             37.0%

                                                          Customer                                        Energy
                                                          industry         24.7%                          Utility
                                                                                                          Resources
                                                                                   Diverse        48.4%   Industrial & Others
                                                                                    Source of
                                                                                     revenue

                                                                             23.8%

            APA 1H22 Results Investor Presentation                                                                              31
Group Structure
Group structure
                                                                                   Australian Pipeline Trust                           APT Investment Trust
                                                                                            (APT)                                            (APTIT)

• APA Group is listed as a stapled structure on the Australian
                                                                                                              Australian Pipeline Limited
  Securities Exchange (ASX:APA)                                                                                 (Responsible Entity)

• APA is comprised of two registered managed investment schemes:
  – Australian Pipeline Trust (ARSN 091 678 778)                                  APT Pipelines Ltd                   100%

  – APT Investment Trust (ARSN 115 585 441) is a pass-through
    trust
                                                                                        Operating assets
                                                                                                                                        Passive investments
                                                                                        and investments
• Australian Pipeline Limited (ACN 091 344 704) is the responsible
  entity of APT and APTIT
• The units of APT and APTIT are stapled and must trade and
  otherwise be dealt with together
• APT Pipelines Limited (ABN 89 009 666 700), a company wholly
  owned by APT, is APA’s borrowing entity and the owner of the                                                    Tax Structure
  majority of APA’s operating assets and investments
Financial reporting segments within APT:                                                       APT                                            APTIT
                                                                                             30% tax                                          0% tax
• Energy Infrastructure: APA’s wholly or majority owned energy
  infrastructure assets
                                                                                                              ~74%*                 ~26%*

• Asset Management: provision of asset management and operating
  services for the majority of APA’s investments
                                                                                                                       APA Group
• Energy Investments: interests in energy infrastructure investments

             APA 1H22 Results Investor Presentation                    Note: *Percent of net tangible asset                                                   32
Financial Metrics

   APA 1H22 Results Investor Presentation   33
1H22 financial summary
     Results $ million                                                               1H22               1H21(1)                Change                                        Key Drivers
                                                                                                                                                  Positive contribution across all segments including Victorian
     Revenue(2)                                                                    1,117.7              1,071.8                  4.3%             Transmission System, Diamantina Power Station and Asset
                                                                                                                                                  Management
                                                                                                                                                  Positive contribution across all operating segments partly offset
     Underlying EBITDA(3)                                                            859.8               822.8                   4.5%
                                                                                                                                                  by increased investments in capability and strategic projects
                                                                                                                                                  Includes Darling Downs Solar Farm fair value adjustment and IT
     Fair value and other adjustments                                                 5.5                 11.9                 (53.4%)
                                                                                                                                                  Cloud (SaaS) costs
     Total reported EBITDA(3)                                                        865.3               834.7                   3.7%
                                                                                                                                                  Larger depreciable asset base and changes to useful life for
     Depreciation and amortisation                                                  (371.2)             (330.9)                 12.2%
                                                                                                                                                  certain assets
     Total reported EBIT(3)                                                          494.1               503.8                  (1.9%)
                                                                                                                                                  Lower average interest costs due to liability management
     Net interest expense                                                           (239.2)             (246.9)                 (3.1%)
                                                                                                                                                  exercise completed March 2021
     Profit before tax excluding significant items                                   254.9               256.9                  (0.8%)
     Income tax expense(3)                                                          (99.3)               (97.9)                  1.4%
     Profit after tax excluding significant items                                    155.6               159.0                  (2.2%)
     Significant items after tax(4)                                                     -               (174.5)                 (100%)            Orbost impairment in 1H21
     Profit after tax including significant items                                    155.6               (15.5)               1,104.8%
     Free Cash Flow(5)                                                               515.1               420.0                  22.6%             Higher EBITDA, lower interest costs and lower tax payments
     Distribution per security (cents)                                               25.0                 24.0                   4.2%             Payout ratio 57.3% of FCF
1)    1H21 is restated as a result of a change in the APA Group's accounting policy following the IFRIC Agenda Decision published in April 2021 related to accounting for SaaS arrangements
2)    Excludes pass-through revenue on which no margin is earned
3)    Excluding significant items
4)    $249.3m non-cash pre-tax impairment in relation to Orbost Gas Processing plant
5)    Free Cash Flow is Operating Cash Flow less stay-in-business (SIB) capex. SIB capex includes operational assets lifecycle replacement costs and technology lifecycle costs

                     APA 1H22 Results Investor Presentation                                                                                                                                                      34
Underlying EBITDA by segment

$ million                                                                  1H22                     1H21(1)                 Change                                               Key drivers

                                                                                                                                                   Increased contribution from Orbost and higher gas volumes in
  East Coast                                                               341.9                    326.8                     4.6%
                                                                                                                                                   Victoria

  West Coast                                                               137.1                    135.8                     1.0%                 Contributions from newly commissioned laterals

                                                                                                                                                   US CPI tariff impact and favourable foreign exchange hedge
  Wallumbilla Gladstone Pipeline                                           278.8                    270.0                     3.3%
                                                                                                                                                   rates

                                                                                                                                                   Higher generation at Diamantina Power Station and improved
  Power Generation                                                          99.8                     86.2                    15.8%
                                                                                                                                                   returns from Badgingarra renewables site

  Energy Infrastructure total                                              857.6                    818.8                     4.7%

  Asset Management                                                          41.7                     31.0                    34.5%                 Customer contribution projects from NSW, VIC, NT and WA

  Energy Investments                                                        16.2                     16.2                    (0.0%)

  Corporate costs                                                          (55.6)                    (43.1)                  29.0%                 Investment in capability and strategic growth

  Total underlying EBITDA                                                  859.8                    822.8                     4.5%

Notes: Numbers in the table may not add up due to rounding
1) 1H21 is restated as a result of change in the APA Group's accounting policy following the IFRIC Agenda Decision published in April 2021 related to accounting for SaaS arrangements

                    APA 1H22 Results Investor Presentation                                                                                                                                                      35
1H22 underlying EBITDA up 4.5% to $860 million
Key Drivers
•   Favourable tariff escalation given exposure to Australian and US inflation indices
•   Operating revenue growth across all segments, with particularly strong growth from the Victorian Transmission System and Diamantina Power Station
•   Asset Management benefited from third-party projects in NSW, Victoria, Northern Territory and Western Australia
•   Ongoing discipline in management of Operations & Maintenance
•   Higher bidding costs associated with corporate development activities
•   Higher insurance premiums, and enhancements across technology, sustainability and leadership capability

                                                                                               $0.0m          $0.1m                       $859.8m
                                                                     $19.5m       $10.7m                                   ($12.5m)
       $822.8m                                          $5.6m
                            $13.6m

     1H Underlying           Tariff                      FX rate   Operational   Asset Mgt     Energy     Operations and   Corporate   1H22 Underlying
        EBITDA            escalation                   - revenue    Revenue                  Investment    maintenance       costs        EBITDA
                           -revenue                                                                           costs

              APA 1H22 Results Investor Presentation                                                                                                     36
1H22 capital expenditure
$ Million                                                                 1H22             1H21(1)

Growth Capex
                                                                                                                                Key drivers:
  Regulated                                                                 34.7               21.3
                                                                                                                                Major growth capex projects:
  Non-Regulated
                                                                                                                                •   East Coast Expansion – Stage 1
    East Coast Gas                                                          57.5               58.1
                                                                                                                                •   Orbost Phase 2b upgrades
    West Coast Gas                                                          76.3               33.7                             •   Kurri Kurri Lateral
    Power Generation                                                        27.0               31.9                             •   Northern Goldfields Interconnect
                                                                                                                                •   Gruyere Hybrid Energy Microgrid
    Other                                                                   23.2                 9.3
                                                                                                                                •   Mica Creek Solar Farm – Stage 1
Total growth capex
                                                                                                                                •   Basslink Senior Secured Debt acquired (face value
  Stay-In-Business (SIB) capex                                              69.7               83.1                                 $99m)2

  IT capex                                                                  18.1               10.2                             Major stay-in-business Capex:
  Corporate Real Estate                                                       7.9                   -                           •   Diamantina Power Station
                                                                                                                                •   Moomba Sydney gas pipeline
Total capital expenditure                                                 314.4              247.5

  Payment for Financial Assets                                              88.8                    -

Total capital & investment expenditure                                    403.3              247.5
Notes:
1) 1H21 is restated as a result of a change in the APA Group's accounting policy following the IFRIC Agenda Decision published in April 2021 related to accounting for SaaS arrangements
2) Basslink ASX Announcement on 22 November 2021

                    APA 1H22 Results Investor Presentation                                                                                                                                 37
5 year normalised financials
Financial Performance                                                                                                   1H22                 1H21                 FY21             FY20(1)               FY19(1)              FY18(1)                  FY17
Revenue                                                                                              $m              1,384.4              1,295.0              2,605.3             2,590.6               2,452.2              2,386.7               2,326.4
Revenue excluding pass-through(2)                                                                    $m              1,117.7              1,071.8              2,144.5             2,129.5               2,031.0              1,941.4               1,888.3
Underlying EBITDA(3)                                                                                 $m                859.8                822.8              1,633.0             1,653.9               1,573.8              1,518.5               1,470.1
Total reported EBITDA(3)                                                                             $m                865.3                834.7              1,643.0             1,656.0               1,569.0              1,518.0               1,470.1
Depreciation and amortisation expenses                                                               $m             (371.2)               (330.9)              (674.4)              (650.8)               (611.3)              (578.9)             (570.0)
Reported EBIT(3)                                                                                     $m                494.1                503.8                968.7             1,005.2                  957.7                939.1                 900.1
Net interest expense                                                                                 $m              (239.2)              (246.9)              (504.8)              (507.8)               (497.4)              (509.7)              ( 513.8)
Income tax expense                                                                                   $m                (99.3)               (23.2)               (62.9)             (185.6)               (175.6)              (164.9)               (149.5)
Profit/(loss) after tax including significant item                                                   $m                155.6                (15.5)                  3.7               311.8                 284.7                264.5                 236.8
Significant items – after income tax                                                                 $m                     -             (174.5)              (278.1)                    -                     -                    -                     -
Profit after tax excluding significant item                                                          $m                155.6                159.0                281.8                311.8                 284.7                264.5                 236.8
Financial Position
Total assets                                                                                         $m            14,665.9               15,199.7               14,742.9              15,994.3            15,429.2           15,226.7            15,045.9
Total drawn debt(4)                                                                                  $m             9,667.0                9,684.4                9,665.7               9,983.6             9,352.1            8,810.4             9,249.7
Total equity                                                                                         $m             2,815.8                3,269.7                2,969.2               3,214.9             3,596.1            4,126.5             3,978.2
Cash Flow
Free cash flow(5)                                                                                   $m                 515.1                  420.0                   901.9                 956.6               893.7              919.0               905.1
Operating cash flow(6)                                                                              $m                 602.9                  513.3                1,051.0              1,087.5             1,007.3             1,031.1               973.9
Key Financial Ratios
Earnings/(loss) per security including significant items(7)                                      cents                  13.2                   (1.3)                  0.3                  26.4                24.1                23.3                21.2
Free cash flow per security(7)                                                                   cents                  43.7                   35.6                  76.4                  81.1                75.7                80.8                80.9
Distribution per security                                                                        cents                  25.0                   24.0                  51.0                  50.0                47.0                45.0                43.5
Funds From Operations to Net Debt                                                                   %                   11.5                   11.8                  11.3                  12.1                10.8                10.8                10.8
Funds From Operations to Interest                                                               Times                    3.3                     3.2                  3.1                   3.3                 3.0                 3.0                 3.0
Weighted average number of securities(7)                                                            M                1,179.9                1,179.9               1,179.9               1,179.9             1,179.9             1,136.9             1,118.5
(1) Restated as a result of change in the APA Group's accounting policy following the IFRIC Agenda Decision published in April 2021 related to accounting for SaaS arrangements.
(2) Pass-through revenue is revenue on which no margin is earned
(3) Excludes significant items
(4) APA’s liability to repay debt at relevant due dates of the drawn facilities. This amount represents current and non-current borrowings as per balance sheet and is adjusted for deferred borrowing costs, the effect of unwinding of discount, unrealised foreign exchange
    differences reported in equity and deducting other financial liabilities that are reported as part of borrowings in the balance sheet
(5) Free cash flow is operating cash flow less SIB capex (SIB capex includes operational assets lifecycle replacement costs and technology lifecycle costs)
(6) Operating cash flow = net cash from operations after interest and tax payments
(7) On 23 March 2018, APA Group issued 65,586,479 new ordinary securities, resulting in total securities on issue of 1,179,893,848. The weighted average numbers of securities from FY2016 to FY2018 have been adjusted to account for that rights issue

                     APA 1H22 Results Investor Presentation                                                                                                                                                                                                      38
Historical underlying EBITDA by asset – Energy Infrastructure
  $ millions                                                 1H22    1H21      FY21      FY20      FY19      FY18      FY17
 East Coast Grid
   Wallumbilla Gladstone Pipeline                           278.8   270.0    549.7     538.9     542.4     515.9     488.0
   South West Queensland Pipeline                           120.9   118.0    232.8     254.4     250.0     244.3     242.4
   Moomba Sydney Pipeline (1)                                76.5    83.6    151.5     160.8     149.4     147.1     149.5
   Victorian Systems                                         84.1    58.4    113.4     101.9     114.0     124.6     123.0
   Roma Brisbane Pipeline                                    22.7    27.1     51.5      56.9      58.4      60.9      58.6
   Carpentaria Gas Pipeline                                  14.0    15.2     29.0      29.5      36.8      39.0      35.6
   Other Qld assets                                          13.7    11.9     24.2      23.1      20.7      14.0      13.5
 East Coast Grid Total                                      610.8   584.1   1,152.0   1,165.5   1,171.5   1,145.7   1,110.5
 Northern Territory
   Amadeus Gas Pipeline                                       8.7    11.4     22.7      19.9      19.2      22.9      18.8
 Western Australia
   Goldfields Gas Pipeline                                   77.6    76.1    155.1     149.9     125.2     111.8     111.5
   Eastern Goldfields Pipeline                               26.6    26.6     50.7      51.0      45.6      37.7      36.3
   Mondarra Gas Storage and Processing Facility              18.3    18.6     36.9      36.1      33.8      32.8      33.6
   Pilbara Pipeline System                                   13.3    12.9     25.7      27.6      28.2      27.8      27.5
   Other WA assets                                            1.2     1.7       2.4       7.0       3.6       4.0       3.4
 South Australia
   SESA Pipeline and other SA assets                          1.2     1.2       2.4       2.3       2.1       2.6       2.3
 Power Generation
   Diamantina Power Station                                  58.5    45.6     94.3      89.4      90.9      88.3      87.4
   Badgingarra Wind and Solar Farms                          18.5    16.2     32.1      33.5      14.7        0.0       0.0
   Emu Downs Wind and Solar Farms                            13.0    12.9     26.7      24.8      23.2      23.6      22.4
   Darling Downs Solar Farm                                   5.4     7.7     13.6      15.7      11.0        0.0       0.0
   Gruyere Power Station                                      4.4     3.8       7.9       7.2       3.5       0.0       0.0
 Grand Total                                                857.6   818.8   1,622.6   1,629.8   1,572.4   1,497.1   1,453.7
Notes: EBITDA excludes significant items
(1) Includes other NSW pipelines

                   APA 1H22 Results Investor Presentation                                                                     39
Debt maturity profile
APA maintains diversity of funding sources and spread of maturities

                                                                                                                                                                    Undrawn committed facilities

                                                      536
                                                                                                                                                                    AUD AUD DCM bonds(2)
                                                                                                                                                                    USD DCM bonds(3)

                                                      1,396 (USD 1,100)

                                                                                                                         1,140 (USD 886)
                                                                                  879 (USD 683)

                                                                                                   1,104

                                                                                                                                            1,018
                                                                                                            925
                                     500

                                                                                                                                                              770
                                                                                                                                                       738

                                                                                                                                                                                       379 (USD 300)
                    650

                                                                                                                                                                                                        450
                                     200
      50

                                                                           50

                                                                                                                                                                         133
    FY22          FY23             FY24            FY25                   FY26   FY27             FY28     FY29        FY30                FY31       FY32   FY33       FY34        FY35               FY36
Notes:
1) APA debt maturity profile as at 31 December 2021
2) AUD denominated obligations debt capital market (DCM) notes
3) USD denominated obligations translated to AUD at the prevailing rate at inception (USD144A - AUD/USD=0.7879, Euro and Sterling - AUD/USD=0.7772)

                   APA 1H22 Results Investor Presentation                                                                                                                                                     40
Energy market
dynamics and
overview

   APA 1H22 Results Investor Presentation   41
Australian gas market supply source transformation

                AEMO forecast suggest shortfall in Eastern                                                                                  New Supply required to meet peak southern
                Australia gas production vs demand                                                                                          demand

   2,000 PJ                                                                                                                                              2,116 PJ                                            1,943 PJ
                                                                                            Forecast
                                                                                            demand                           Northern production          17.2%
   1,500 PJ

                                                                                                                                             storage      16.3%
                                                                                                                                                                                          Supply Gap(1) 62.4%
   1,000 PJ                                                                                                                                     Other      7.6%

                                                                                                                                            Moomba        13.4%

                                                                                                                               Production
                                                                                                                               Southern
     500 PJ

                                                                                                                                                                                 Northern production 20.8%
         0 PJ                                                                                                                               Longford      45.4%
                2021

                            2023

                                      2025

                                               2027

                                                         2029

                                                                2031

                                                                       2033

                                                                              2035

                                                                                     2037

                                                                                               2039                                                                              Southern production 16.8%

                       Developed                 Committed             Anticipated           LNG imports                                                  Jul-20                                              Jul-35

Source: Gas Statement of Opportunities 2021, AEMO, gas production includes export LNG, Central scenario, existing, committed, and anticipated developments, 2021-40 (PJ), Figure 25 - Observed gas supply used to meet peak
southern demand in 2020 and Figure 31 - Forecast gas supply relative to southern daily demand, Central scenario, 2035 (TJ/d)
Note: (1) includes demands that could be met with LNG receipts

                       APA 1H22 Results Investor Presentation                                                                                                                                                                 42
Electricity market transition

                                AEMO Integrated System Plan 2020                                                                           State based support for continued
                                                                                                                                           renewables investment

                          50 GW

                          40 GW                                                                                  Solar               NSW (2)1
                                                                                                                                   Category          19%               Halving of emissions
    Generation Capacity

                          30 GW                                                                                                    Category
                                                                                                                                       QLD 2         14%                   50%
                                                                                                                 Wind
                          20 GW
                                                                                                                                   Category
                                                                                                                                       VIC 3           25%                 50%
                          10 GW
                                                                                                                 Dispatchable(1)
                                                                                                                                   Category
                                                                                                                                       SA 4                   55%                             100%
                           0 GW
                                                                                                                 Coal                 TASTAS
                                                                                                                                          (3)                        98%
                          -10 GW

                          -20 GW                                                                                                                0%                   50%                 100%
                                   2022
                                          2024
                                                 2026
                                                        2028
                                                               2030
                                                                       2032
                                                                              2034
                                                                                     2036
                                                                                            2038
                                                                                                   2040
                                                                                                          2042

                                                                                                                                            FY20 renewables                 2030 state based
                                                                                                                                            electricity generation          renewables generation
                                                                                                                                            percentage                      target

 Source: AEMO Integrated System Plan, 2020 central scenario; Australian Energy Statistic update 2021 Table O Electricity generation, by fuel type, by state
 Notes: 1) Dispatchable generation includes utility-scale pumped hydro, gas-powered generation and battery storage
        2) NSW has a generation target of halving emissions by 2030 https://www.nsw.gov.au/media-releases/nsw-set-to-halve-emissions-by-2030
        3) Tasmania has a renewable generation target of 200% to 2040

                              APA 1H22 Results Investor Presentation                                                                                                                                 43
Regulation of Australian gas pipelines

    APA pipelines by regulation type             • In 1H22, 8.9% of Energy Infrastructure revenue was from full regulated assets

                                                 • Gas pipelines are regulated by the Australian Energy Regulator (AER) or, the Economic
                                                   Regulation Authority of Western Australia (ERA)

                                                 • Australia’s economic regulatory regime for gas pipelines is set out in the National Gas Law
                                                   (NGL) and the National Gas Rules (NGR). Some of APA’s pipelines have been covered by the
                                                   National Gas Access Regime since it was introduced in the 1990’s.

                                                 • There are currently two frameworks under the NGR:

                                                     1) Scheme pipelines (NGR Parts 8-12) are subject to either:

                                                        - full regulation, where the AER or ERA must approve a full access arrangement that
                                                          sets out reference tariffs, terms and conditions in a negotiate-arbitrate framework.
                                                          Pipeline users can opt for non-regulated services on full regulation pipelines; or

                                                        - light regulation, where pipeline owners must publish services and prices and comply
                                                          with information provision requirements to support negotiations or alternatively seek
         Full regulation pipelines
                                                          regulatory approval for a limited access arrangement. A regulatory negotiate-arbitrate
         Light regulation pipelines
                                                          mechanism is available in the case of access disputes.
         Non-scheme pipelines

         Partly full regulation/                     2) Non-Scheme pipelines (NGR Part 23) – The Part 23 regime came into effect from August
         non-scheme pipelines
                                                        2017 and provides for tariffs and terms to be negotiated, supported by additional
                                                        information disclosure and a commercial arbitration mechanism in the event of a dispute.

        APA 1H22 Results Investor Presentation                                                                                             44
Regulation of Australian gas pipelines (continued)

Schedule of                    Current regulatory period       2022             2023              2024              2025             2026
regulatory reset
dates for APA                  Roma Brisbane Pipeline
                               Victorian Transmission System
                               Goldfields Gas Pipeline
                               Amadeus Gas Pipeline

Access                   • Apply for a term, generally 5 years
arrangement              • Set out the terms and conditions of third party access, including
                             • At least one reference service that is commonly sought by customers – for pipelines, this is generally firm forward-haulage
                                services
                             • A reference (benchmark) tariff for the reference service
Reference tariff         • Provides a default tariff for customers seeking the reference service but tariffs can also be negotiated for other services
                         • Determined with reference to regulated revenue, capacity and volume forecasts
Regulated                • Determined using the building block approach to recover efficient costs including:
revenue                      • Forecast operating and maintenance costs
                             • Regulatory asset depreciation and
                             • Return on value of regulated assets (regulated asset base) based on WACC determination
                             • Return is now a binding (defined methodology) rate of return as at Dec 2018 for the next 4 years
                         • WACC based on 60:40 debt equity split
Regulated asset          • Opening RABs have been settled with the regulator; there are no reassessments for approved RABs
base (RAB)               • RABs adjusted every access arrangement period
                             • Increased by capital invested into the asset and reduced by regulatory depreciation costs

            APA 1H22 Results Investor Presentation                                                                                                           45
For further information

Kynwynn Strong
General Manager, Investor Relations

M: M +61 410 481 383
E: kynwynn.strong@apa.com.au
www.apa.com.au
You can also read