SERAPHIM SPACETECH VENTURE CAPITAL INDEX
←
→
Page content transcription
If your browser does not render page correctly, please read the page content below

Q12021

Seraphim SpaceTech
Venture Capital Index

Welcome

A
         s was anticipated in last quarter’s report, 2021       Within the private capital markets, Q1 21 was another
         has seen SpaceTech become one of the hottest           strong quarter, continuing the positive momentum of
         markets for the current SPAC merger bonanza.           recent quarters. With both private and public market
As at the time of writing, 11 space-related companies           investors now committing record levels of investment
have already announced their SPAC mergers. Collectively,        to space businesses, the sector is now at a major
these companies are set to attract more than $7bn of            watershed moment. An understanding of - and belief
equity funding as and when they complete their planned          in - the transformative potential of SpaceTech is
SPAC mergers.                                                   now becoming accepted within the wider investment
                                                                community.
In the context of 2020 having seen a total of $7.7bn of
private capital invested across the entire SpaceTech            This may well provide to be the moment that one of the
industry, the newly developed appetite by public market         major impediments to the sector delivering on its $trillion
investors for space companies represents a major                potential – namely access to risk capital – has inexorably
paradigm shift for the wider SpaceTech ecosystem.               shifted.

Whilst it remains unclear how long the current favourable
public market conditions will persist, the play book has
now been set for emerging category leaders to look to
SPACs as a means of accelerating their ability to access          Mark                James            Josephine          Lewis Jones
                                                                 Boggett             Bruegger           Millward          Investment
the capital required to realise their visions.                     CEO                  CIO         Head of Research        Analyst

Highlights                                                      COVID-19 Impact:
                                                                Year to Q1 21 vs. Q1 20 (% Change)
$8.7bn
invested in last 12 months                                      		Build

$2.7bn
invested in Q1 ($2.6bn in Q4 20)
                                                                         Launch

                                                                            DATA

                                                                     Downlink

68
deals closed in Q1 (highest since Q1 18)
                                                                		Analyse

                                                                		Product

264
record level of Seraphim Index
                                                                Beyond Earth

                                                                		Drones

$850m
biggest deal closed in Q1 (SpaceX)
                                                                       -100%      0%      100% 200% 300% 400% 500%

                                                                Investment in the 12 months to Q1 21 was 95% higher than in the

$46m
average deal size in Q1 21 (vs. $50m Q4 20)
                                                                preceding 12 months prior to the COVID-19 pandemic hitting. A near

                                                                doubling in investment levels in the face of a global economic crisis

                                                                is remarkable. The Launch, Data and Downlink categories all saw

11
space-related SPAC mergers announced
                                                                more than 150% annual growth, whilst Beyond Earth increased by an

                                                                astonishing 438%, albeit from a very low base of less than $50m.

$7.2bn
                                                                Having so far largely weathered the worst of the impact of the

                                                                downturn, the New Space economy is now primed for further strong
funding committed to these SPAC mergers                         growth in 2021 and beyond.

                                                            2
Q1 2021 Deals
Q1 2021 saw a modest increase in deal
volumes with a total of 68 deals closed
Early
Stage versus 62 in Q4 2020. This is the highest level
of activity since Q1 18.
Early
Stage
Early Upstream (dark blue) once gain accounted
Stage Downlink
for nearly 2/3rds of all deals (65% vs. 63% in
the previous quarter).
Analyse
Data
Early stage transactions (seed through to
Late
Stage Downstream
Series B) continued to dominate, accounting
for 85% of all deals.
Late
Stage
The Data category – relating to satellite
Upstream
Product and drone-based platforms collecting and
communicating data from above – saw a
Early
Stage notable increase in investment activities,
Launch with a total of 19 deals closed versus 12 in
Beyond the previous quarter.
Earth
Early
Build Stage
With deals involving early stage satellite
Early
Stage constellations driving this growth, investors
eg
ta
continue to demonstrate their belief in
S
Late
te
Early the long term prospects for these nascent
Stage
La
Stage
satellite operators.
Q1 2021 Top Deals that are the most notable beneficiaries of investor support.
Q1 21 continued in a similar vein to the prior quarter in terms of the Between them, the twin ‘mega constellations’ of SpaceX and
number of ‘mega rounds’ of more than $50m. Once again, smallsat OneWeb closed a total of $1.25 billion. After several quarters notable
launchers (ABL Space Systems), drones (Skydio, XAG) and flying for having very sizeable funding rounds for Chinese companies,
taxis (Volocopter) all feature in the list of the quarter’s largest this quarter has seen US businesses re-assert their dominance,
deals. However, as with recent quarters, it is satellite constellations accounting for 7 of the 10 largest deals closed.
Company Country Data Lifecycle Sub Category Stage Amount
SpaceX US Data Satcoms Growth $850m
OneWeb UK Data Satcoms Growth $400m
Volocopter Germany Launch Flight & Delivery Series D $241m
Skydio US Data Drones & UAVs Series D $170m
ABL Space Systems US Launch Rockets Series B $170m
Axiom Space US Beyond Earth Space Logistics Series B $130m
Tomorrow.io US Data Satellites -Earth Observation Series D $77m
Omnispace US Data Satellites -IoT Series B $61m
Swift Navigation US Product Data Platforms Series C $50m
XAG China Data Drones & UAVs Series E $46m
3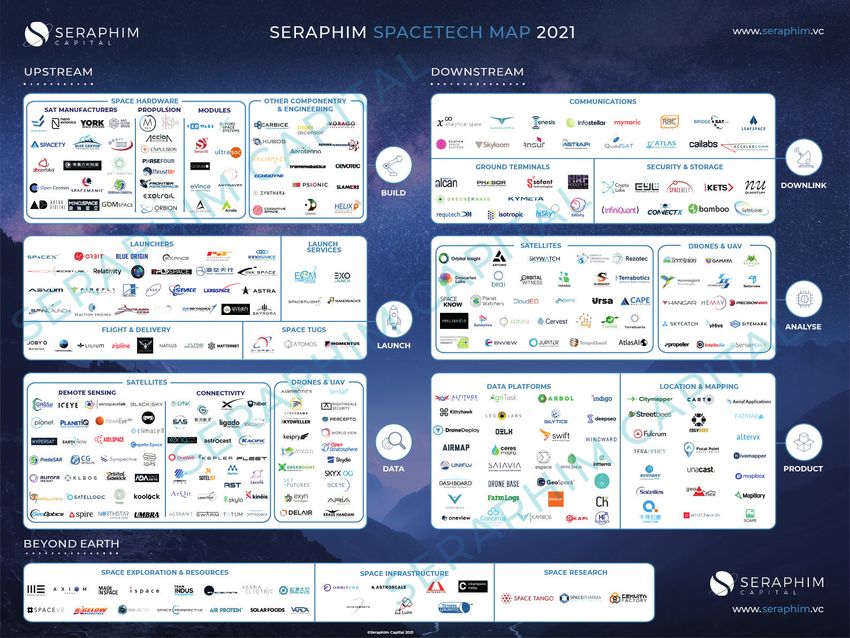
Overall Investment Activity

Seraphim Trailing 12 Months Investment Activity Index (Q1 2018 = 100)
      275
   250
      225                            $ bn
   200                               # Deals
      175
      150
      125
      100
       75
              Q1 18     Q2 18      Q3 18      Q4 18      Q1 19        Q2 19       Q3 19     Q4 19      Q1 20      Q2 20       Q3 20      Q4 20        Q1 21

The Seraphim Space Index is a barometer of investment activity,                    Deal volume remain broadly flat, both on the previous quarter and

showing the global volume and value of venture capital deals within the            across the index as a whole. This is indicative of the growth in the deal

Space sector on a 12 month trailing basis, indexed against Q1 2018.                value index continuing to be in large part driven by a fairly small number

                                                                                   of large financing rounds for growth stage companies.

Q1 2021 continued the positive growth trajectory of the last two

quarters, with the deal value index increasing another 30 points to hit            With the Q1 21 index yet to reflect the impact of the slew of pre-IPO

a new record high of 264 points (up 13% on previous quarter).                      funding rounds related to the SPAC mergers announced in recent

                                                                                   months, we expect continued strong growth in the index over

                                                                                   forthcoming quarters.

Seraphim Quarterly                                                                 Seraphim Annual
Investment Tracker ($bn Invested)                                                  Investment Tracker ($bn Invested)
  3                                                                    10           8                                                               2020
                  Quarterly Investment                                 9
                  12 Month Trailing                                    8
                                                                                    6
                                                                       7
  2
                                                                       6                                                                            2019
                                                                       5            4
                                                                                                                                                    2018
                                                                       4
  1                                                                                                                                                 2017
                                                                       3
                                                                                    2
                                                                       2
                                                                       1
 0                                                                     0            0
        Q1 Q2 Q3 Q4 Q1 Q2 Q3 Q4 Q1 Q2 Q3 Q4 Q1                                              Q1               Q2                Q3                Q4
        18 18 18 18 19 19 19 19 20 20 20 20 21

Investment in Q1 2021 was flat relative to the previous quarter, but up            2021 already looks set to be another record year of investment with

61% on Q1 2020. This now marks the third consecutive quarter where                 $2.7bn closed in Q1 vs. $1.6bn in Q1 2020. With investment levels in Q2

total investment has been above $2.5bn. Thanks to this, investment                 20 having been adversely affected by the COVID crisis, we expect the

levels over the trailing 12 months, breached the $8bn threshold for the            first half of 2021 to be more than double that of H1 2020.

first time.

                                                                              4
Seraphim Data Lifecyle
                               ■ Drones              ■ Beyond Earth        ■ Product           ■ Analyse
                               ■ Downlink            ■ Data                ■ Launch            ■ Build

Annual Investment ($bn)                                                   Last 12 Months Investment ($bn)
  8                                                                        10
                                                                            9
  7
                                                                            8
  6
                                                                            7
  5                                                                         6

  4                                                                         5
                                                                            4
  3
                                                                            3
  2
                                                                            2
   1                                                                         1
  0                                                                         0
        2017         2018          2019       2020         2021                      Q1 2018        Q1 2019        Q1 2020         Q1 2021
                                                           YTD

The Data category (which includes constellations) continued to            Investment measured over the preceding 12 months was up nearly

account for more than 50% of total deal value in Q1 21, continuing        100% year-on-year. The Launch, Data, Downlink and Beyond Earth

the trend from H2 20. Elsewhere, the Launch category saw a                categories all saw more than 100% annual growth. As with the

substantial quarter-on-quarter decline, with the Downlink - and in        previous quarter, the Analyse and Product categories were the only

particular the Drone - categories showing strong growth from the          ones to see notable declines on the previous year, both being down

previous quarter.                                                         c.50%.

Number of Deals                                                           Average Deal Size ($m)
100%                                                                        180

                                                                            160
 80%                                                                        140

                                                                            120
 60%
                                                                            100

                                                                             80
 40%
                                                                             60

 20%                                                                         40

                                                                             20
  0%                                                                             0
             2017       2018       2019     2020       2021                          2017        2018       2019        2020        2021
                                                       YTD                                                                          YTD

The mix of the volume of deals closed in Q1 2021 remained broadly         Average deal sizes in the most capital-intensive categories – namely

consistent with that seen over the course of the preceding two            Launch and Data – showed some declines from the 2020 averages.

years, with the Data and Product categories accounting for the            Given these were bolstered by a limited number of very large outlier

greatest number of transactions.                                          transactions, we do not read too much into this trend for the time

                                                                          being. In particular, we would expect the Launch category figures

                                                                          to bounce back in subsequent quarters given some of the sizeable

                                                                          transactions that have been announced but are yet to actually close.

                                                                      5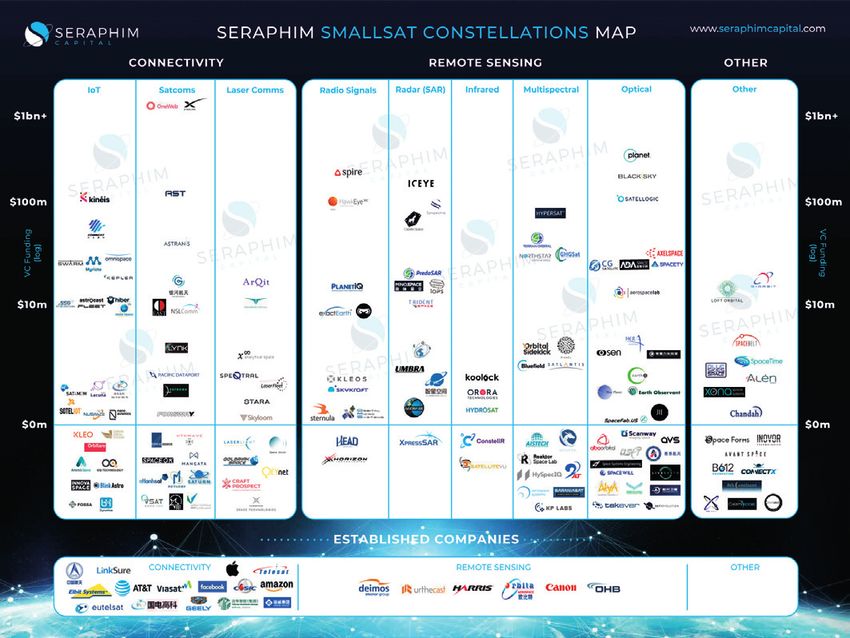
Geographic Analysis

No. Deals Last 12 Months Investment                                           Investment By Region ($)

140                                                                             5

120                                                                                       ■   North America
                                                                                4         ■   Europe
                                                       ■   Q1   18                        ■   Asia
100
                                                       ■   Q1   19                        ■   RoW
 80                                                    ■   Q1   20              3
                                                       ■   Q1   21
 60                                                                             2
 40
                                                                                 1
 20

  0                                                                             0
             North         Europe         Asia          RoW                              2017         2018        2019        2020         2021
            America                                                                                                                        YTD
With overall deal volumes having been broadly flat over the last four         North American continues to dominant in terms of amounts

years, it is little surprise that there has been only limited variation       invested, accounting for 66% of total investment in Q1 21. Following

on a regional basis. Deal numbers have been remarkably consistent             two very strong quarters powered by large transactions for Chinese

in North America and Europe in recent years, with only Asia                   rocket launcher and constellations, Asia dropped back considerably

exhibiting consistent modest growth.                                          in Q1. We believe this is a temporary blip as we anticipate further

                                                                              very large financing rounds for Chinese companies.

Average Deal Size By Region ($m)                                              US vs. RoW Investment Activity (LTM)
   70                                                                         # Deals                                              Investment ($bn)
                            N. America
   60                                                                          140                                                                      5
                            Europe
                            Asia                                               120
   50                                                                                                                                                   4
                                                                              100
   40
                                                                                                                                                        3
                                                                                80
   30
                                                                                60                                                                      2
   20
                                                                                40
                                                                                                                                                        1
    10
                                                                                20

      0                                                                          0                                                                      0
                2017       2018      2019       2020        2021                                 2018        2019       2020      2021 YTD
                                                            YTD                            ■ RoW Deals                    RoW Investment
                                                                                           ■ US Deals                     US Investment

Europe continued to close the gap on North America in terms of                Q1 21 saw an even distribution of deals between the US and RoW, albeit

average deal sizes, albeit this was impacted by outlier transactions          the US continued to account for the lion’s share of dollars invested,

such as those for OneWeb. The limited amounts of activity in Asia             capturing 66% of total investment during the quarter. The ready

in Q1 resulted in a steep decline in average deal sizes too. Given we         availability of risk capital – and in particular growth capital – continues

anticipate seeing the return of large Chinese transactions in the             to be a major advantage for US-based start-ups. As a by-product of a

near future, we would expect Asia to close the gap on Europe and              funding ecosystem that has matured over multiple decades, we expect

North America over forthcoming quarters.                                      this dynamic to persist.

                                                                          6
Investment Stage
Deals in Q1 2021 No. Deals YTD (Q1 21)
Investment ($bn) # Deals 40
2.0 35
35
■ $ Investment
30 Q1 18
# Deals 30 ■
1.5 ■ Q1 19
25 25 ■ Q1 20
■ Q1 21
20 20
1.0
15 15
10 10
0.5
5 5
0 0 0
Seed Series Series Series Series Seed Series Series Series Series
A B C D+ A B C D+
This distribution of deals by stage in Q1 21 was consistent with the Deal volumes by stage in Q1 21 surpassed those for the equivalent
previous quarter, with Series B (14 deals vs.9 in prior quarter) the period in 2019 and 2020, but still fell some way short of 2018 levels
only notable change. Whereas early stage (seed to B round) deals for Seed and Series A. Seed (31 deals vs. 25 in Q1 20) and Series D+
accounted for c.85% of all deals, later stage (C round and above) (7 vs. 4) saw the biggest increases on the prior year.
accounted for more than 70% of total amounts invested.
Average Deal Size ($m) $ Invested By Stage ($bn)
350 100%
300 ■ Series D+
■ Series C 80%
250 ■ Series B ■ Series D+
■ Series A ■ Series C
■ Seed 60% ■ Series B
200
■ Series A
■ Seed
150
40%
100
20%
50
0 0%
2017 2018 2019 2020 2021 2017 2018 2019 2020 2021
YTD YTD
The average size of growth stage rounds (Series D+) closed in Q1 The impact of both SpaceX and OneWeb announcing major new
remained consistent with recent quarters. Series C deal sizes funding rounds during the quarter has been to push the proportion of
dropped very considerably, but with only 3 such deals closing during overall investment deployed into growth stage rounds to new highs.
the period it would be premature to draw any conclusions at this Series D+ funding rounds accounted for more than 2/3rds of total
stage. Alongside the growth in B round deals closed, average deal capital invested in the quarter. We expect large funding rounds for
sizes also increased significantly too. category leaders will continue to drive up overall investment levels.
7SPAC Activity
Public Market SpaceTech Deals Investment By Region ($)
Investment ($bn) # Deals
8 12 100%
7 ■ $ raised ■ Other
# companies 10 80% ■ Flying Taxis
6 ■ Constellations
8 ■ Launchers
5 60%
4 6
3 40%
4
2
2 20%
1
0 0 0%
2016 2017 2018 2019 2020 2021 Number Amount
YTD
2021 has already seen a marked shift in public market investors’ Of the 11 announced Space-related SPACs that are expected to
appetite for SpaceTech companies. Prior to 2021, 6 New Space close within the next c.1 quarter, Flying Taxis – which will rely on
companies had gone public, raising a combined $0.8bn. Only one of Space-based connectivity and navigation to operate autonomously
these companies – Virgin Galactic - went public via a SPAC merger. – represent the biggest category both in terms of number (4) and
Already in 2021, 11 Space-related businesses have announced SPAC investment ($3.9bn). We anticipate satellite constellation and launcher
mergers, representing more than $7bn of investment. companies will continue to attract interest from the SPAC market.
2021 Announced Space SPAC Deals
complete their own transactions by the middle of the year. We
US companies dominate the list of announced SPAC-related SPACs. expect several more Space businesses to announce further SPAC
There is a fairly even split between Nasdaq (6) and NYSE (5) listed mergers during the course of the next quarter, alongside the launch
SPACs. To date, only one of these companies – AST&Science – of several SPACs focused on the Space sector. This augurs well for
has completed its SPAC de-merger, with many others aiming to continued public market interest in the sector.
Announced Company Region SPAC Sponsor/ Data Lifecycle / Amount Pro Forma Estimated
Exchange Sub Category EV Close Date
Oct 20 Momentus US $SRAC / Nasdaq Launch / Space Tugs $348m $1.2bn Q3 21
Dec 20 AST&Science US $NPA / Nasdaq Data / Satcoms $460m $1.4bn 6th April 21
Blade Urban
Dec 20 US $EXPC / Nasdaq Launch / Flight & Delivery $400m $4.6bn Q2 21
Air Mobility
Feb 21 Astra US $HOL / Nasdaq Launch / Rockets $500m $2.1bn Q2 21
Feb 21 Spire US $NSH / NYSE Data / Earth Observation $475m $1.2bn Q2 21
Feb 21 Archer Aviation US $ACIC / NYSE Launch / Flight & Delivery $1.1bn $3.8bn Q2 21
Feb 21 Joby Aviation US $RTP / NYSE Launch / Flight & Delivery $1.6bn $4.6bn Q2 21
Mar 21 BlackSky US $SFTW / NYSE Data / Earth Observation $450m $1.1bn Q2 21
Mar 21 Rocket Lab US $VACQ / Nasdaq Launch / Rockets $750m $4.1bn Q2 21
Beyond Earth /
Mar 21 Redwire US $GNPK / NYSE $266m $0.62bn Q3 21
Space Infrastructure
Mar 21 Lilium Europe $QELL / Nasdaq Launch / Flight & Delivery $830m $2.4bn Q3 21
8About Seraphim
VC Funds + Accelerator + Angel Platform + Research
Our Model: Inception to exit Our focus: Businesses collecting
support powered by smart capital & communicating data from above
Seraphim is the world’s leading specialist We are focused exclusively on the multi $trillion
investor in SpaceTech. SpaceTech investment market.
Powered by smart capital from leading Space We believe SpaceTech is at the nexus of mega-
companies and government agencies, we have trends that will define societal change over
a unique model combining investment funds, forthcoming decades and has a unique role to
accelerators, and an angel investor platform. play in addressing the world’s most pressing
problems.
We use our panoptic view of the SpaceTech
ecosystem to provide inception to exit support Radical advances in the Space sector mean
to the sector’s most ambitious and fearless a data and connectivity tsunami is about to
entrepreneurs as they aspire to harness the transform the world as we know it, driving the
infinite potential of Space to help push the next major paradigm shift in the global economy.
boundaries of what is currently possible by
turning science fiction into science fact. We invest in companies that are enabling,
generating and exploiting data being collected
and communicated from above.
SATEllites
100km
UAVS
1000m
DRONES
100m
BUILD LAUNCH data DOWNLINK ANALYZE PRODUCT
9Our Portfolio
Current Portfolio
We are the most prolific investor in SpaceTech globally. Across our different activities, we currently
have a portfolio of more than 50 of the world’s leading SpaceTech start-ups.
Fund
Accelerator
Seraphim News
AST & Science lists on Nasdaq
Spire Global to go public via SPAC merger
Seraphim releases 2021 SpaceTech Ecosystem Map
Amazon partners with Seraphim on inaugural AWS Space Accelerator
Iceye hits $50m contract wins, partners with Swiss Re
Mission #7 of Seraphim Space Camp Accelerator gets underway
10Methodology / Further Research
Methodology & Taxonomy Further Research
We use a wide range of different data sources We routinely publish our own research and
to compile our investment tracker. This includes insights on our website with a view to helping
proprietary, off-market information from our other investors share our excitement for the
deal flow and network, deal databases such multi-decade transformational potential of
as Crunchbase, industry news sources such Spacetech. Key periodic research we publish
as SpaceNews and Techrunch, and public includes our widely recognised SpaceTech
announcements from companies themselves. We Ecosystem and Smallsat Constellation market
only include third party capital invested on an maps.
arm’s length basis and therefore do no include
personal investment that the likes of Jeff Bezos
may make in their own space initiatives.
Build
• Building & selling satellites, drones, autonomous
systems. Components, sub-systems, complete systems
• Hardware (sensors), software (i.e. control system),
hybrid (i.e. machine vision)
launch
• Building & launching rockets
• Launch-related services
• Deliver (i.e. air taxis, drone delivery)
Space Tech Map
data Global VC backed emerging leaders per category DOWNLOAD
• Any data collection / space platform (i.e. smallsat,
drone, HAPs)
• Multi-modal: look, listen, communicate
downlink
• Facilitate transmission of data from space / aerial
platform back down to earth
• Satcoms & terrestrial comms networks
• Data storage, processing, security
analyze
• Analysis of data from space / aerial platforms
• A.I / machine learning enabled analytics
product Smallsat Constellation Map
• Packaging of different data streams (space & non Global VC backed companies across categories DOWNLOAD
space)
• Tailored to specific use cases in specific verticals
• Location, monitoring, insight, mapping www.seraphim.vc/researchYou can also read