SOFTBANK VISION FUNDS UPDATE - NAVNEET GOVIL MANAGING PARTNER & CHIEF FINANCIAL OFFICER SOFTBANK INVESTMENT ADVISERS

Page created by Alberto Gallagher
 
CONTINUE READING
SOFTBANK VISION FUNDS UPDATE - NAVNEET GOVIL MANAGING PARTNER & CHIEF FINANCIAL OFFICER SOFTBANK INVESTMENT ADVISERS
QUARTER ENDED MARCH 31, 2021

SoftBank Vision Funds
Update
NAVNEET GOVIL
Managing Partner & Chief Financial Officer
SoftBank Investment Advisers
SOFTBANK VISION FUNDS UPDATE - NAVNEET GOVIL MANAGING PARTNER & CHIEF FINANCIAL OFFICER SOFTBANK INVESTMENT ADVISERS
2

Important Information (1 of 2)
This presentation (this “Presentation”) is furnished to you for informational purposes in connection with the interests of SoftBank Group Corp. (together with its affiliates, “SoftBank”) in SoftBank Vision Fund L.P. (together
with, as the context may require, any parallel fund, feeder fund, co-investment vehicle or alternative investment vehicle, the “Vision Fund I” or “SVF I”) and is not, and may not be relied on in any manner as, legal, tax,
investment, accounting or other advice or as an offer to sell or a solicitation of an offer to buy limited partnership or comparable limited liability equity interests in the Vision Fund I or SoftBank Vision Fund II-2 L.P. (together
with, as the context may require, any parallel fund, feeder fund, co-investment vehicle or alternative investment vehicle, “SVF II” or the “Vision Fund II”), each managed by SB Investment Advisers (UK) Ltd. (the “Manager” or
“SBIA”) and its affiliates thereof. This Presentation is not intended to be relied upon as the basis for any investment decision, and is not, and should not be assumed to be, complete. The contents of this Presentation are not
to be construed as legal, business or tax advice.

None of Vision Fund I, Vision Fund II, any successor fund managed by the Manager, SBIA, SoftBank or their respective affiliates makes any representation or warranty, express or implied, as to the accuracy or completeness
of the information contained herein and nothing contained herein should be relied upon as a promise or representation as to past or future performance of Vision Fund I, Vision Fund II, any successor fund managed by the
Manager or any other entity referenced in this Presentation.

Recipients of this Presentation should make their own investigations and evaluations of the information contained in this Presentation and should note that such information may change materially.

For the avoidance of doubt, the Vision Fund I is a prior fund managed by SBIA which is not being offered to investors. Information relating to the performance of the Vision Fund I or any other entity referenced in this
Presentation has been included for background purposes only and should not be considered an indication of the future performance of the Vision Fund I, any other entity referenced in this Presentation or any future fund
managed by SBIA. References to any specific investments of the Vision Fund I, to the extent included herein, are presented to illustrate the Manager’s investment process and operating philosophy only and should not be
construed as a recommendation of any particular investment or security. The investment performance of individual investments in the Vision Fund I may vary and the performance of the selected transactions is not
necessarily indicative of the performance of all of the applicable prior investments. The specific investments identified and described herein do not represent all of the investments made by the Manager, and no assumption
should be made that investments identified and discussed herein were or will be profitable.

Statements contained in this Presentation (including those relating to current and future market conditions and trends in respect thereof) that are not historical facts are based on current expectations, estimates,
projections, opinions and/or beliefs of the Manager. Such statements involve known and unknown risks, uncertainties and other factors, and undue reliance should not be placed thereon. In addition, no representation or
warranty is made with respect to the reasonableness of any estimates, forecasts, illustrations, prospects or returns, which should be regarded as illustrative only, or that any profits will be realized. Certain information
contained herein constitutes “forward-looking statements,” which can be identified by the use of terms such as “may”, “will”, “should”, “expect”, “project”, “estimate”, “intend”, “continue”, “target” or “believe” (or the
negatives thereof) or other variations thereon or comparable terminology. Due to various risks and uncertainties, actual events or results or actual performance of the Vision Fund I or any successor fund managed by the
Manager (or any other entity referred to herein) may differ materially from those reflected or contemplated in such forward-looking statements. As a result, investors should not rely on such forward-looking statements in
making their investment decisions. Further, the targets stated herein are based on an assumption that economic, market and other conditions will not deteriorate and, in some cases, improve. These projections involve
significant elements of subjective judgment. No representation or warranty is made as to future performance or such forward-looking statements. None of the information contained herein has been filed with the U.S.
Securities and Exchange Commission, any securities administrator under any securities laws of any U.S. or non-U.S. jurisdiction or any other U.S. or non-U.S. governmental or self-regulatory authority. No such
governmental or self-regulatory authority will pass on the merits of the offering of interests in the Vision Fund I, Vision Fund II or any successor fund managed by the Manager or the adequacy of the information contained
herein. Any representation to the contrary is unlawful. Except where otherwise indicated herein, the information provided in this Presentation is based on matters as they exist as of the date of preparation of this
Presentation and not as of any future date, and will not be updated or otherwise revised to reflect information that subsequently becomes available, or circumstances existing or changes occurring after the date hereof.

SB Investment Advisers
SOFTBANK VISION FUNDS UPDATE - NAVNEET GOVIL MANAGING PARTNER & CHIEF FINANCIAL OFFICER SOFTBANK INVESTMENT ADVISERS
3

Important Information (2 of 2)
Vision Fund I performance herein is based on unrealized valuations of portfolio investments. Valuations of unrealized investments are based on assumptions and factors (including, for example, as of the date of the
valuation, average multiples of comparable companies, and other considerations) that the Manager believes are reasonable under the circumstances relating to each particular investment. However, there can be no
assurance that unrealized investments will be realized at the valuations indicated herein or used to calculate the returns contained herein, and transaction costs connected with such realizations remain unknown and,
therefore, are not factored into such calculations. Estimates of unrealized value are subject to numerous variables that change over time. The actual realized returns on the Vision Fund I’s unrealized investments will depend
on, among other factors, future operating results, the value of the assets and market conditions at the time of disposition, any related transaction costs and the timing and manner of sale, all of which may differ from the
assumptions and circumstances on which the Manager’s valuations are based.

Vision Fund I performance is based in part on valuations of certain investments that were recently acquired by the Vision Fund I as a portfolio from SoftBank Group Corp; accordingly, the performance information herein,
which is based in part on valuations of unrealized investments, is not indicative of future results. The selection of such investments, the timing of such acquisitions and the valuation and subsequent performance of those
investments had a material and positive impact on the performance of the Vision Fund I. SoftBank Group Corp. is under no obligation to offer similar assets to the Vision Fund I in the future.

Past performance is not necessarily indicative of future results. The performance of the Vision Fund I or any future fund managed by the Manager may be materially lower than the performance information presented herein.
There can be no assurance that the Vision Fund I, Vision Fund II or any successor fund managed by the Manager will achieve comparable results as those presented herein or that investors in the Vision Fund I, Vision Fund II
or any successor fund managed by the Manager will not lose any or all of their invested capital.

Certain information contained in this Presentation has been obtained from published and non-published sources prepared by other parties, which in certain cases has not been updated through the date hereof. While such
information is believed to be reliable for the purposes of this Presentation, none of the Vision Fund I, Vision Fund II, any successor fund managed by the Manager, the Manager, SoftBank, or their respective affiliates
assumes any responsibility for the accuracy or completeness of such information and such information has not been independently verified.

Certain hypothetical illustrations set forth herein contain projections, targets, assumptions and expectations with respect to the performance of investments. These hypothetical returns, including the projections, targets,
assumptions and expectations contained therein, have been prepared and are set out for illustrative purposes only, and do not constitute forecasts. They have been prepared based on the Manager’s current view in relation
to future events and various assumptions and estimations, including estimations and assumptions with respect to events that have not occurred, any of which may prove incorrect. Others may select other underlying
assumptions or methodologies that would significantly affect the projected returns or performance information set forth herein, even materially.

Third-party logos and vendor information included herein are provided for illustrative purposes only. Inclusion of such logos does not imply affiliation with or endorsement by such firms or businesses. There is no guarantee
that the Manager, the Vision Fund I’s portfolio companies, any future portfolio companies of a successor fund managed by the Manager or SoftBank will work with any of the firms or businesses whose logos are included
herein in the future.

SB Investment Advisers
SOFTBANK VISION FUNDS UPDATE - NAVNEET GOVIL MANAGING PARTNER & CHIEF FINANCIAL OFFICER SOFTBANK INVESTMENT ADVISERS
4

Topics

01- Progress & Highlights

02- In Focus: Unlocking Portfolio Value
SOFTBANK VISION FUNDS UPDATE - NAVNEET GOVIL MANAGING PARTNER & CHIEF FINANCIAL OFFICER SOFTBANK INVESTMENT ADVISERS
5

Progress & Highlights
SOFTBANK VISION FUNDS UPDATE - NAVNEET GOVIL MANAGING PARTNER & CHIEF FINANCIAL OFFICER SOFTBANK INVESTMENT ADVISERS
PROGRESS & HIGHLIGHTS                                                                                                                                                                                                                                                                                                                                         6

Performance Snapshot
As of March 31, 2021

                                                                                                                                                    SVF1 & SVF2 COMBINED METRICS

                                               Total Fair Value1                                                                                               Cumulative Investment Gains2                                                                                                                                Distributions3

                                                                                                                                            Total                                                                  Cumulative
                                                             Total Commitment                                                                                                                                                                                                            Total Fair Value1                                   Distributions3
                                                                                                                                       Acquisition Cost2                                                        Investment Gains2

                 SVF1                                                  $98.6B                                                                   $85.7B                                                                    $57.1B                                                              $142.8B                                          $22.3B

                 SVF2                                                  $30.0B                                                                     $6.2B                                                                     $5.0B                                                               $11.2B                                             -
                                                                    Effective May 06, 2021

Footnotes:
1. Total Fair Value is the Acquisition Cost plus Cumulative Investment Gains and Dividend Proceeds as of March 31, 2021.
2. Total Acquisition Cost and Cumulative Investment Gains are cumulative from Fund Inception to March 31, 2021. Cumulative Investment Gains are before tax and expenses and include Unrealized, Realized gains and Dividend Proceeds and losses from
   Investments and their related hedges. Cumulative Investment Gains does not take into account fees or expenses and should not be construed as indicative of actual or future performance.
3. Distributions include proceeds from Investment Realizations and Preferred Equity Coupon distributed to Limited Partners from Fund Inception to March 31, 2021. It includes the Return of Recallable Utilized Contributions that were returned or retained and
   reinvested and the Return of Non-Recallable Utilized Contributions but does not include the Return of Recallable Unutilized Contributions.

The information herein is presented solely for SoftBank Vision Fund 1 and SoftBank Vision Fund 2 . These highlights are provided solely for illustrative purposes and individual investors' results may vary. Past performance is not necessarily indicative of future results. Cumulative Investment Gains and Total Value include
valuations of Unrealized Investments, do not take into account fees or expenses at the time of exit that would reduce the value of returns experienced by investors, and should not be construed as indicative of actual or future performance. Actual Realized amounts will depend on, among other factors, future operating results, the
value of the assets and market conditions at the time of disposition, any related transaction costs and the timing and manner of sale, all of which may differ from the assumptions on which the valuations reported herein are based. Accordingly, the actual Realized returns on Investments that are Unrealized may differ materially
from the values indicated herein.
SOFTBANK VISION FUNDS UPDATE - NAVNEET GOVIL MANAGING PARTNER & CHIEF FINANCIAL OFFICER SOFTBANK INVESTMENT ADVISERS
SVF2

PROGRESS & HIGHLIGHTS                                                                                                                                                                                                                                                                                                                          7

A Broad and Diverse Portfolio…
As of March 31, 2021

                                                                                                                      44
                                                                                                         Total Number of Portfolio
                                                                                                                                                                                           PRIVATE3

                                                                                                                          1
                                                                                                                Companies

                                                                                                             $6.2B
                                                                                                                    Total Invested2

 SVF2
Launch
OCT. 2019

                                                                                                                                                                                            PUBLIC4

                                                                                                                                                                                                          BEIKE

Footnotes:
1. Total Number of Portfolio Companies include investments in portfolio companies made by the Fund and joint-ventures with existing portfolio companies from the Fund's inception to March 31, 2021. Total excludes minor equity stakes in companies received through
   existing Fund investments.
2. Total Invested includes all capital invested in companies by SoftBank Vision Fund 2 from Fund inception to March 31, 2021.
3. Private is the total number of SoftBank Vision Fund 2 portfolio company Investments that have not been fully Realized or publicly listed as of March 31, 2021. Private Portfolio company logos exclude minor equity stakes in companies received through existing Fund
   investments and any undisclosed investments .
4. Public includes publicly listed portfolio companies that SoftBank Vision Fund 2 has not fully exited as of March 31, 2021.
The Investments presented herein are solely for illustrative purposes, have been selected in order to demonstrate examples of SoftBank Vision Fund 2 Investments, and do not purport to be a complete list thereof. References to individual Investments should not be construed as a recommendation of any specific Investment or security.
Please refer to visionfund.com/portfolio for a more complete list of SoftBank Vision Fund 2 Investments.
SOFTBANK VISION FUNDS UPDATE - NAVNEET GOVIL MANAGING PARTNER & CHIEF FINANCIAL OFFICER SOFTBANK INVESTMENT ADVISERS
SVF2

PROGRESS & HIGHLIGHTS                                                                                                                                                                                                                                                                                                                                                     8

…Invested Across Disruptive Sectors
As of March 31, 2021

Consumer                                          Edtech                                     Enterprise                                     Health Tech                                           Fintech                                   Transportation                                     Frontier Tech                                          Logistics     Proptech

                                                                                                                                                                  ACQUISITION COST BY SECTOR1

Footnotes:
1. Acquisition Cost by Sector is cumulative from Fund Inception to March 31, 2021. Percentages shown above are calculated as Acquisition Cost of a sector divided by Total Acquisition Cost and are based on rounded figures.

Information herein is presented solely for SoftBank Vision Fund 2 from fund inception and March 31, 2021. Information is provided solely for illustrative purposes and there can be no assurance that future investments will be made in sectors similar to those set forth herein. Sector characterization has been determined by SBIA on a subjective
basis. Sector concentration is calculated as a percentage of total portfolio cost as of March 31, 2021. Acquisition Cost by Sector reflects unrealized estimated amounts, does not take into account fees or expenses, and should not be construed as indicative of actual or future performance. There can be no assurance that unrealized investments
will be sold for values equal to or in excess of the total values used in calculating the information portrayed herein. Actual returns on unrealized investments will depend on, among other factors, future operating results, the value of the assets and market conditions at the time of disposition, any related transaction costs and the timing and manner
of sale, all of which may differ from the assumptions on which the information reported herein is based. Accordingly, the actual realized returns on investments that are unrealized may differ materially from the values indicated herein.
SOFTBANK VISION FUNDS UPDATE - NAVNEET GOVIL MANAGING PARTNER & CHIEF FINANCIAL OFFICER SOFTBANK INVESTMENT ADVISERS
SVF1

PROGRESS & HIGHLIGHTS                                                                                                                                                                                                                                                                                                                                9

Measurable Value in Our Portfolio
As of March 31, 2021

Total Acquisition Cost1                                                                                                                      Cumulative Investment Gains1                                                                                                               Total Fair Value1,3
$85.7B                                                                                                                                       $57.1B                                                                                                                                     $142.8B

Realized Investments2                                                                                                                        Unrealized Investments
           FULL & PARTIAL                                                                                                                             PUBLIC                                                                                                                                      PRIVATE

                                                                                                                                                                                                                                                                                                                                        $69.0B
                                                                                                                                                                                                                                                                                                             $62.2B
                                                                                                                                                                                                                     $54.0B
                                                                           $19.8B

                  $10.5B                                                                                                                                           $13.0B

                          Cost                                        Gross Proceeds2                                                                                      Cost                                        Fair Value                                                                                      Cost             Fair Value
Footnotes:
1. Total Acquisition Cost and Cumulative Investment Gains are cumulative from Fund Inception to March 31, 2021. Cumulative Investment Gains are before tax and expenses and include Unrealized and Realized gains and losses from Investments and
   their related hedges as well as Dividends received. Total Cumulative Investment Gains does not take into account fees or expenses and should not be construed as indicative of actual or future performance.
2. Realized Investments include fully and partially exited Investments and Dividend Income received from Fund inception to March 31, 2021.
3. Total Fair Value includes the Gross Proceeds received for Realized Investments plus the Fair Value of Unrealized Investments and Dividend Income received.

The information herein is presented solely for SoftBank Vision Fund 1. These highlights are provided solely for illustrative purposes and individual investors' results may vary. Past performance is not necessarily indicative of future results. Cumulative Investment Gains and Total Fair Value include valuations of Unrealized
Investments, do not take into account fees or expenses at the time of exit that would reduce the value of returns experienced by investors, and should not be construed as indicative of actual or future performance. Actual Realized amounts will depend on, among other factors, future operating results, the value of the assets
and market conditions at the time of disposition, any related transaction costs and the timing and manner of sale, all of which may differ from the assumptions on which the valuations reported herein are based. Accordingly, the actual Realized returns on Investments that are Unrealized may differ materially from the values
indicated herein.
SOFTBANK VISION FUNDS UPDATE - NAVNEET GOVIL MANAGING PARTNER & CHIEF FINANCIAL OFFICER SOFTBANK INVESTMENT ADVISERS
SVF1

PROGRESS & HIGHLIGHTS                                                                                                                                                                                                                                                                                                                      10

Coupang IPO Drives Substantial Valuation Uplift
As of May 07, 2021

                                                                                                                                                    Gross MOIC1                                                      Gross Unrealized Gain2                                                        Current Market Cap3
        NYSE: CPNG

       Cost4                                                                                                                                 Trading Activity5

                                                                                                                                                                                                                                                                                                                            MAY 07, 2021

                                                                                                                                 +41%

                                                                                                 IPO – MAR 11, 2021

         SEP 28, 2018

                                                                                                 2021

Footnotes:
1. Gross MOIC (Gross Multiple of Invested Capital) is measured by dividing the Investment’s total Realized and Unrealized value as of May 07, 2021 by the total amount invested. It includes valuation changes that reflect Unrealized estimated amounts, does not
   take into account taxes or Fund-related expenses at the time of exit that would reduce the value of returns experienced by investors, and should not be construed as indicative of actual or future performance. Net performance for individual Investments
   cannot be calculated without making arbitrary assumptions about allocations of fees and expenses, and for that reason is not included herein.
2. Gross Unrealized Gain is before tax and expenses.
3. Current Market Cap represents Coupang's market capitalization as of May 07, 2021. Source: Bloomberg.
4. Cost represents implied SoftBank Vision Fund 1 entry valuation in September 2018.
5. Trading Activity prices represent the closing price of Coupang’s publicly traded stock on the respective date (as indicated).

Public Listing information is presented for SoftBank Vision Fund 1 only and is solely for illustrative purposes. With respect to publicly-traded securities, the quoted prices presented herein are as of the measurement date and have likely moved either upwards or downwards since such measurement date. Individual investors'
results may vary. It should not be assumed that Investments made in the future will be comparable in quality or performance to Investments described herein. References to specific Investments should not be construed as a recommendation of any particular investment or security. Select Investments have been presented to
illustrate examples of SoftBank Vision Fund 1’s Investments that have undergone public offerings and do not purport to be a more complete list of SoftBank Vision Fund 1’s Investments. Please refer to visionfund.com/portfolio for a more complete list of SoftBank Vision Fund 1’s Investments. Net performance for the subset of
Investments described above cannot be calculated without making arbitrary assumptions about allocations of fees and expenses, and for that reason is not included herein. Past performance is not necessarily indicative of future results.
PROGRESS & HIGHLIGHTS                                                                                                                                                                                                                                                                                                                                            11

Additional IPOs1 Continue to Unlock Value
As of May 07, 2021
       SVF1                                                                                                                                                                                                         SVF2
                                                                                                                                                                      2                                                                                                                                                                                2
                                                                                                                                           Gross MOIC                                                                                                                                                                                         Gross MOIC
   ETR: AG1
                                                                                                                                           3.1x                                                                  NASDAQ: XM
                                                                                                                                                                                                                                                                                                                                              1.2x
              3                                                                                                        4                                                                                                 3                                                                        4
   Cost                                                                               Trading Activity                                                                                                         Cost                                             Trading Activity

                                                                                                                                                                MAY 07, 2021
                                                                                                                                                                                                                                                                                                                                                      MAY 07, 2021

                                                                             +39%
                                                                                                                                                                                                                                                            +52%
                                                 IPO – FEB 04, 2021

           JAN 10, 2018                                        2021                                                                                                                                                           IPO – JAN 28, 2021

Footnotes:
1. Additional IPOs include SoftBank Vision Fund 1 and SoftBank Vision Fund 2 investments that were listed publicly via Initial Public Offerings (IPOs) and not Special Purpose Acquisition Companies (SPACs).
2. Gross MOIC (Gross Multiple of Invested Capital) is measured by dividing the Investment’s total Realized and Unrealized value as of May 07, 2021 by the total amount invested. It includes valuation changes that reflect Unrealized estimated amounts, does not take
   into account taxes or Fund-related expenses at the time of exit that would reduce the value of returns experienced by investors, and should not be construed as indicative of actual or future performance. Net performance for individual Investments cannot be
   calculated without making arbitrary assumptions about allocations of fees and expenses, and for that reason is not included herein.
3. Cost represents implied SoftBank Vision Fund 1’s entry valuation in AUTO1 in January 2018 and SoftBank Vision Fund 2’s entry valuation in Qualtrics in January 2021.
4. Trading Activity prices represent the closing price of AUTO1 and Qualtrics publicly traded stock on the respective date (as indicated).

Public Listing information is presented for SoftBank Vision Fund 1 and SoftBank Vision Fund 2 only and is solely for illustrative purposes. With respect to publicly-traded securities, the quoted prices presented herein are as of the measurement date and have likely moved either upwards or downwards since such measurement date.
Individual investors' results may vary. It should not be assumed that Investments made in the future will be comparable in quality or performance to Investments described herein. References to specific Investments should not be construed as a recommendation of any particular Investment or security. Select Investments have been
presented to illustrate examples of SoftBank Vision Fund 1 and SoftBank Vision Fund 2 Investments that have undergone public offerings and do not purport to be a more complete list of SoftBank Vision Fund 1 and SoftBank Vision Fund 2 Investments. Please refer to visionfund.com/portfolio for a more complete list of SoftBank Vision
Fund 1 and SoftBank Vision Fund 2 Investments. Net performance for the subset of Investments described above cannot be calculated without making arbitrary assumptions about allocations of fees and expenses, and for that reason is not included herein. Past performance is not necessarily indicative of future results.
SVF1                   SVF2

 PROGRESS & HIGHLIGHTS                                                                                                                                                                                                                                                                                                                                         12

 Active Public Listings
 As of March 31, 2021

                                                                             ETR: AG1                                      NYSE: CPNG                                       NYSE: DASH                                       NASDAQ: GH                                       NYSE: OCFT                                    NASDAQ: OPEN        NASDAQ: RLAY

                                                                       GROSS MOIC1                                      GROSS MOIC1                                      GROSS MOIC1                                      GROSS MOIC
                                                                                                                                                                                                                                                     1
                                                                                                                                                                                                                                                                           GROSS MOIC1                                      GROSS MOIC1         GROSS MOIC1

New Listings
During the Quarter2
                                                                           3.1x                                          10.3x                                            12.1x                                               9.4x                                             0.7x                                             3.5x             3.2x

                                                                                                                                                                                                                                                                                           BEIKE

                                                                          NYSE: UBER                                     NASDAQ: VIEW                                      NASDAQ: VIR                                        HKG: 6060                                       NYSE: BEKE                                      NASDAQ: XM        NASDAQ: SEER

                                                                       GROSS MOIC
                                                                                                  1
                                                                                                                        GROSS MOIC1                                      GROSS MOIC
                                                                                                                                                                                                    1
                                                                                                                                                                                                                          GROSS MOIC
                                                                                                                                                                                                                                                     1
                                                                                                                                                                                                                                                                           GROSS MOIC
                                                                                                                                                                                                                                                                                                      1
                                                                                                                                                                                                                                                                                                                            GROSS MOIC
                                                                                                                                                                                                                                                                                                                                            1
                                                                                                                                                                                                                                                                                                                                                GROSS MOIC
                                                                                                                                                                                                                                                                                                                                                               1

Total Listings Since
Inception of the Funds3
                                                                           1.6x                                             0.4x                                             5.8x                                             0.8x                                             4.4x                                             1.1x             1.3x

 Footnotes:
 1. Gross MOIC (Gross Multiple of Invested Capital) is measured by dividing the Investment’s total Realized and Unrealized value by the total amount invested. It includes valuation changes that reflect Unrealized estimated amounts, does not take into account taxes
    or Fund-related expenses at the time of exit that would reduce the value of returns experienced by investors, and should not be construed as indicative of actual or future performance. Net performance for individual Investments cannot be calculated without
    making arbitrary assumptions about allocations of fees and expenses, and for that reason is not included herein.
 2. New Listings During the Quarter include all listing between January 1, 2021 and March 31, 2021. Qualtrics listed on January 28, 2021. AUTO1 listed on February 04, 2021. View listed on March 09, 2021. Coupang listed on March 11, 2021.
 3. Total Listings Since Inception of the Funds exclude exited Investments. 10x Genomics fully exited on August 18, 2020. Slack Technologies fully exited on September 04, 2020. PingAn Good Doctor fully exited on October 28, 2020.

 Public Listing information is presented for SoftBank Vision Fund 1 and SoftBank Vision Fund 2 only and is solely for illustrative purposes. With respect to publicly-traded securities, the quoted prices presented herein are as of the measurement date and have likely moved either upwards or downwards since such measurement date.
 Individual investors' results may vary. It should not be assumed that Investments made in the future will be comparable in quality or performance to Investments described herein. References to specific Investments should not be construed as a recommendation of any particular Investment or security. Select Investments have been
 presented to illustrate examples of SoftBank Vision Fund 1’s Investments and SoftBank Vision Fund 2’s Investments that have undergone public offerings and do not purport to be a more complete list of SoftBank Vision Fund 1’s Investments and SoftBank Vision Fund 2’s Investments. Please refer to visionfund.com/portfolio for a
 more complete list of SoftBank Vision Fund 1’s Investments and SoftBank Vision Fund 2’s Investments . Net performance for the subset of Investments described above cannot be calculated without making arbitrary assumptions about allocations of fees and expenses, and for that reason is not included herein.
SVF1

PROGRESS & HIGHLIGHTS                                                                                                                                                                                                                                                                                                                                              13

Recent Funding Rounds
Pre-Money Valuations

            Jan 2021                                      $25.8B                                                    Mar 2021                                       $12.5B                                                   Mar 2021                                       $7.8B                                                    Mar 2021        $1.6B
            Series G                                      Prior Round:
                                                          $16.0B
                                                                                                                    Series F                                       Prior Round:
                                                                                                                                                                   $6.2B
                                                                                                                                                                                                                            Series G                                       Prior Round:
                                                                                                                                                                                                                                                                           $3.8B
                                                                                                                                                                                                                                                                                                                                    Series F        Prior Round:
                                                                                                                                                                                                                                                                                                                                                    $1.0B

            Lead                                                                                                    Lead                                                                                                    Lead                                                                                                    Lead
            Investors:                                                                                              Investor:                                                                                               Investor:                                                                                               Investor:

Select investments presented herein are solely for illustrative purposes, have been selected in order to provide examples of the types of investments which were made by SBIA and have had funding rounds recently and do not purport to be a complete list of SoftBank Vision Fund 1 investments. References to investments
included herein should not be construed as a recommendation of any particular investment or security. It should not be assumed that investments made in the future will be comparable in quality or performance to the investments described herein. Please refer to visionfund.com/portfolio for a more complete list of SoftBank
Vision Fund 1 investments. Valuations reflect unrealized and partially realized estimated amounts and should not be construed as indicative of actual or future performance. Such values do not reflect fees and expenses that would reduce the value of returns experienced by SoftBank Vision Fund 1 investors. There is no guarantee
that historical trends will continue throughout the life of SoftBank Vision Fund 1. There can be no assurance that unrealized and partially realized investments will be sold for values equal to or in excess of the total values used in calculating the returns portrayed herein. Actual returns on unrealized and partially realized
investments will depend on, among other factors, future operating results, the value of the assets and market conditions at the time of disposition, any related transaction costs and the timing and manner of sale, all of which may differ from the assumptions on which the valuations reported herein are based. Accordingly, the
actual realized returns on investments that are partially realized or unrealized may differ materially from the values indicated herein. Third-party logos included herein are provided for illustrative purposes only. Inclusion of such logos does not imply affiliation with or endorsement by such firms or businesses. There is no guarantee
that the Manager, SoftBank Vision Fund 1 portfolio companies or SoftBank will work with any of the firms or businesses whose logos are included here in in the future.
PROGRESS & HIGHLIGHTS                                                                                                                                                                                                                                                                                                                            14

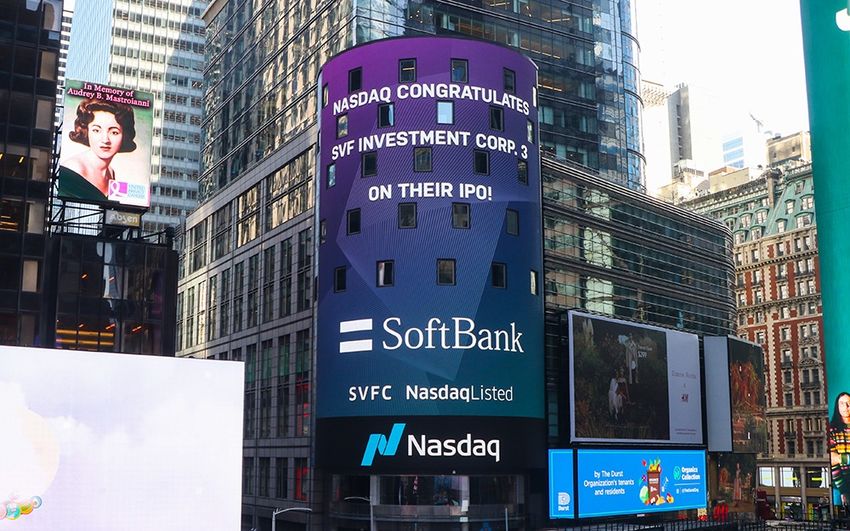
Additional SPAC Launches
Over $1.1B Raised to Accelerate Growth in Target Companies

                                                                                                                                                                                                                                    SVFA                                                           SVFB                                   SVFC

                                                                                                                                          Public Offering Size                                                                   $604M

                                                                                                                                          SVF2 Forward
                                                                                                                                          Purchase Agreement
                                                                                                                                                                                                                                 $300M

                                                                                                                                          Lock-up Period                                                                           1 Year

                                                                                                                                          Warrants                                                                                   1/5th
                           IP O D A T E:

Footnotes:
SVF Investment Corp. Website, Home | SVF Investment Corp.

SVFA, SVFB and SVFC terms provided herein are for informational and discussion purposes only, consist of terms only, and are a summary of certain terms and are not intended to be complete and are qualified in their entirety by reference to the respective Company S-1. There is no guarantee that any offering will be achieved on
the terms described herein or at all. There can be no assurances that any plans described herein will be Realized, and all such plans are subject to change, as well as uncertainties, risks, and investor consents and regulatory approvals, as applicable.
15

In Focus:
Unlocking Portfolio Value
16

UNLOCKING PORTFOLIO VALUE
                                                                                                                                                                                                                               SoftBank
                                                                                                                                                                                                                             Vision Funds
Our Philosophy
                                                                                                                             Limited                                                                                                                                                                                                     Portfolio
                                                                                                                             Partners                                                                                             Long-term,                                                                                            Companies
                                                                                                                                                                                                                                Patient Investor

The information provided herein is for illustrative purposes only and reflects the beliefs of SBIA as of the date of this presentation. There can be no assurance that the operations and/or processes of SBIA, SoftBank Vision Fund 1 and SoftBank Vision Fund 2 described in this Presentation will continue throughout the life of
SoftBank Vision Fund 1, Softbank Vision Fund 2 or any successor fund managed by the Manager, and such processes and operations may change.
UNLOCKING PORTFOLIO VALUE                                                                                                                                                                                                                                                                                                                              17

Disciplined Monetization and Distributions

                                                                                      Growth & Expansion

                                                                                                                                                                                                                                                                                                                          Public Listing
                                                                                                                                                                                                                                               M&A
                                                                                                                                                                                                                                                                                                                          IPO, DPO, or SPAC
                                                                           Capital                                                      Geographic
PORTFOLIO                                                                  Raising                                                      Expansion
COMPANIES

                                                                                                                                                                                                                                     Strategic                                         Financial                                   Opportunistic

                                                                       Ecosystem                                                             Market
                                                                       Synergies                                                             Share

                                                                                                                                                                                                                                                                                                                                        Monetization
                                                                                                                                                                                                                                                                                                                                        Factors

                                                                                                                                                                                                                                                                                      PHASE 3
SOFTBANK
VISION FUNDS                                                                                                                                                                                                                                                        Monetization

The information provided herein is for illustrative purposes only and reflects the beliefs of SBIA as of the date of this presentation. There can be no assurance that the operations and/or processes of SBIA, SoftBank Vision Fund 1 and SoftBank Vision Fund 2 described in this Presentation will continue throughout the life of
SoftBank Vision Fund 1, SoftBank Vision Fund 2 or any successor fund managed by the Manager, and such processes and operations may change.
SVF1

UNLOCKING PORTFOLIO VALUE                                                                                                                                                                                                                                                    18

 Steadily Growing Distributions to Investors
Inception to March 31, 2021

                        SVF1
                       Launch
                       MAY 2017

                       2017                                                          Mar 2018                                                                             Mar 2019                                                                    Mar 2020    Mar 2021

Footnotes:
1. Cumulative Distributions include proceeds from Investment Realizations and Preferred Equity Coupon distributed to Limited Partners from Fund Inception to the respective date. It includes the Return of Recallable Utilized Contributions and the Return of
   Non-Recallable Utilized Contributions but does not include the Return of Recallable Unutilized Contributions.

The information herein is presented solely for SoftBank Vision Fund 1. These highlights are provided solely for illustrative purposes and individual investors' results may vary. Past performance is not necessarily indicative of future results.
19

                                                                                                                                                                        PREFERRED EQUITY INVESTORS
                                                                                                                                              1
                                                                                                                                                                       Payment of Preferred
                                                                                                                                                                       Equity Coupon

   SVF1
                                                                                                                                                                                    2   PREFERRED EQUITY INVESTORS

UNLOCKING PORTFOLIO VALUE
                                                                                                                                                                                        Return of Preferred
                                                                                                                                                                                        Equity Contributions
Key Steps of the
Distribution Waterfall                                                                                                                                                                           3       EQUITY INVESTORS

                                                                                                                                                                                                         Return of Equity
                                                                                                                                                                                                         Contributions

                                                                                                                                                                                                                            EQUITY INVESTORS
                                                                                                                                                                                                                 4
                                                                                                                                                                                                                        Distribution of Equity
                                                                                                                                                                                                                        Gains to LPs

The information herein is presented solely for SoftBank Vision Fund 1. These highlights are provided solely for illustrative purposes and individual investors' results may vary.
20

                                                                                                                                                                                                                                                      Net Proceeds Distributed
                                                                                                                                                                                                                                                      Through Waterfall               $22.3B1

                                                                                                                                         1                    Payment of Preferred
                                                                                                                                                              Equity Coupon                                                                                                            $4.7B
   SVF1

UNLOCKING PORTFOLIO VALUE

                                                                                                                                                                                  2
Distributions Through                                                                                                                                                                                                                                                                 $14.0B
                                                                                                                                                                                                     Return of Preferred
                                                                                                                                                                                                     Equity Contributions

the Waterfall
                                                                                                                                                                                                                          3
Inception to March 31, 2021                                                                                                                                                                                                                    Return of Equity
                                                                                                                                                                                                                                               Contributions                           $1.5B

                                                                                                                                                                                                                                                       4     Distribution of Equity
                                                                                                                                                                                                                                                             Gains to LPs              $2.1B

Footnotes:
1. Net Proceeds Distributed through the Waterfall include proceeds from Investment Realizations and Preferred Equity Coupon distributed to Limited Partners from Fund Inception to the respective date. It includes the Return of Recallable Utilized
   Contributions and the Return of Non-Recallable Utilized Contributions but does not include the Return of Recallable Unutilized Contributions.
The information herein is presented solely for SoftBank Vision Fund 1. These highlights are provided solely for illustrative purposes and individual investors' results may vary. Past performance is not necessarily indicative of future results.
SVF1

UNLOCKING PORTFOLIO VALUE                                                                                                                                                                                                                                                               21

Distributions Have Significantly Reduced Ongoing Coupon Payments
Inception to March 31, 2021
                                                                                                                                                                                                                                                   Steps 2 & 3
                                                                                                                                                                                                                                              Distribution Waterfall

                                                                                                                       (A)                                                                      (B)                                                      (C)            (D) = (B)-(C)

                                                                                                          Fund                                                                         Drawn                                                          Return of        Outstanding
                                                                                                       Commitment                                                                      Capital1                                                       Capital2          Capital3

           Preferred Equity                                                                             $40.0B                                                                   $35.2B                                                               $14.0B           $21.2B

                                         Equity                                                         $58.6B                                                                   $51.8B                                                                $1.5B           $50.3B

                                             Total                                                      $98.6B                                                                   $87.0B                                                               $15.5B           $71.5B

Footnotes:
1. Drawn Capital includes Fund Commitment drawn down through capital calls and Return of Recallable Utilized Contributions that were retained and reinvested, less Return of Recallable Unutilized Contributions. Drawn Capital excludes any Drawdowns or
   Returns of Recallable Contributions which fall due post March 31, 2021.
2. Return of Capital includes Return of Non-Recallable Contributions and Return of Recallable Utilized Contributions from financing distributions.
3. Outstanding Capital includes Drawn Capital less Return of Capital (as defined above).

The information herein is presented solely for SoftBank Vision Fund 1. These highlights are provided solely for illustrative purposes and individual investors' results may vary. Past performance is not necessarily indicative of future results.
SVF1

UNLOCKING PORTFOLIO VALUE                                                                                                                                                                                                                                                                                                                           22

Continued Focus on Value and Distributions
Inception to March 31, 2021

                                                                                                                                                                                                                                                                                                              Value Maximization
                                                                                                                                                                                                                                                                                                                & Distributions
                                                                                                                                                                                                                                                                                                                through Public
                                                                                                                                                                                                                                                                                                               Listings and M&A
                                 Track Record
                                 Cumulative Distributions                                                                                                          1
                                 to our Investors                                                                              $22.3B

            Fund Inception                                                                                                               Year 4                                                                                                                                                                   12-Year Fund Life
                      May 20, 2017                                                                                                 March 31, 2021                                                                                                                                                                              + 2-Year Extension

Footnotes:
1. Cumulative Distributions include proceeds from Investment Realizations and Preferred Equity Coupon distributed to Limited Partners from Fund Inception to the respective date. It includes the Return of Recallable Utilized Contributions and the Return of
   Non-Recallable Utilized Contributions but does not include the Return of Recallable Unutilized Contributions.

The information provided herein is for illustrative purposes only and reflects the beliefs of SBIA as of the date of this presentation. There can be no assurance that the operations and/or processes of SBIA and SoftBank Vision Fund 1 described in this Presentation will continue throughout the life of SoftBank Vision Fund 1 or any
successor fund managed by the Manager, and such processes and operations may change.
23

                                                                                                                                                                                 Exited1                                                                                        $142.8B
                                                                                                                                                                                 Public2                                                                                               $19.8B
                                                                                                                                                                                                     3
                                                                                                                                                                                 Private
   SVF1

UNLOCKING PORTFOLIO VALUE                                                                                                                                                                          $85.7B                                                                              $54.0B

Significant Portfolio                                                                                                                                                                                    $10.5B
                                                                                                                                                                                                         $13.0B
Value Unlocked
Through Public Listings                                                                                                                                                                                  $62.2B                                                                        $69.0B
As of March 31, 2021

                                                                                                                                                                                                           Cost4                                                                  Fair Value4

Footnotes:
1. Exited Cost figure represents the cost for full and partially Realized Investments as of March 31, 2021. Exited Fair Value Figure represents the Gross Realized Proceeds for full and partially Realized Investments including Dividends as of March 31, 2021.
2. Public Cost figure represents the cost of Unrealized Investments that were publicly listed as of March 31, 2021. Public Fair Value figure represents the fair value of Unrealized Investments that were publicly listed as of March 31, 2021.
3. Private Cost represents the cost of Unrealized Investments that were not publicly traded as of March 31, 2021. Private Fair Value represents the fair value of Unrealized Investments that were not publicly traded as of March 31, 2021, and includes Dividends
   received from these investments.
4. Exited, Public and Private Cost and Fair Value figures are for illustrative purposes only and does not reflect the expected position at the end of Softbank Vision Fund 1’s life. Past performance is not necessarily indicative of future results. Individual investors'
   results may vary.

The information herein is provided solely for illustrative purposes, reflects the current beliefs of SBIA as of the date hereof, is preliminary and is based on a variety of assumptions and estimates that are subject to various risks. Certain information presented herein is preliminary in nature, may be incomplete and inaccurate, and
subject to change. It should not be assumed that Investments made in the future will be comparable in quality or performance to the Investments described herein. Past performance is not necessarily indicative of future results. Valuations reflect Realized amounts and Unrealized estimated amounts and should not be construed as
indicative of actual or future performance. Such values do not reflect fees and expenses that would reduce the value of returns experienced by SoftBank Vision Fund 1 investors. There can be no assurance that Unrealized Investments will be sold for values equal to or in excess of the total values used in calculating the returns
portrayed herein. Actual returns on Unrealized Investments will depend on, among other factors, future operating results, the value of the assets and market conditions at the time of disposition, any related transaction costs and the timing and manner of sale, all of which may differ from the assumptions on which the valuations
reported herein are based. Accordingly, the actual Realized returns on Investments that are partially Realized or Unrealized may differ materially from the values indicated herein. Please see visionfund.com/portfolio for a more complete list of SoftBank Vision Fund 1 Investments.
24

                                                                                                                                                                                                                                                                                                            $142.8B

                                                                                                                                                                                                                                                                                                                       $29.5B

                                                                                                                                                                                 $81.9B
                                                                                                                                                                                                                                                                                                                                                 Combined Exited &
   SVF1                                                                                                                                                                                                                                                                                                                                          Public Fair Value4
                                                                                                                                                                                        $10.8B
UNLOCKING PORTFOLIO VALUE                                                                                                                                                                                                                Combined Exited &                                                            $54.0B
                                                                                                                                                                                        $10.1B                                           Public Fair Value4

Portfolio
Evolution                                                                                                   Exited1
                                                                                                            Public2                                                                     $61.0B                                                                                                                         $59.3B
                                                                                                                                3
                                                                                                            Private

                                                                                                                                                                                 Mar 2020                                                                                                Mar 2021 Pro-Forma5
Footnotes:
1. Exited represents the Gross Realized Proceeds for full and partially Realized Investments including Dividend Income as of the respective date. Mar 2021 Pro-Forma figure includes Gross Realized Proceeds and Dividend Income for full and partially Realized Investments
   as well as the expected Gross Realized Proceeds of announced but not Realized exits as of March 31, 2021.
2. Public represents the fair value of Unrealized Investments that were publicly listed as of the respective date.
3. Private represents the fair value of Unrealized Investments that were not publicly traded as of the respective date. Mar 2021 Pro-Forma Private figure is adjusted to remove the fair value of Arm which was an announced but not yet Realized exit as of March 31. 2021.
4. Combined Exited & Public Fair Value represents the Gross Realized Proceeds and Dividend Income from exited Investments plus the fair value of Unrealized Investments that were publicly listed as of the respective date. Mar 2021 Pro-Forma figures represents the
   Gross Realized Proceeds and Dividend Income of fully and partially exited Investments plus the expected Gross Realized Proceeds for announced exits as of March 31, 2021.
5. Mar 2021 Pro-Forma represents a pro-forma portfolio composition of SoftBank Vision Fund 1 based upon announced but not yet completed transactions. Exited, Public and Private representation for illustrative purposes only and does not reflect the expected position
   at the end of Softbank Vision Fund 1’s life. Past performance is not necessarily indicative of future results. Individual investors' results may vary.

The information herein is provided solely for illustrative purposes, reflects the current beliefs of SBIA as of the date hereof, is preliminary and is based on a variety of assumptions and estimates that are subject to various risks. Certain information presented herein is preliminary in nature, may be incomplete and inaccurate, and
subject to change. It should not be assumed that Investments made in the future will be comparable in quality or performance to the Investments described herein. Past performance is not necessarily indicative of future results. Valuations reflect Realized amounts and Unrealized estimated amounts and should not be construed
as indicative of actual or future performance. Such values do not reflect fees and expenses that would reduce the value of returns experienced by SoftBank Vision Fund 1 investors. There can be no assurance that Unrealized Investments will be sold for values equal to or in excess of the total values used in calculating the returns
portrayed herein. Actual returns on Unrealized Investments will depend on, among other factors, future operating results, the value of the assets and market conditions at the time of disposition, any related transaction costs and the timing and manner of sale, all of which may differ from the assumptions on which the valuations
reported herein are based. Accordingly, the actual Realized returns on Investments that are partially Realized or Unrealized may differ materially from the values indicated herein. Please see visionfund.com/portfolio for a more complete list of SoftBank Vision Fund 1 Investments.
UNLOCKING PORTFOLIO VALUE                                                                                                                                                                                                                                                                                                                     25

Maximizing Value for Our Investors

                                 Value Creation                                                                                                                               Monetization                                                                                                                              Distributions

The information provided herein is for illustrative purposes only and reflects the beliefs of SBIA as of the date of this presentation. There can be no assurance that the operations and/or processes of SBIA and SoftBank Vision Fund 1 described in this Presentation will continue throughout the life of SoftBank Vision Fund 1 or any
successor fund managed by the Manager, and such processes and operations may change.
26

 Thank You

SoftBank Vision Funds Investor Briefing Presentations Available at visionfund.com/presentations
You can also read