CAPITAL MARKETS REVIEW - October 2021 REVIEWING THE QUARTER ENDED SEPTEMBER 30, 2021 - Raymond James
←
→
Page content transcription
If your browser does not render page correctly, please read the page content below

CAPITAL MARKETS REVIEW
       October 2021
             REVIEWING THE QUARTER ENDED SEPTEMBER 30, 2021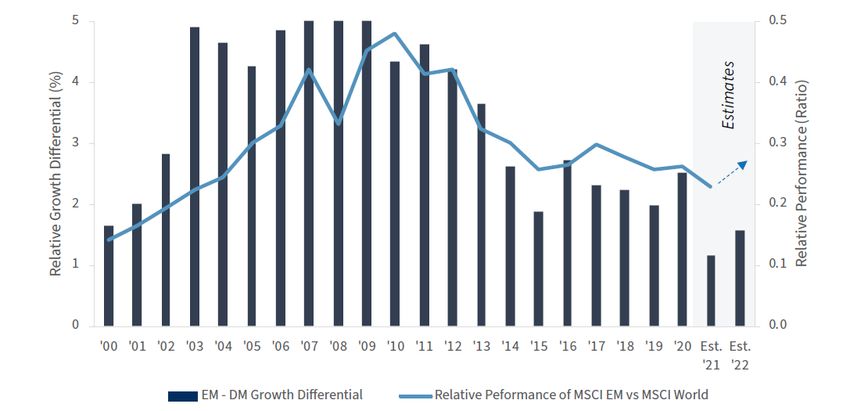
October 2021                                                                Capital Markets Review | Quarterly

                                          SUMMARY

  Economic Review
      Gross Domestic Product              3         Top 5 Stocks Weighting                            20
      Employment                          4         Price and Total Return                            21
      Construction and Manufacturing      5         Growth vs Value                                   22
      Inflation                           6         Missing Best and Worst Days                       23
      Housing Market                      7         Portfolio Bucket Returns                          24
      Consumer Confidence                 8         Determinants of Portfolio
                                                    Performance                                       25
  Capital Markets Review
       Broad Asset Class Returns          9    Quarterly Topics
       Domestic Returns                   10       Fiscal Policy Beyond the Pandemic                  26
       Fixed Income Returns               11       Emerging Markets:
       International Equity Returns       12             An Uneven Recovery                           27
       S&P Equity Sector Returns          13       Defining Fall Policy Sprint                        28
       Trailing 12 Month and Q2 Returns   14       Q&A: COVID-19 Update                               29
       US Treasurys                       15
       Fixed Income Yields                16
       Global Sovereign Debt Yields       17
       Foreign Exchange Rates             18
       Commodity Prices                   19

                                                                                                                 2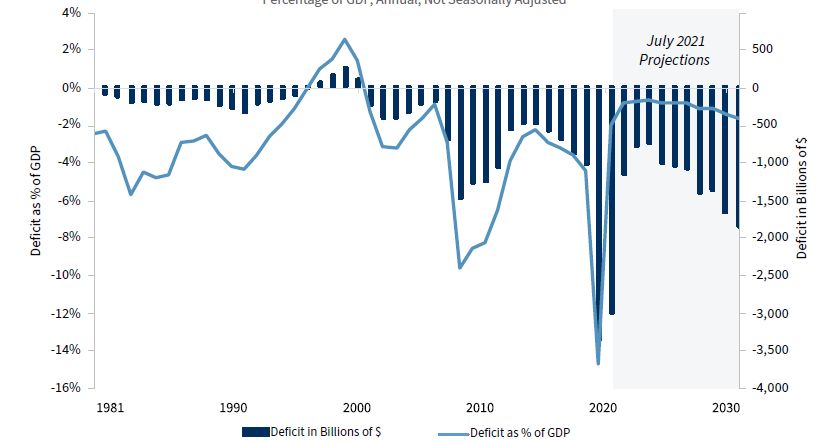
October 2021                                                                                                           Capital Markets Review | Quarterly

                                   ECONOMIC REVIEW | GROSS DOMESTIC PRODUCT

           Contribution to % Change in Real GDP                                            Quarterly Change in Real GDP
  40%                                                                             40

                                                                                  30

  14%                                                                             20
  12%

  10%                                                                             10
    8%                                                                                                                                                 6.7%
                                                                                    0
    6%
                                                                      7.92%
    4%
                                                                                  -10
    2%
                                                                      -0.65%
    0%                                                                -0.36%      -20
   -2%                                                                -0.18%
                                                                                  -30

  -40%                                                                            -40
           1/18    7/18     1/19   7/19     1/20  7/20     1/21                      '90         '00                 '10                       '20
               Gross Private Domestic Investment                                             Real GDP, PP Growth, Percent - United States
               Personal Consumption Expenditures
               Govt Consumption Expenditures & Gross Investment
               Net Exports of Goods & Services
               Recession Periods               Source: FactSet, as of 9/30/2021                                      Source: FactSet, as of 9/30/2021

                                                                                                                                                            3
October 2021 Capital Markets Review | Quarterly
ECONOMIC REVIEW | EMPLOYMENT
Civilian Unemployment Rate Non-Farm Payroll and Factory Orders
7000 16% 15% 40%
30%
6000 14%
10%
20%
5000 12%
5%
10%
4000 10%
0% 0%
3000 8%
-10%
-5%
2000 6%
-20%
-10%
1000 4% -30%
0 2% -15% -40%
'02 '04 '06 '08 '10 '12 '14 '16 '18 '20 '02 '04 '06 '08 '10 '12 '14 '16 '18 '20
Unemployment Rate (Right) Non-farm Payroll YoY Change (Left)
Jobless Claims (Thousands) (Left) Factory Orders YoY Change (Right)
Recession Periods - United States Recession Periods - United States
Source: FactSet, as of 9/30/2021 Source: FactSet, as of 9/30/2021
4October 2021 Capital Markets Review | Quarterly
ECONOMIC REVIEW | MAJOR INDUSTRY CONTRIBUTIONS TO JOB GROWTH
Construction and Manufacturing
1,800 70
1,600 65
1,400 60
1,200 55
1,000 50
800 45
600 40
400 35
200 30
'92 '93 '94 '95 '96 '97 '98 '99 '00 '01 '02 '03 '04 '05 '06 '07 '08 '09 '10 '11 '12 '13 '14 '15 '16 '17 '18 '19 '20 '21
ISM Manufacturing Index (Right) Construction Spending (Billions of $) (Left)
Source: FactSet, as of 9/30/2021
5October 2021 Capital Markets Review | Quarterly
ECONOMIC REVIEW | INFLATION
Personal Consumption Expenditures (PCE) Consumer Price Index (CPI)
(YoY Change) (YoY Change)
5% 15
4%
12
3%
9
2% PCE
Target
6
1%
3
0%
0
-1%
-2% -3
'02 '04 '06 '08 '10 '12 '14 '16 '18 '20 '70 '80 '90 '00 '10 '20
PCE CPI (All Items)
PCE (Excl. Food And Energy) CPI (Excl. Food & Energy)
Recession Periods - United States Recession Periods - United States
Source: FactSet, as of 9/30/2021 Source: FactSet, as of 9/30/2021
6October 2021 Capital Markets Review | Quarterly
ECONOMIC REVIEW | HOUSING MARKET
National Home Price Index (YoY Change) New and Existing Home Sales
7.5 1,600
25
7.0
20 1,400
6.5
15
1,200
6.0
10
5.5 1,000
5
5.0 800
0
4.5
600
-5
4.0
400
-10 3.5
-15 3.0 200
'02 '04 '06 '08 '10 '12 '14 '16 '18 '20 '02 '04 '06 '08 '10 '12 '14 '16 '18 '20
S&P/Case-Shiller National Home Price New Residential Sales (Thousands) (Right)
Recession Periods - United States Existing Home Sales (Millions) (Left)
Recession Periods - United States
Source: FactSet, as of 9/30/2021 Source: FactSet, as of 9/30/2021
7October 2021 Capital Markets Review | Quarterly
ECONOMIC REVIEW | CONSUMER CONFIDENCE
Consumer Confidence Retail Sales
160 20
140
15
120
100 10
80
5
60
0
-5
40
-10
-15
20 -20
'02 '03 '04 '05 '06 '07 '08 '09 '10 '11 '12 '13 '14 '15 '16 '17 '18 '19 '20 '21 '02 '04 '06 '08 '10 '12 '14 '16 '18 '20
Consumer Confidence Recession Periods - United States Retail Sales Recession Periods - United States
Source: FactSet, as of 9/30/2021 Source: FactSet, as of 9/30/2021
8October 2021 Capital Markets Review | Quarterly
CAPITAL MARKETS | US TREASURYS
US Yield Curve US 10-Year/US 2-Year Yield Curve
2.5
1.8
1.6
2.0 1.4
1.2
1.5
1.0
Yield (%)
0.8
1.0
0.6
0.5
0.0 0.4
1M2M
1M 3M3M6M1Y
6M 1Y 2Y 3Y 5Y 7Y 10Y 20Y 30Y Oct Nov Dec Jan Feb Mar Apr May Jun Jul Aug Sep
10/04/2021 - Yield 09/03/2021 - Yield 10/02/2020 - Yield US 10-year / US 2-year
Source: FactSet, as of 9/30/2021 Source: FactSet, as of 9/30/2021
9October 2021 Capital Markets Review | Quarterly
CAPITAL MARKETS | BROAD ASSET CLASS RETURNS
2010 2011 2012 2013 2014 2015 2016 2017 2018 2019 2020 YTD
Non-US Non-US Cash & Cash
Real Estate Fixed Income US Equities Real Estate US Equities Real Estate US Equities US Equities Commodities
Equities Equities Alternatives
40.4% 7.8% 17.0% 32.4% 14.3% 1.4% 15.3% 24.8% 1.8% 31.5% 18.4% 29.1%
Blended Non-US Non-US Blended
Commodities US Equities US Equities Fixed Income US Equities US Equities Fixed Income Real Estate
Portfolio Equities Equities Portfolio
16.7% 2.3% 16.0% 21.6% 13.7% 0.5% 12.0% 21.8% 0.0% 23.2% 12.5% 20.0%
Blended Blended Blended Blended Blended Blended Blended Non-US
US Equities US Equities Commodities US Equities
Portfolio Portfolio Portfolio Portfolio Portfolio Portfolio Portfolio Equities
15.1% 2.1% 11.4% 17.0% 8.0% 0.5% 11.4% 15.0% -4.0% 21.1% 8.1% 15.9%
Blended Cash & Cash Cash & Cash Cash & Cash Blended Non-US
Fixed Income Fixed Income Fixed Income US Equities Real Estate Fixed Income
Portfolio Alternatives Alternatives Alternatives Portfolio Equities
10.8% 0.1% 4.2% 0.0% 6.0% 0.0% 6.9% 3.5% -4.4% 19.5% 7.5% 9.7%
Non-US Cash & Cash Non-US Non-US Cash & Cash Cash & Cash Blended
Real Estate Real Estate Fixed Income Real Estate Fixed Income
Equities Alternatives Equities Equities Alternatives Alternatives Portfolio
9.4% -2.2% 0.6% -2.0% 0.0% -2.6% 3.3% 0.8% -7.6% 8.7% 0.5% 8.0%
Non-US Cash & Cash Non-US Cash & Cash
Fixed Income Commodities Real Estate Fixed Income Commodities Commodities Commodities Commodities
Equities Alternatives Equities Alternatives
6.5% -11.8% 0.1% -9.6% -3.9% -24.2% 2.6% 0.7% -13.0% 5.4% -3.5% 0.0%
Cash & Cash Cash & Cash Non-US Cash & Cash
Commodities Commodities Real Estate Commodities Commodities Real Estate Real Estate Fixed Income
Alternatives Alternatives Equities Alternatives
0.1% -13.4% -1.1% -25.8% -17.0% -24.7% 0.3% -0.2% -13.6% 2.2% -13.1% -1.6%
Blended Portfolio Allocation: 45% US Equity / 15% Non-US Equity / 40% Fixed Income
As of: 9/30/2021
10Capital Markets
October 2021 Capital Markets Review | Quarterly
CAPITAL MARKETS | DOMESTIC EQUITY RETURNS
2010 2011 2012 2013 2014 2015 2016 2017 2018 2019 2020 YTD
Mid Growth Large Growth Mid Value Small Growth Large Growth Large Growth Small Value Large Growth Large Growth Large Value Large Growth Small Value
30.6% 4.7% 18.5% 42.7% 14.9% 5.5% 31.3% 27.4% 0.0% 31.9% 33.5% 25.3%
Small Growth Small Growth Small Value Small Blend Large Blend Small Growth Small Blend Large Blend Small Growth Large Blend Mid Growth Mid Value
28.0% 3.6% 18.2% 41.3% 13.7% 2.8% 26.6% 21.8% -4.1% 31.5% 22.8% 21.0%
Mid Blend Large Blend Mid Blend Small Value Large Value Mid Growth Mid Value Mid Growth Large Blend Large Growth Small Growth Small Blend
26.6% 2.1% 17.9% 40.0% 12.4% 2.0% 26.5% 19.9% -4.4% 31.1% 19.6% 20.1%
Small Blend Small Blend Large Value Mid Value Mid Value Large Blend Small Growth Mid Blend Small Blend Mid Growth Large Blend Large Growth
26.3% 1.0% 17.7% 34.3% 12.1% 1.4% 22.2% 16.2% -8.5% 26.3% 18.4% 16.4%
Small Value Large Value Mid Growth Mid Blend Mid Blend Small Blend Mid Blend Large Value Large Value Mid Blend Mid Blend Large Blend
24.7% -0.5% 17.3% 33.5% 9.8% -2.0% 20.7% 15.4% -9.0% 26.2% 13.7% 15.9%
Mid Value Mid Growth Small Blend Mid Growth Mid Growth Mid Blend Large Value Small Growth Mid Growth Mid Value Small Blend Mid Blend
22.8% -0.9% 16.3% 32.8% 7.6% -2.2% 17.4% 14.8% -10.3% 26.1% 11.3% 15.5%
Large Value Small Value Large Blend Large Growth Small Value Large Value Mid Growth Small Blend Mid Blend Small Value Mid Value Large Value
15.1% -1.4% 16.0% 32.8% 7.5% -3.1% 14.8% 13.2% -11.1% 24.5% 3.7% 15.3%
Large Blend Mid Blend Large Growth Large Blend Small Blend Mid Value Large Blend Mid Value Mid Value Small Blend Small Value Small Growth
15.1% -1.7% 14.6% 32.4% 5.8% -6.7% 12.0% 12.3% -11.9% 22.8% 2.5% 14.8%
Large Growth Mid Value Small Growth Large Value Small Growth Small Value Large Growth Small Value Small Value Small Growth Large Value Mid Growth
15.1% -2.4% 14.6% 32.0% 3.9% -6.7% 6.9% 11.5% -12.6% 21.1% 1.4% 10.1%
As of: 9/30/2021
11October 2021 Capital Markets Review | Quarterly
CAPITAL MARKETS | FIXED INCOME RETURNS
2010 2011 2012 2013 2014 2015 2016 2017 2018 2019 2020 YTD
Emerging
High Yield Long-Term Bond High Yield Long-Term Bond Municipal High Yield Long-Term Bond T-Bill Long-Term Bond Long-Term Bond High Yield
Market Bond
15.1% 17.1% 17.9% 7.4% 16.4% 3.3% 17.1% 12.2% 1.8% 23.4% 13.3% 4.5%
Emerging Emerging Short-Term
Municipal High Yield Agency Municipal Agency Long-Term Bond High Yield Credit US TIPS
Market Bond Market Bond Bond
12.8% 10.7% 15.8% 1.0% 9.1% 1.8% 10.2% 8.2% 1.4% 14.3% 9.4% 4.2%
Short-Term Emerging Global Bond ex Global Bond ex
Long-Term Bond Treasury Long-Term Bond Credit MBS Municipal Credit Agency
Bond Market Bond US US
10.7% 9.8% 12.7% 0.3% 7.5% 1.5% 9.9% 8.0% 1.3% 13.8% 8.9% 1.0%
Emerging Emerging
Credit Credit Credit T-Bill MBS Credit High Yield Agency Treasury Municipal
Market Bond Market Bond
8.5% 8.4% 9.4% 0.0% 6.1% 1.3% 5.6% 7.5% 1.1% 13.1% 8.0% 0.8%
Global Bond ex
Aggregate Bond Municipal US TIPS Aggregate Bond Treasury Aggregate Bond Credit MBS Aggregate Bond Aggregate Bond T-Bill
US
8.4% 7.8% 6.8% -0.9% 6.0% 0.8% 2.6% 6.2% 1.0% 8.7% 7.5% 0.0%
Emerging Short-Term
Aggregate Bond Aggregate Bond MBS Treasury Aggregate Bond Agency Municipal Treasury Municipal High Yield
Market Bond Bond
6.5% 7.0% 4.2% -1.5% 5.1% 0.5% 2.6% 5.4% 0.9% 7.5% 7.1% 0.0%
Emerging Short-Term Emerging
Treasury MBS MBS Credit US TIPS Aggregate Bond US TIPS Treasury MBS
Market Bond Bond Market Bond
5.9% 6.3% 2.6% -2.0% 4.8% 0.4% 2.5% 3.5% 0.7% 6.9% 6.5% -0.7%
Global Bond ex Global Bond ex Emerging
MBS Treasury Aggregate Bond High Yield T-Bill Agency Aggregate Bond MBS Municipal
US US Market Bond
5.4% 6.1% 2.0% -2.0% 2.5% 0.0% 2.2% 2.9% 0.0% 6.4% 5.2% -1.1%
Global Bond ex
US TIPS High Yield US TIPS Municipal Agency US TIPS MBS MBS US TIPS MBS Credit
US
2.7% 5.0% 1.7% -2.6% 1.0% -0.4% 1.7% 2.5% -0.3% 4.5% 3.9% -1.3%
Short-Term Global Bond ex
Municipal US TIPS Agency Treasury Credit Treasury Treasury High Yield US TIPS Aggregate Bond
Bond US
2.4% 2.6% 1.0% -2.7% 0.7% -0.8% 1.0% 2.3% -2.1% 4.5% 3.8% -1.6%
Short-Term Short-Term Short-Term Emerging Global Bond ex Short-Term Short-Term Short-Term
T-Bill T-Bill Credit Treasury
Bond Bond Bond Market Bond US Bond Bond Bond
2.4% 1.5% 0.3% -4.1% 0.0% -3.6% 0.6% 0.8% -2.1% 3.3% 3.1% -2.5%
Emerging
Agency Agency T-Bill Long-Term Bond US TIPS High Yield T-Bill US TIPS T-Bill Agency Long-Term Bond
Market Bond
1.0% 1.0% 0.1% -6.6% -1.4% -4.5% 0.3% 0.4% -2.5% 2.2% 1.0% -2.7%
Global Bond ex Global Bond ex Global Bond ex Short-Term Global Bond ex
T-Bill T-Bill Long-Term Bond Municipal Long-Term Bond Agency T-Bill
US US US Bond US
0.1% 0.1% -0.6% -7.1% -3.5% -4.6% 0.2% 0.3% -6.8% 1.0% 0.5% -7.7%
As of: 9/30/2021
12October 2021 Capital Markets Review | Quarterly
CAPITAL MARKETS | INTERNATIONAL EQUITY RETURNS
2010 2011 2012 2013 2014 2015 2016 2017 2018 2019 2020 YTD
EM Eastern EM Eastern EM Eastern EM Eastern
EM Asia US Large Cap Pacific ex Japan US Large Cap US Large Cap Japan EM Asia EM Asia
Europe Europe Europe Europe
19.4% 2.1% 24.7% 32.4% 13.7% 9.9% 38.8% 43.3% -3.4% 31.0% 28.8% 28.2%
Emerging EM Latin Emerging Emerging
United Kingdom EM Asia Europe ex UK EM Asia US Large Cap US Large Cap US Large Cap US Large Cap
Markets America Markets Markets
19.2% -2.5% 21.2% 28.7% 5.3% 1.4% 31.5% 37.8% -4.4% 25.7% 18.7% 15.9%
Developed EM Latin EM Latin
Pacific ex Japan Europe ex UK Japan Pacific ex Japan Europe ex UK US Large Cap Europe ex UK US Large Cap United Kingdom
Markets America America
17.1% -11.7% 22.5% 27.3% -0.3% 0.1% 12.0% 27.8% -6.2% 10.5% 18.4% 12.2%
EM Eastern EM Eastern Developed Emerging Developed Emerging
Pacific ex Japan Pacific ex Japan Pacific ex Japan Europe ex UK Japan Europe ex UK
Europe Europe Markets Markets Markets Markets
16.3% -12.7% 18.7% 23.3% -1.8% -0.4% 11.6% 26.0% -10.2% 7.7% 14.9% 10.2%
Emerging EM Eastern Developed Developed
Japan Japan United Kingdom Japan Pacific ex Japan Japan Pacific ex Japan Europe ex UK
Markets Europe Markets Markets
15.6% -14.2% 18.6% 20.7% -3.7% -4.0% 8.0% 25.6% -12.6% 6.4% 11.6% 8.8%
Developed Developed Developed Developed Developed
US Large Cap Europe ex UK Pacific ex Japan United Kingdom EM Asia Japan Japan
Markets Markets Markets Markets Markets
15.1% -14.5% 17.9% 5.6% -4.5% -7.5% 6.5% 24.4% -13.4% 6.3% 8.3% 6.2%
EM Latin EM Latin
EM Asia US Large Cap EM Asia United Kingdom Pacific ex Japan Japan United Kingdom Japan Pacific ex Japan Pacific ex Japan
America America
14.9% -17.2% 16.0% 2.3% -5.4% -8.4% 2.7% 24.2% -14.1% 5.0% 6.6% 4.9%
Emerging EM Eastern Developed Emerging Emerging
United Kingdom United Kingdom Europe ex UK EM Asia United Kingdom United Kingdom United Kingdom
Markets Europe Markets Markets Markets
8.8% -18.2% 15.3% 1.4% -5.8% -9.5% 1.5% 22.4% -14.2% 4.1% -10.4% -1.0%
Developed EM Latin EM Latin Emerging EM Latin Emerging Emerging EM Eastern
Europe ex UK US Large Cap Europe ex UK EM Asia
Markets America America Markets America Markets Markets Europe
8.2% -19.1% 8.9% -2.3% -12.0% -14.6% 0.3% 21.8% -14.4% 2.0% -11.3% -3.9%
EM Eastern EM Latin EM Eastern EM Latin EM Eastern EM Latin EM Latin
Europe ex UK Japan United Kingdom EM Asia EM Asia
Europe America Europe America Europe America America
2.4% -21.3% 8.4% -13.2% -37.1% -30.8% 0.0% 18.1% -15.2% 1.5% -13.5% -5.4%
As of: 9/30/2021
13October 2021 Capital Markets Review | Quarterly
CAPITAL MARKETS | S&P EQUITY SECTOR RETURNS
2010 2011 2012 2013 2014 2015 2016 2017 2018 2019 2020 YTD
Consumer Consumer Information Information Information
Real Estate Utilities Financials Real Estate Energy Health Care Energy
Discretionary Discretionary Technology Technology Technology
32.3% 20.0% 28.8% 43.1% 30.2% 10.1% 27.4% 38.8% 6.5% 50.3% 43.9% 43.2%
Consumer Consumer Consumer Consumer
Health Care Utilities Health Care Comm Services Materials Utilities Comm Services Financials
Discretionary Staples Discretionary Discretionary
27.7% 14.0% 23.9% 41.5% 29.0% 6.9% 23.5% 23.8% 4.1% 32.7% 33.3% 29.1%
Consumer Consumer Consumer
Industrials Health Care Real Estate Industrials Health Care Financials Financials Comm Services Real Estate
Staples Discretionary Discretionary
26.7% 12.7% 19.7% 40.7% 25.3% 6.6% 22.8% 23.0% 0.8% 32.1% 23.6% 24.4%
Information Information Information
Materials Real Estate Comm Services Financials Industrials Financials S&P 500 Materials Comm Services
Technology Technology Technology
22.2% 11.4% 18.3% 35.6% 20.1% 5.9% 18.9% 22.2% -0.3% 31.5% 20.7% 21.6%
Consumer
Energy Comm Services Health Care S&P 500 Real Estate Materials Health Care Real Estate Industrials S&P 500 S&P 500
Staples
20.5% 6.3% 17.9% 32.4% 16.0% 4.7% 16.7% 22.1% -2.2% 29.4% 18.4% 15.9%
Consumer Information Information
Comm Services S&P 500 Financials Comm Services Utilities S&P 500 S&P 500 Real Estate Health Care
Discretionary Technology Technology
19.0% 6.1% 16.0% 28.4% 15.2% 3.4% 16.3% 21.8% -4.4% 29.0% 13.4% 15.3%
Consumer Information Consumer Consumer
S&P 500 Energy Industrials S&P 500 S&P 500 Industrials Industrials Health Care
Staples Technology Staples Discretionary
15.1% 4.7% 15.3% 26.1% 13.7% 1.4% 13.8% 21.0% -8.4% 27.9% 11.1% 13.5%
Consumer Information Consumer Consumer Consumer
Materials Materials Industrials Financials S&P 500 Comm Services Industrials
Staples Technology Staples Staples Staples
14.1% 2.4% 15.0% 25.6% 9.8% -1.5% 12.0% 13.5% -12.5% 27.6% 10.7% 11.5%
Information Consumer Consumer
Financials S&P 500 Energy Industrials Utilities Financials Utilities Utilities Materials
Technology Discretionary Discretionary
12.1% 2.1% 14.8% 25.1% 9.7% -2.5% 6.0% 12.1% -13.0% 26.3% 0.5% 10.5%
Information Consumer Consumer Consumer
Industrials Utilities Materials Utilities Real Estate Industrials Materials Financials
Technology Staples Staples Discretionary
10.2% -0.6% 10.8% 13.2% 6.9% -4.8% 5.4% 10.8% -13.3% 24.6% -1.7% 10.3%
Consumer
Utilities Materials Energy Comm Services Comm Services Materials Real Estate Energy Materials Health Care Real Estate
Staples
5.5% -9.8% 4.6% 11.5% 3.0% -8.4% 3.4% -1.0% -14.7% 20.8% -2.2% 4.7%
Health Care Financials Utilities Real Estate Energy Energy Health Care Comm Services Energy Energy Energy Utilities
2.9% -17.1% 1.3% 1.6% -7.8% -21.1% -2.7% -1.3% -18.1% 11.8% -33.7% 4.2%
As of: 9/30/2021
14October 2021 Capital Markets Review | Quarterly
CAPITAL MARKETS | T12 AND Q3 RETURNS
Broad Asset Class Domestic Equity S&P 500 Sectors International Equity Fixed Income
Total Returns Total Returns Total Returns Total Returns Total Returns
T12 Q3 T12 Q3 T12 Q3 T12 Q3 T12 Q3
Energy Financials EM Eastern EM Eastern High Yield US TIPS
Commodities Commodities Small Value Large Growth Europe Europe
83.0% 2.7% 11.3% 1.2%
66.6% 1.9% 56.8% 8.6%
US TIPS Agency
42.2% 6.6% Financials Utilities
United Kingdom Japan
Small Blend Large Blend 59.1% 1.8%
5.4% 1.0%
Emerging
Real Estate US Equities 57.6% 0.6% Comm Services Comm Services
31.2% 4.7% Market Bond
High Yield
3.3% 0.9%
38.4% 1.6% US Large Cap US Large Cap
Short-Term
34.4% 0.6% Mid Value Large Value
Real Estate
Municipal
Bond
Health Care 30.0% 0.6%
2.6% 0.1%
Blended 55.7% -0.8% 30.5% 1.4% EM Latin
US Equities United Kingdom Long-Term Bond MBS
Portfolio S&P 500
Information America
Small Growth Small Growth Technology 27.7% -0.3% 2.1% 0.1%
30.0% 0.2% 30.0% 1.3%
Developed Credit Treasury
49.0% -1.5% Europe ex UK
Industrials
Non-US Real Estate Markets 1.4% 0.1%
Fixed Income Mid Blend Mid Value 27.0% -0.4%
Equities 29.0% 0.9% Agency Aggregate Bond
Information Developed
-1.6% S&P 500 Europe ex UK
27.1% 0.1% 43.7% Technology Markets
1.0% 0.1%
28.9% 0.6% T-Bill T-Bill
26.3% -1.8%
Blended Cash & Cash Mid Growth Mid Blend
Materials
Consumer
0.1% 0.0%
Discretionary
Portfolio Alternatives 33.3% -1.8% 26.5% 0.0%
Pacific ex Japan Pacific ex Japan Short-Term
Credit
Bond
17.2% 0.0% Health Care
Consumer 25.9% -4.4% 0.0% 0.0%
Large Value Mid Growth Staples
Emerging MBS
Cash & Cash 22.6% -0.3% Japan Long-Term Bond
Real Estate 32.0% -2.0% Markets
Consumer -0.4% -0.2%
Alternatives Discretionary
Energy 22.5% -8.0%
Aggregate Bond Municipal
Large Blend Small Blend 19.1% -1.7% Emerging
0.1% -0.1% EM Asia -0.9% -0.3%
Consumer Markets
-2.8% Materials
Non-US 30.0% Staples 18.6% -9.5% Treasury
Emerging
Fixed Income 11.3% -3.5% Market Bond
Equities Large Growth Small Value EM Asia
EM Latin -3.3% -0.5%
Utilities Industrials America Global Bond ex Global Bond ex
-0.9% -13.6% 28.9% -4.0% 11.0% -4.2% 14.3% -13.2%
US US
-4.1% -1.7%
As of: 9/30/2021
15October 2021 Capital Markets Review | Quarterly
CAPITAL MARKETS | FIXED INCOME YIELDS
US Yield-to-Worst
14%
12%
10%
8%
6%
4% 4.47%
2%
1.53%
1.40%
0%
'12 '13 '14 '15 '16 '17 '18 '19 '20 '21
Govt Yield - 10 Yr Bloomberg US Aggregate Credit Bloomberg US Aggregate Credit Corporate High Yield
Source: FactSet, as of 9/30/2021
16October 2021 Capital Markets Review | Quarterly
CAPITAL MARKETS | GLOBAL SOVEREIGN DEBT YIELDS
10-Year Sovereign Debt Yields
35%
30% This chart illustrates the highest and
lowest monthly yields over the past 30
25% years as well as the current yield,
represented by ♦.
20%
15%
10%
5%
0%
-5%
United States
United Kingdom
Sweden
France
Switzerland
Australia
Canada
Japan
Norway
Italy
Ireland
Germany
Spain
Greece
Belgium
Denmark
Portugal
Source: FactSet, as of 9/30/2021
17October 2021 Capital Markets Review | Quarterly
CAPITAL MARKETS | FOREIGN EXCHANGE RATES
US Dollar
130
120
110
100
90
80
70
60
'92 '93 '94 '95 '96 '97 '98 '99 '00 '01 '02 '03 '04 '05 '06 '07 '08 '09 '10 '11 '12 '13 '14 '15 '16 '17 '18 '19 '20 '21
US Dollar Recession Periods - United States
Source: FactSet, as of 9/30/2021
18Capital Markets
October 2021 Capital Markets Review | Quarterly
CAPITAL MARKETS | COMMODITY PRICES
WTI Price Gold Price
200 2,500
150 2,000
100 1,500
50 1,000
0 500
-50 0
'92 '94 '96 '98 '00 '02 '04 '06 '08 '10 '12 '14 '16 '18 '20 '92 '94 '96 '98 '00 '02 '04 '06 '08 '10 '12 '14 '16 '18 '20
WTI Crude ($/bbl) Recession Periods - United States Gold ($/oz) Recession Periods - United States
Source: FactSet, as of 9/30/2021 Source: FactSet, as of 9/30/2021
19October 2021 Capital Markets Review | Quarterly
CAPITAL MARKETS | TOP 5 STOCKS WEIGHTING
S&P 500 Top 5 Stocks (FAAAM*) by Weighting FAAAM* Contribution to S&P 500 Performance
26
220
24 200
180
22
160
20
140
18
16 120
14
100
12
10 80
8
6 60
'12 '13 '14 '15 '16 '17 '18 '19 '20 '21
1/20 4/20 7/20 10/20 1/21 4/21 7/21 10/21
S&P 500 Top 5 Stocks
S&P 500 S&P 500 ex FAAAM FAAAM
Source: FactSet, as of 9/30/2021, *FAAAM: Facebook, Apple, Alphabet, Amazon, Microsoft
20October 2021 Capital Markets Review | Quarterly
CAPITAL MARKETS | PRICE AND TOTAL RETURN
Growth of $100 S&P 500 Price Appreciation and Dividends
2,500 25%
2,000 20%
5.8% 2.9%
15% 5.0%
1,500
2.4%
10%
4.0%
1,000
15.3%
13.6%
6.2% 3.4% 12.6%
11.2%
5%
500 4.3% 7.4%
4.4%
3.0%
1.6% 1.8%
0%
-2.7%
0
'90 '92 '94 '96 '98 '00 '02 '04 '06 '08 '10 '12 '14 '16 '18 '20
S&P 500 Returns with Dividends -5%
S&P 500 Returns without Dividends 1940s 1950s 1960s 1970s 1980s 1990s 2000s 2010s Average
Price Appreciation Dividends
Source: FactSet, as of 9/30/2021
21October 2021 Capital Markets Review | Quarterly
CAPITAL MARKETS | GROWTH VS. VALUE
Growth Outperforming Value Small Cap Outperforming Large Cap
160 220
150 200
180
140
160
130
140
120
120
110
100 100
90
80 80
70
60 60
Oct Nov Dec Jan Feb Mar Apr May Jun Jul Aug Sep Oct Nov Dec Jan Feb Mar Apr May Jun Jul Aug Sep
S&P 500 - Growth S&P 500 - Value S&P 500 Russell 2000
Source: FactSet, as of 9/30/2021 Source: FactSet, as of 9/30/2021
22October 2021 Capital Markets Review | Quarterly
ASSET ALLOCATION | MISSING BEST AND WORST DAYS
Missing the Best Days Missing the Worst Days
20%
8% 7.5%
18.05%
7% 18%
16.03%
6% 16%
13.80%
5% 4.7% 14%
4% 12% 11.11%
3% 10%
2.4%
2% 8% 7.41%
1% 0.5% 6%
0% 4%
-1% 2%
-1.0%
-2% 0%
All Trading Missing 5 Missing 10 Missing 15 Missing 20 Missing 20 Missing 15 Missing 10 Missing 5 All Trading
Days (3777 Best Days Best Best Days Best Days Worst Days Worst Days Worst Days Worst Days Days (3777
Days) Days)
Annualized S&P 500 Price Return Over Past 15 Years Annualized S&P 500 Price Return Over Past 15 Years
Source: FactSet, as of 12/31/2020
23October 2021 Capital Markets Review | Quarterly
ASSET ALLOCATION | PORTFOLIO BUCKET RETURNS
1-Year Annual Return by Portfolio Bucket 5-Year Annual Return by Portfolio Bucket
50% 50%
40% 40%
30% 30%
20% 20%
10% 10%
0% 0%
-10% -10%
-20% -20%
-30% -30%
0/100 10/90 20/80 30/70 40/60 50/50 60/40 70/30 80/20 90/10 100/0 0/100 10/90 20/80 30/70 40/60 50/50 60/40 70/30 80/20 90/10 100/0
95% Confidence Band of Portfolio Returns Average Return 95% Confidence Band of Portfolio Returns Average Return
Source: FactSet, as of 12/31/2020 Source: FactSet, as of 12/31/2020
24October 2021 Capital Markets Review | Quarterly
ASSET ALLOCATION | DETERMINANTS OF PORTFOLIO PERFORMANCE
Asset Allocation is Critical to Portfolio Construction
Security
Selection
Asset 5%
Allocation Market Timing
2%
91% Other
2%
Source: Determinants of Portfolio Performance, Gary P. Brinson, L. Randolph Hood and Gilbert L. Beebower, Financial Analysts Journal, Vol. 42, No. 4 (Jul. - Aug., 1986), pp. 39-44
25Capital Markets
October 2021 Capital Markets Review | Quarterly
QUARTERLY TOPICS | FISCAL POLICY BEYOND THE PANDEMIC
“The government is not like a household. Our children and grandchildren do not have to pay off the national
debt. The key issue is whether we can meet interest payments on the debt and whether we can roll over
existing debt as it matures. So far, the US government can easily borrow and making payments on the debt
shouldn’t be a problem if interest rates rise moderately.”
-Scott J. Brown, PhD,
Chief Economist, Raymond James
Source: Investment Strategy Quarterly October 2021 "For the complete article, ask your financial advisor for a copy of the October 2021 Investment Strategy Quarterly."
26Capital Markets
October 2021 Capital Markets Review | Quarterly
QUARTERLY TOPICS | EMERGING MARKETS: AN UNEVEN RECOVERY
“Emerging markets tend to grow faster than advanced economies, with the relative performance of equity markets
closely tied to the directional trends. While emerging markets have lagged, we expect rising vaccination rates and a
strong global recovery to turn the growth differential back in their favor.”
-Tracey Manzi, CFA
Senior Investment Strategist, Investment Strategy
Source: Investment Strategy Quarterly October 2021 "For the complete article, ask your financial advisor for a copy of the October 2021 Investment Strategy Quarterly."
27Capital Markets
October 2021 Capital Markets Review | Quarterly
QUARTERLY TOPICS | DEFINING FALL POLICY SPRINT
“Passing the bipartisan infrastructure deal,
negotiating a budget reconciliation package,
funding the government for the next fiscal year,
raising the US statutory borrowing limit (‘debt
ceiling’), and settling key defense and foreign
policy decisions top a long list of priorities in DC.”
-Ed Mills,
Managing Director, Washington Policy Analyst,
Equity Research
Source: Investment Strategy Quarterly October 2021 "For the complete article, ask your financial advisor for a copy of the October 2021 Investment Strategy Quarterly."
28Capital Markets
October 2021 Capital Markets Review | Quarterly
QUARTERLY TOPICS | Q&A: COVID-19 UPDATE
“The COVID-19 Delta variant resulted in a new wave of cases in the US. [In
this article], we discuss the impact of the Delta variant on the economy and
supply chains; how the US compares to other nations in vaccination and
pandemic responses; the effectiveness of vaccines against Delta; and
possible future impacts of potential new variants.”
Chris Meekins, Managing Director, Healthcare Policy Analyst, Equity Research
Steven Seedhouse, PhD, Managing Director, Biotechnology Analyst, Equity Research
Tavis C. McCourt, CFA, Managing Director, Institutional Equity Strategist, Equity Research
Source: Investment Strategy Quarterly October 2021 "For the complete article, ask your financial advisor for a copy of the October 2021 Investment Strategy Quarterly."
29October 2021 Capital Markets Review | Quarterly
ASSET CLASS BENCHMARK ASSET CLASS BENCHMARK
Cash & Cash Alternatives Bloomberg US Treasury - Bills (1-3 M) Small Blend S&P Small Cap 600
Fixed Income Bloomberg US Aggregate Small Growth S&P Small Cap 600 Growth
US Equities S&P 500 (TR) US Large Cap S&P 500
World Equities MSCI World ex USA EM Eastern Europe MSCI EM Eastern Europe
Commodities Bloomberg Commodity Index Europe ex UK MSCI Europe ex UK
Real Estate FTSE EPRA/NAREIT United States Developed Markets MSCI EAFE
Materials S&P 500 (TR) / Materials - SEC United Kingdom MSCI United Kingdom
Industrials S&P 500 (TR) / Industrials - SEC Japan MSCI Japan
Comm Services S&P 500 (TR) / Communication Services -SEC EM Latin America MSCI EM Latin America
Utilities S&P 500 (TR) / Utilities - SEC Emerging Markets MSCI EM (Emerging Markets)
Consumer Discretionary S&P 500 (TR) / Consumer Discretionary - SEC EM Asia MSCI EM Asia
Consumer Staples S&P 500 (TR) / Consumer Staples - SEC Pacific ex Japan MSCI Pacific ex JP
Health Care S&P 500 (TR) / Health Care - SEC Long-Term Bond Bloomberg US Aggregate Credit - Long
Information Technology S&P 500 (TR) / Information Technology - SEC High Yield Bloomberg US High Yield - Corporate
Energy S&P 500 (TR) / Energy - SEC Aggregate Bond Bloomberg US Aggregate
Financials S&P 500 (TR) / Financials - SEC Credit Bloomberg US Aggregate Credit
Real Estate S&P 500 (TR) / Real Estate - IG Emerging Market Bond Bloomberg Emerging Markets USD Aggregate
S&P 500 S&P 500 (TR) Treasury Bloomberg US Aggregate Government - Treasury
Large Value S&P 500 Value Municipal Bloomberg Municipal Bond
Large Blend S&P 500 Agency Bloomberg US Agency CMBS
Large Growth S&P 500 Growth MBS Bloomberg MBS 1000
Mid Value S&P Mid Cap 400 Value Global Bond ex US Bloomberg Global G6 (G7 x US)
Mid Blend S&P Mid Cap 400 US TIPS Bloomberg US TIPS (1-3 Y)
Mid Growth S&P Mid Cap 400 Growth Short-Term Bond Bloomberg US Treasury Bellwethers (2 Y)
Small Value S&P Small Cap 600 Value T-Bill Bloomberg US Treasury - Bills (1-3 M)
30October 2021 Capital Markets Review | Quarterly
DISCLOSURES
Material prepared by Raymond James Investment Strategy. All expressions of opinion reflect the judgment of the Raymond James Investment Strategy and are subject to change. This information
should not be construed as a recommendation. The foregoing content is subject to change at any time without notice. Content provided herein is for informational purposes only. There is no
guarantee that these statements, opinions or forecasts provided herein will prove to be correct. Past performance is not a guarantee of future results. Indices and peer groups are not available for
direct investment. Any investor who attempts to mimic the performance of an index or peer group would incur fees and expenses that would reduce returns. No investment strategy can guarantee
success. Economic and market conditions are subject to change. Investing involves risks including the possible loss of capital.
Information obtained from third-party sources is considered reliable, but we do not guarantee that the information herein is accurate or complete.
INTERNATIONAL INVESTING | International investing involves additional risks such as currency fluctuations, differing financial accounting standards, and possible political and economic instability.
These risks are greater in emerging markets.
SECTORS | Sector investments are companies engaged in business related to a specific economic sector and are presented herein for illustrative purposes only and should not be considered as the
sole basis for an investment decision. Sectors are subject to fierce competition and their products and services may be subject to rapid obsolescence. There are additional risks associated with
investing in an individual sector, including limited diversification.
OIL | Investing in oil involves special risks, including the potential adverse effects of state and federal regulation and may not be suitable for all investors.
CURRENCIES | Currencies investing are generally considered speculative because of the significant potential for investment loss. Their markets are likely to be volatile and there may be sharp price
fluctuations even during periods when prices overall are rising.
GOLD | Gold is subject to the special risks associated with investing in precious metals, including but not limited to: price may be subject to wide fluctuation; the market is relatively limited; the
sources are concentrated in countries that have the potential for instability; and the market is unregulated.
FIXED INCOME | Fixed-income securities (or “bonds”) are exposed to various risks including but not limited to credit (risk of default of principal and interest payments), market and liquidity, interest
rate, reinvestment, legislative (changes to the tax code), and call risks. There is an inverse relationship between interest rate movements and fixed income prices. Generally, when interest rates rise,
fixed income prices fall and when interest rates fall, fixed income prices generally rise.
US TREASURIES | US Treasury securities are guaranteed by the US government and, if held to maturity, generally offer a fixed rate of return and guaranteed principal value.
DOMESTIC EQUITY DEFINITION
S&P 500 | The S&P 500 Total Return Index: The index is widely regarded as the best single gauge of large-cap U.S. equities. There is over USD 7.8 trillion benchmarked to the index, with index assets
comprising approximately USD 2.2 trillion of this total. The index includes 500 leading companies and captures approximately 80% coverage of available market capitalization.
LARGE GROWTH | S&P 500 Growth Total Return Index: This index represents a segment of the S&P 500 Index with a greater-than-average growth orientation.
LARGE VALUE | S&P 500 Value Total Return Index: This index represents a segment of the S&P 500 Index with a less-than-average growth orientation.
SMALL GROWTH | S&P Small Cap 600 Growth Total Return Index: This index represents a segment of the S&P 600 Index with a greater-than-average growth orientation.
SMALL BLEND | Russell 2000 Total Return Index: This index covers 2000 of the smallest companies in the Russell 3000 Index, which ranks the 3000 largest US companies by market capitalization.
The Russell 2000 represents approximately 10% of the Russell 3000 total market capitalization. This index includes the effects of reinvested dividends.
SMALL VALUE | S&P Small Cap 600 Value Total Return Index: This index represents a segment of the S&P 600 Index with a less-than-average growth orientation.
MID VALUE | S&P 400 Value Total Return Index: This index represents a segment of the S&P 400 Index with a less-than-average growth orientation.
MID VALUE | S&P Small Cap 400 Value Total Return Index: This index represents a segment of the S&P 400 Index with a less-than-average growth orientation.
MID BLEND | S&P Small Cap 400 Total Return Index: The index measures the investment return of mid-capitalization stocks in the United States.
31October 2021 Capital Markets Review | Quarterly
FIXED INCOME DEFINITION
AGGREGATE BOND | Bloomberg US Agg Bond Total Return Index: The index is a measure of the investment grade, fixed-rate, taxable bond market of roughly 6,000 SEC-registered securities with
intermediate maturities averaging approximately 10 years. The index includes bonds from the Treasury, Government-Related, Corporate, MBS, ABS, and CMBS sectors.
MUNICIPAL | Bloomberg Municipal Total Return Index: The index is a measure of the long-term tax-exempt bond market with securities of investment grade (rated at least Baa by Moody’s Investors
Service and BBB by Standard and Poor’s). This index has four main sectors: state and local general obligation bonds, revenue bonds, insured bonds, and prerefunded bonds.
INTERNATIONAL EQUITY DEFINITION
EMERGING MARKETS EASTERN EUROPE | MSCI EM Eastern Europe Net Return Index: The index captures large- and mid-cap representation across four Emerging Markets (EM) countries in Eastern
Europe. With 50 constituents, the index covers approximately 85% of the free float-adjusted market capitalization in each country.
BLOOMBERG BARCLAYS CAPITAL AGGREGATE BOND TOTAL RETURN INDEX | This index represents securities that are SEC-registered, taxable, and dollar denominated. The index covers the U.S.
investment grade fixed rate bond market, with index components for government and corporate securities, mortgage pass-through securities, and asset-backed securities. The index is designed to
minimize concentration in any one commodity or sector. It currently has 22 commodity futures in seven sectors. No one commodity can compose less than 2% or more than 15% of the index, and no
sector can represent more than 33% of the index (as of the annual weightings of the components).
EMERGING MARKETS ASIA | MSCI EM Asia Net Return Index: The index captures large- and mid-cap representation across eight Emerging Markets countries. With 554 constituents, the index covers
approximately 85% of the free float-adjusted market capitalization in each country.
EMERGING MARKETS LATIN AMERICA | MSCI EM Latin America Net Return Index: The index captures large- and mid-cap representation across five Emerging Markets (EM) countries in Latin America.
With 116 constituents, the index covers approximately 85% of the free float-adjusted market capitalization in each country.
EMERGING MARKETS | MSCI Emerging Markets Net Return Index: This index consists of 23 countries representing 10% of world market capitalization. The index is available for a number of regions,
market segments/sizes and covers approximately 85% of the free float-adjusted market capitalization in each of the 23 countries.
PACIFIC EX-JAPAN | MSCI Pacific Ex Japan Net Return Index: The index captures large- and mid-cap representation across four of 5 Developed Markets (DM) countries in the Pacific region (excluding
Japan). With 150 constituents, the index covers approximately 85% of the free float-adjusted market capitalization in each country.
JAPAN | MSCI Japan Net Return Index: The index is designed to measure the performance of the large and mid cap segments of the Japanese market. With 319 constituents, the index covers
approximately 85% of the free float-adjusted market capitalization in Japan.
FOREIGN DEVELOPED MARKETS | MSCI EAFE Net Return Index: This index is designed to represent the performance of large and mid-cap securities across 21 developed markets, including countries
in Europe, Australasia and the Far East, excluding the U.S. and Canada. The index is available for a number of regions, market segments/sizes and covers approximately 85% of the free float-adjusted
market capitalization in each of the 21 countries.
EUROPE EX UK | MSCI Europe Ex UK Net Return Index: The index captures large and mid cap representation across 14 Developed Markets (DM) countries in Europe. With 337 constituents, the index
covers approximately 85% of the free float-adjusted market capitalization across European Developed Markets excluding the UK.
MSCI EAFE | The MSCI EAFE (Europe, Australasia, and Far East) is a free float-adjusted market capitalization index that is designed to measure developed market equity performance, excluding the
United States & Canada. The EAFE consists of the country indices of 22 developed nations.
WORLD EQUITIES | The MSCI World ex USA Index captures large and mid cap representation across 22 of 23 Developed Markets (DM) countries*-- excluding the United States. With 1,003 constituents,
the index covers approximately 85% of the free float-adjusted market capitalization in each country.
COMMODITY DEFINITIONS
US DOLLAR INDEX | The US dollar index (USDX) is a measure of the value of the US dollar relative to the value of a basket of currencies of the majority of the US's most significant trading partners.
This index is similar to other trade-weighted indexes, which also use the exchange rates from the same major currencies.
DATA SOURCE:
FactSet
32INTERNATIONAL HEADQUARTERS: THE RAYMOND JAMES FINANCIAL CENTER
880 CARILLON PARKWAY // ST. PETERSBURG, FL 33716 // 800.248.8863
RAYMONDJAMES.COM
Investment products are: not deposits, not FDIC/NCUA insured, not insured by any government agency, not bank guaranteed, subject to risk and may lose value.
© 2021 Raymond James & Associates, Inc., member New York Stock Exchange/SIPC. © 2021 Raymond James Financial Services, Inc., member FINRA/SIPC.
Raymond James® is a registered trademark of Raymond James Financial, Inc.You can also read