Simple Creative Projects from an Optics Teaching Laboratory
←
→
Page content transcription
If your browser does not render page correctly, please read the page content below

Simple Creative Projects from an
                              Optics Teaching Laboratory

                                                        John W. Noé
                   Department of Physics and Astronomy, Stony Brook University, Stony Brook, NY 11794-3800 USA
                          Phone: (631) 632-4303, Fax: (631) 632-8176, Email: John.Noe@stonybrook.edu

         Abstract: The core educational program of the Stony Brook Laser Teaching Center is learning
         through the collaborative development of individualized projects. Many of these projects,
         especially with students new to research, are simple explorations or demonstrations of everyday
         devices or phenomena related to light, optics, or sound that have some creative component. Often
         the topic is suggested by something the student is just curious about or ‘invents,’ or by a chance
         observation or news article. This paper will describe a number of these ‘simple, creative’ projects,
         and relate the discovery process by which each came about and the results obtained.
         Keywords: Active learning, project-based learning, collaborative learning, individualized research experience

1. Introduction

As described in a separate paper at this conference [1], the core educational activity of the Stony Brook Laser
Teaching Center (LTC) is learning through the development of individualized hands-on projects; one such project
was discussed in detail in a second separate paper [2]. Some of these projects can be described as fairly standard
exercises explored in greater-than-usual depth over weeks or months [1]. Other projects relate to topics of current
research interest, such as optical tweezers or optical vortices, and can be quite involved and open-ended. A third
project category, which is described and illustrated through the various examples presented in this paper, consists of
mostly simple explorations or demonstrations of everyday devices or phenomena related to light, optics, or sound
that have some novel or creative component. This component could be related for example to the way the project
topic was picked, or how the project was carried out with the simple tools and materials on hand in the laboratory or
readily available. In some projects there is a ‘Eureka!’ moment of discovery when the student working alone has a
significant insight, makes an unexpected observation, or invents something. More often the creativity arises in some
way from the special chemistry between student and mentor that gradually develops as they communicate about and
collaborate on the project over an extended period of time.

The students involved in these ‘simple, creative’ projects are mostly new to research and generally have had at most
a very limited exposure to optics in a high school physics course. When they enter the LTC they are introduced to
various optics phenomena and concepts through seeing demonstrations and participating in informal discussions.
Except during the full-time summer program there are no classes or lectures and the unstructured discussions all take
place in the small laboratory discussion area. The detailed optics knowledge and laboratory skills needed for each
project are acquired on a need-to-know basis, through self-study and informal discussions with mentor(s) and more
experienced students. The main requirement for success on the part of the student is ample interest and curiosity and
an ability and willingness to collaborate with the mentor. Students and mentors become in effect partners in a unique
shared experience, and the synergy of their interaction leads to the new ideas and insights not otherwise possible.
The student-mentor partnership extends to the all-important writing process that concludes the project, as the mentor
guides the student as closely as necessary to create a thorough and convincing written description of the project.

The projects described are not meant to be duplicated, although some of the ideas and ‘tricks’ might be useful to
others. They are presented simply to provide examples of what’s possible through relaxed one-on-one student-
mentor interactions in a supportive learning environment. We hope that others will be inspired by these stories to
explore opportunities to incorporate such unstructured project-based learning into their own educational programs.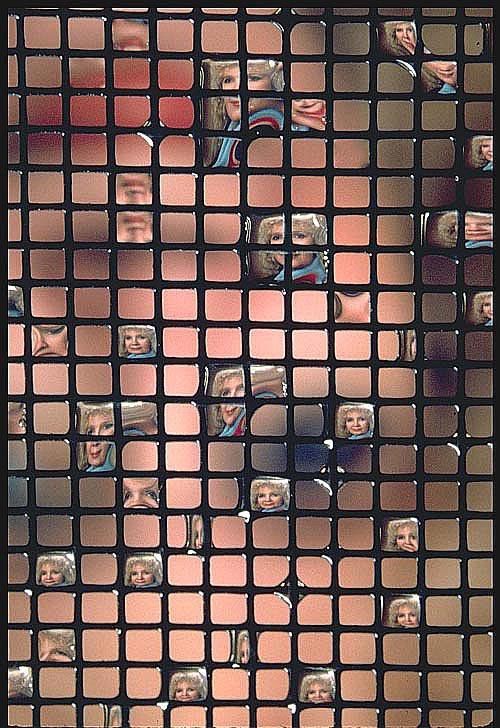
2. Representative Projects

In the following I will describe eight representative projects of the type described above. Most of the students
involved were university freshmen (age 18 or 19) from the Introduction to Research course (WSE187) in the
Women in Science and Engineering (WISE) program [3]. Several others were high school students, and one was a
high school physics teacher in training. In many cases the creative component was the idea for the project, how it
came about, or what was studied. In another case a simple but very effective technique for nanometer motion control
was invented in the course of a much more involved project. Several projects involved interesting or unusual optical
properties of everyday objects. Studies of this type have a grand history and can be very open-ended indeed, see for
example Michael Berry's “Reflections on a Christmas-Tree Bauble.” [4]

The duration of the projects ranged from a few weeks to a full semester. Those by WISE students are documented in
straight-forward (hand-coded) web reports that are freely available on the WISE Programs portion of the Laser
Teaching Center web site [5]. Learning to create such hand-coded html reports is an essential part of the WSE187
course, and the collaborative writing involved reinforces understanding as well as writing skills. The project by the
prospective high school teacher is also described in a web report. Other projects are documented on the web site in
pictures, abstracts, Powerpoint slides and full-length written reports prepared in LaTeX. Web reports typically
include many photos, drawings and graphs. The drawings could be done on a computer (we use the Linux program
xfig) or could simply be a photo of a hand-drawn sketch on the white board or in the student's notebook. Graphs and
numerical simulations are typically made using the 1980’s era DOS spreadsheet program QuattroPro, the ultimate
simplicity of which is a valuable feature to students new to this type of analysis.

2.1 Light decay of ‘Glow in the Dark’ materials

My partner in this project was Jill Chen, a mechanical engineering major who was one of six students in my spring
2002 WISE class [6]. Jill was the unusual student who not only had an excellent idea for a project (“can we study
those glow-in-the-dark stars?”) but also suggested it almost immediately. As a young child, Jill had enjoyed the
comfort of falling asleep in a room with a light on, and had also enjoyed seeing stars in the sky at night. At some
point she had been introduced to glow-in-the-dark decorative stars and had ever since displayed these in her room at
home and later in her college dormitory. This turned out to be an excellent project: one that could be effectively
performed with very simple equipment already on hand, but which was also very open-ended. The following
summarizes the shared adventure that is better described in Jill's own words on her project web page [6].

We started with some internet research about glow-in-the-dark (phosphorescent) materials, and soon learned about a
company (Shannon Luminous Materials) that markets such materials for a range of applications [7]. A person at the
company was interested to hear about the project and quite willing to help. He provided samples of Shannon's state-
of-the-art ‘Super Phosphorescent’ material based on rare-earth-activated strontium aluminate (SRA) [8] as well as a
more traditional zinc sulfide (ZnS) screen. Although a photomultiplier was available, one of our standard Thorlabs
silicon photodetectors (model DET-210) proved to be adequate for observing the light decay for several hours, and
had the advantage of simplicity and stability. No amplifier was used, but a high value resistor (105 to 106 ohms) was
placed across the output of the detector to convert the small current signal to a voltage in the 0.1 - 100 mV range.

In projects that involve taking a modest series of readings I typically guide students to record readings by hand in
their notebook and then type these data into a spreadsheet program for plotting. This manual technique has worked
well for numerous laser beam profile measurements and the like, but in this case a very simple automated method
based on the serial interface port in the Radio Shack Model 22-805 digital multimeter was employed instead. The
software provided with the meter transferred one reading per second into a text file, which could then be imported
into our QuattroPro DOS spreadsheet environment for plotting. This scheme was very simple, effective and
economical (US $50 for the meter), and also pedagogically more transparent than using a less familiar device for an
interface. To record data the materials were ‘charged’ by exposure to a bright desk light, the detector was set on top,
and this package was quickly placed in a dark environment.

Fig. 1. Light decay curve for a sample of a commercial ‘glow-in-the-dark’ (SRA)
                      material. The >6000 solid points (blue) are light intensity readings at 1-second
                      intervals. The red line with slope -1 illustrates a power law of the form I ~ t(-1) .

Our expectation was that the light decay curve would be exponential in form, and thus characterized by a ‘half-life.’
Such data, when plotted on a semi-log plot, would appear as a straight line. Much to our surprise, when we plotted
the two hours of useful data obtained we did not obtain a straight line at all! By chance the data were then plotted on
a full log-log plot, and this revealed the astounding result shown above. The recorded light intensity drops relatively
slowly at first, but at a gradually increasing rate. Then from about 100 seconds on the intensity I drops steadily in
inverse proportion to the elapsed time, I ~ t(-1) . This type of behavior is known as a ‘power law’ (the exponent can
be any constant) and turns out to be quite common in nature and statistics [9]. Familiar examples from physics are
the inverse-square law for optical radiation or gravitation, and the `1/f law’ that describes the intensity distribution
of random noise. It was a surprise to learn that power laws also describe seemingly-unrelated phenomena such as the
frequency of occurrence of words in a book (Zipf’s law).

While this project went on for more than a full semester the key result (the figure above) came early on and many
questions (such as how the decay curve varies with temperature) were left unexplored. We were however able to
confirm by more sensitive measurements that the power law decay continues for at least ten hours. We also learned
from reading and conversations with others that delayed light emissions arise from triplet spin states, and that a
random distribution of the triplet state lifetimes can explain the power law behavior of the composite decay curve.

2.2 Multiple reflections in a decorative lamp

A decorative glass candle lamp with interesting optical properties was the topic of two similar but independent
student projects five years apart. The lamp was a table decoration at a local Indian restaurant [10], which was happy
to donate one to our lab. The flame in the candle lamp is surrounded by four tinted glass panels whose inside
surfaces have a partially reflective coating; these panels are arranged in the form of a rectangular prism, with
opposite faces parallel to each other. When the flame is viewed from outside the lamp at eye level a sequence of
flame images of gradually diminishing luminosity is seen. These are clearly due to multiple reflections and 12 or
more images can be counted in a darkened room (see figure below). The goal of the measurements and analysis
performed was to determine the relative luminosity of the images. This is interesting in part because the luminosity
ratio between the first image and the last visible image is a direct measure of the visual sensitivity range of the eye.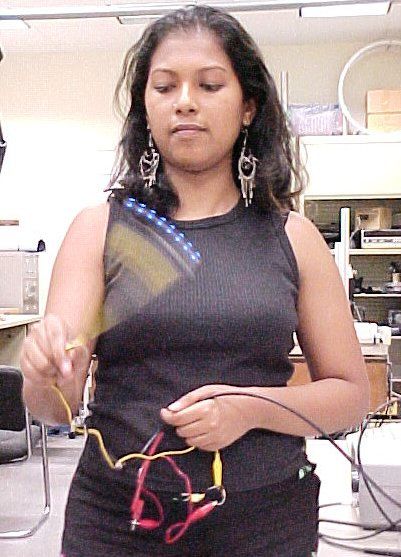
Fig. 2. Multiple reflections of the flame in a decorative lamp. The eye can
                          perceive several even weaker reflections that the camera can’t register.

After seeing a demonstration of the lamp Victoria Bonvento (WISE program, 2001) decided to study it for her
project. She found the ‘one way mirror’ aspect of the lamp's metallized partially-reflecting surfaces especially
appealing [11]. Hamsa Sridhar, a sophomore high school student, returned to this topic in spring 2006 for her initial
research experience in optics. She was not aware of the earlier project at the time and made an independent and
more complete analysis based on new and more careful measurements [12].

Victoria and I soon realized that the high reflectivity surface was the inner one, and that the luminosity ratio between
successive images was simply equal to the reflectance r of this surface. We measured r directly by reflecting a HeNe
laser beam against the inner surface on to a photodetector. While this direct method involved little analysis the
geometry was awkward and our result r = 36 ± 4 % had a relatively large uncertainty.

The subsequent experiments with Hamsa involved more analysis but gave more information and a more certain
result for r by two different methods. Since Hamsa was quite comfortable with math, but had not yet studied physics
or optics, this was a pedagogically quite appropriate project for her. In the first experiment the He-Ne beam was
directed toward the glass lamp from the outside at a slight angle. Using a photodetector, the intensity of the initial
beam and the three beams that either reflected from one of the two surfaces of one glass panel, or passed completely
through it, were measured. These values were analyzed through a series of equations to obtain the reflectance values
of the inner and outer surfaces and the absorption in the tinted glass between. In the second experiment, the laser
beam was allowed to travel through the glass lamp to a screen. Five spots of decreasing intensity were visible when
the lamp was rotated slightly; they were consecutively isolated by an iris and their relative intensities measured
using the photodetector. In this case the ratio between the spot intensities is r2, and this value could be accurately
determined by a graphical analysis, as shown in the figure below.

The reflectance results from the two experiments were in good agreement and we took their average, 43.0 ± 0.5 % as
the final result. It follows that the nth visible image must be (0.43)(n-1) times as bright as the first (unreflected) image,
or 1/4,627 times as bright for n = 11. Thus the human eye can perceive an intensity range of about 5,000 – 10,000 at
a single instant. (The eye can of course adapt to a much wider brightness range given time to adjust.)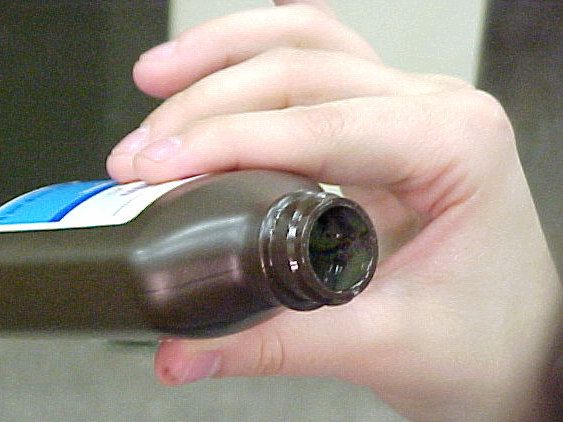
Fig. 3. Measurements and analysis on multiple reflections in the decorative lamp [12]. Left: measured
             intensities of multiply reflected laser beams. Right: predicted relative luminosity of the flame images.

2.3 Frequency response of the eye

The creative aspect of Meruba Anwar’s project [13] derived from her strong native curiosity and ability as an
observer. This was a short project for the WISE Introduction to Research course, about a third of a semester. The
actual observations took just an afternoon or two, while learning html and writing a web report took a few days
longer. Unlike Jill Chen (Section 2.1 above) Meruba struggled at first to find a suitable topic. I encouraged her to
just pay attention to things around her that she was curious about and that seemed interesting. After several weeks
she reported that while shopping at the mall that weekend she’d seen an unusual clock in which numbers and letters
appeared to float in space [14]. She soon learned that the operating principle of the clock is the persistence of vision
effect. By chance Meruba had stumbled upon a topic that was an excellent match to her interest in neuroscience.

I gave Meruba an assortment of LED’s (purchased from the local Radio Shack store) and set up a square-wave
generator to pulse them at any desired frequency. My intention was for her to explore how the threshold for
visually detecting flicker (the Critical Fusion Frequency or CFF) depends on parameters such as the LED brightness
and color [15]. After a few hours of investigation Meruba reported with great excitement an observation that was
obvious in retrospect but which neither of us had anticipated – the threshold for detecting flickering depends
significantly on whether one is looking directly at the LED (direct vision) or looking to the side (peripheral vision).
By chance Meruba had discovered an essential feature of vision, the two types of cells (rods and cones) in the retina!
An understanding developed in this way through self-discovery will certainly endure. Meruba went on to carefully
record a variety of CFF observations and write an excellent web report that includes these [13].

                                   Fig. 4. Demonstrating the principle of the Fantezein clock.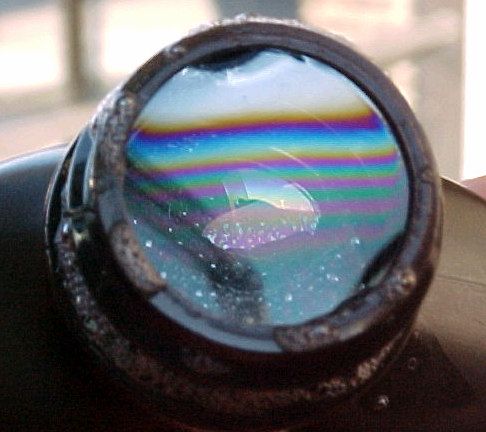
2.4 A variable water drop lens

Scott Huang was a high school student in summer 2006 [16]. After some exploration of possible project topics he
developed an interest in techniques or devices that measure or correct for wavefront aberrations, and we worked
together to find a project related to this interest. One such device, the Shack-Hartmann wavefront sensor, is based on
an array of small lenses (‘lenslets’) that create a corresponding array of focal spots on a CCD-detector. While
discussing this idea I showed Scott an image I knew of that depicted droplets of water trapped in the openings of a
window screen (see figure below). We considered making a lenslet array of fluid droplets, but it was soon evident
that it would be difficult to make the lenses sufficiently small and uniform enough to create a useful lenslet array.
While playing with water-drop lenses Scott happened to place a droplet of water into the opening of an iris
diaphragm, a common object in our lab. He was fascinated by the way the focal properties of the lens could be
varied simply by varying the opening, and decided to investigate this ‘variable water-drop lens.’ Scott soon learned
that variable fluid lenses are a topic of considerable recent interest, with important potential applications [18].

                               Fig. 5. Face viewed through water drop lenses in a screen [17].

Using a simple setup he devised, Scott measured the focal length of various water-drop lenses. These varied over a
wide range (5 to 80 mm) as the droplet diameter varied from about 3 to 8 mm, and the droplet deviated more and
more from a spherical shape [16]. Scott also made a simple microscope from the water-drop lens and recorded the
image below and others with our Electrim 1000N CCD detector [1].

                Fig. 6. Partial image of a Ronchi grating (pitch 150 µm) recorded through the water drop lens.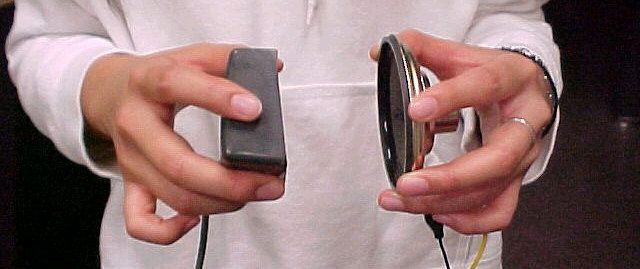
2.5 Color patterns in soap films

My student partner in this project, Eric Tompkins, was just completing an MAT (Master of Arts in Teaching)
program at Stony Brook to be certified as a high school physics teacher [19]. He needed a course credit to complete
his degree and so undertook a semester-long project. Eric and I started by looking at various simple demonstrations
of optical phenomena. One of these was the demonstration of colors in soap bubble films illustrated in Figure 7
below. The small bottle holds a mixture of roughly of equal parts water, glycerin, and Dawn dishwasher detergent.
(The bottle originally held the glycerin.) When the bottle is tipped over with its cap in place, and the cap is then
removed, a soap film can be seen across the mouth of the bottle. If the bottle is held in a nearly horizontal position as
shown for a few minutes the film is affected by gravity and develops a distinct black band at the top. In a location
free of air currents a white area and horizontal colored bands form below this. The colors on the soap film are most
distinct in an area well lit by diffuse bright light, preferably indirect sunlight. Coincidentally, the opaque container
does more than provide a convenient way of creating the film – it keeps the back side of the film in darkness and
thus allows the black area to show up distinctly.

                Fig. 7. Interference patterns of reflected light in soap films. Note the ‘black’ film at the top,
                and the white area and horizontal colored bands in the right-most picture.

Eric was familiar with the way soap film colors arise from interference of light, but he had never seen a black soap
film before. It was apparent to him immediately that this effect and the horizontal colored lines must be somehow
related to the way film thickness must vary due to gravity, with the thinnest film at the top. We decided to focus the
project on developing a mathematical model of the way the film colors vary with thickness. As described in Eric’s
research journal and report [19], the key concept is that a 180° phase shift occurs at the front surface of the film but
not at the rear. Light reflected from the rear surface is however phase-shifted by its passage (twice) across the film.
If the film is very thin, much thinner than a wavelength of light, the latter phase shift is negligible and one has
purely destructive interference. To quantify this Eric derived an expression for the intensity of the reflected light,
which was in turn used to create the graphs of intensity versus wavelength or film thickness shown in these figures.

                  Fig. 8a. Calculated relative intensities of four colors (violet, blue, green and red) as a
                  function of soap film thickness [19]. The plot at the left is just an enlarged view of the
                  one at the right. It is apparent that the black soap film must be no more than about 10 nm
                  thick. The fact that intensities for all colors peak around 90 nm explains the white region
                  below the black band. Using these predictions reflectance measurements for
                  monochromatic light could be used to map the film thickness as a function of position.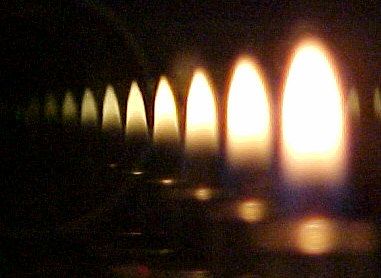
Fig. 8b. Calculated relative intensities of reflected light as a function of wavelength, for
                  eight different film thicknesses. Note that the colors of the lines in this case relate to
                  thickness, not wavelength. These predictions could be compared to spectrometer
                  measurements of reflected white light to uniquely determine the film thickness.

2.6 Point spread function (PSF) of a consumer CCD camera

Marissa MacDonald (WISE program, 2007) carried out the first astronomy-related student project in the LTC [20].
It was one of several projects over the last decade that utilized the lab's simple Sony Mavica FD73 camera as a
quantitative tool, not just for documentation. An important concept in observational astronomy is the point spread
function or PSF. This can be described as the response of an imaging system to the light from a point source such as
a star. The figure below shows the setup we used to create and photograph a simulated star. The angular size of the
pinhole at the camera (2.2 arc seconds) was not nearly as small as even the ‘largest’ star Betelgeuse (0.045 arcsec),
but it was comparable to the diffraction limit of the camera and therefore adequate.

                                    Fig. 9. Setup for the point spread function experiment.

          Fig. 10. Simulated (left and center) and observed (right) PSFs for the Mavica camera. The image at the
          far left shows the predicted Airy pattern corresponding to the camera’s aperture superimposed on a grid
          of 5.6 µm square camera pixels. In the center image the same Airy pattern has been ‘pixelated’ in the xv
          program. Far right, the observed PSF is compact and comparable in size to the diffraction limited spot.
2.7 Noise cancellation and the velocity of sound
Yu Fen (Jen) Hwang (freshman WISE course, 2004) was inspired to this project by late-night noise in her dorm
room [21]. She had seen my demonstration of two tuning forks ‘beating’ against one another, and thus knew that one
sound could cancel another. She wondered whether arbitrary sounds could be canceled in a similar way. (Jen was
not aware at the time that noise cancellation was already an off-the-shelf consumer technology.) An important
consideration in noise cancellation is the wavelength of sound. We decided to try to visualize the wave properties of
sound with a small handheld loudspeaker and microphone. A 2.00 kHz sine wave was fed to the loudspeaker and
also to one channel of our dual-channel oscilloscope, which controlled the oscilloscope trigger. The microphone
signal was fed into the second channel. Figure 11 below shows 9 consecutive images recorded over 3 seconds as the
microphone and speaker were steadily moved apart. The phase shift of the received wave (fuzzier trace) is apparent,
as well as its diminishing intensity. After this we established the distance corresponding to a 2π phase shift as 17.8 ±
0.5 cm. This wavelength value together with the known frequency implies a sound velocity of 356 m/s, in good
agreement with the accepted value at 25 C. Even more interesting was the result when both loudspeaker and
microphone were pointed at the adjacent wall. Now moving the microphone caused no phase shift, but did cause a
periodic intensity modulation. We had inadvertently created a standing wave! All in all, this simple impromptu
project, which took just part of an afternoon, was quite successful at making sound waves a familiar entity.
Fig. 11. Demonstrating the wavelength of sound (see text).
2.8 Nanometer motion control with a rubber band
The most creative aspect of Jon Wu's project [22] was a very simple yet quite effective technique for ultra-high-
resolution motion control in a scanning optical interferometer. The path that led to this novel development was long
and complicated. Jon was a high school participant in our 2004 full-time summer program. He expressed an interest
in medical optics, so we looked at possible project ideas in this area. After considering various possibilities we
focused on optical-coherence tomography (OCT), a technique for achieving micron-scale depth resolution within
turbid media such as tissue by utilizing the limited coherence length of an broadband light source [23]. The idea
gradually emerged of demonstrating the concept of OCT by observing interference fringe visibility as a function of
path length difference. Similar to Fourier Transform Spectroscopy (FTS) the interferogram contains information on
the wavelength components (spectrum) of the light, or in this case the spectral width of the broadband light source.It was soon apparent from preliminary experiments in an interferometer that Jon put together that the challenge of
the project was to achieve sub-micron resolution in the mirror movement over a range of thousands of fringes. (The
difficulty of doing this is why FTS is rarely done at wavelengths shorter than the IR.) Jon experimented for some
time with levers and the like that would scale down the motion of the mechanical translators available to us, which
are graduated in relatively coarse 25.4 micron steps. His devices worked but were plagued with mechanical noise
and backlash. While pondering these difficulties the idea came up of simply pulling on the mirror mount in a
controlled way to gently deflect it . When an ordinary rubber band was used as the coupling device the result was
amazingly successful (Figs. 12 & 13). Of course the range of mirror motion is quite limited, but the precise motion
control provided by this simple trick has proven very useful for demonstrations and some other experiments.
Fig. 12. A rubber band attached to the 25.4 mm translation stage pulls on the
Thorlabs mirror mount to create reproducible nanometer-scale deflections.
Fig. 13. Interference fringes from a HeNe laser recorded with the rubber-band translator
as the micrometer was turned by a stepping motor. The step size is approximately 1.2 nm.3. Conclusion The response of the many students involved in these projects has been overwhelmingly positive, and the creative educational approach illustrated here has been enthusiastically endorsed by our university and many visitors. A great deal of time and effort is required to work individually with each student, but the resulting projects and educational experiences are often quite original and invariably of significant and lasting value. Acknowledgments I deeply appreciate the willingness of my students to collaborate with me so enthusiastically on the projects described in this paper and many others. I would also like to thank the many companies and individuals who provided information, materials and assistance in support of the projects. This work was supported in part by the Women in Science and Engineering program and the Department of Physics and Astronomy at Stony Brook. References [1] John Noé, “The Laser Teaching Center at Stony Brook University,” ETOP-2007, Ottawa (this conference). [2] Sriya Adhya and John Noé, “A Complete Ray-trace Analysis of the Mirage Toy,” ETOP-2007, Ottawa (this conference). [3] Women in Science and Engineering (WISE) program, Stony Brook University, http://www.wise.sunysb.edu/. [4] M.V. Berry, “Reflections on a Christmas-tree bauble,” Physics Education 7 1-6 (1972). Paper 22 at Prof. Berry’s web site, http://www.phy.bris.ac.uk/people/berry_mv/publications.html [5] Stony Brook Laser Teaching Center website, http://laser.physics.sunysb.edu/. [6] Jill Chen, freshman WISE course, spring 2002, http://laser.physics.sunysb.edu/~jill/. [7] Shannon Luminous Materials, Santa Ana, CA 92703, http://www.blacklite.com/. [8] See http://en.wikipedia.org/wiki/Strontium_aluminate/. [9] Wikipedia article on power law relationship, http://en.wikipedia.org/wiki/Power_law/. [10] Curry Club Restaurant, East Setauket, New York, http://curryclubli.com/. [11] Victoria Bonvento, freshman WISE course, 2002, http://laser.physics.sunysb.edu/~wise/wise187/2002/reports/victoria/report.html [12] Hamsa Sridhar, Kings Park High School, spring 2006 – present, http://laser.physics.sunysb.edu/~hamsa/. [13] Mehruba Anwar, freshman WISE course, 2004, http://laser.physics.sunysb.edu/~wise/wise187/2004/reports/mehruba/. [14] Fantezein clock, http://www.fantazein.com/. [15] Harold J. Metcalf, Topics in Classical Biophysics, Prentice-Hall,1980 (out of print). [16] Scott Huang, Great Neck North High School, summer 2006, http://laser.physics.sunysb.edu/~scott/. [17] Photo by Glen Gaffney, http://gallery.photo.net/photo/179791-lg.jpg [18] Press release on the Philips FluidFocus lens, June 24, 2004, http://www.research.philips.com/newscenter/archive/2004/fluidlenses.html [19] Eric Tompkins, MAT student, spring 2004, http://laser.physics.sunysb.edu/~ett/. [20] Marissa MacDonald, freshman WISE course, 2006, http://laser.physics.sunysb.edu/~marissa/. [21] Yu Fen (Jen) Hwang, freshman WISE course, 2004, http://laser.physics.sunysb.edu/~wise/wise187/2004/reports/jen/. [22] Jon Wu, Great Neck South High School, summer 2004, http://laser.physics.sunysb.edu/~jonwu/. [23] Wikipedia article on OCT, http://en.wikipedia.org/wiki/Optical_coherence_tomography/.
You can also read