Six simple charts on what to expect from shares - Boutique ...
←
→
Page content transcription
If your browser does not render page correctly, please read the page content below

Six simple charts on what to
expect from shares
Graham Hand, Managing Editor, Firstlinks. | 25th May 2020 | 4 min read

In our recent Reader Survey, about 40% of respondents reported portfolio
losses of over 20% between January and March 2020, although the market
rise since the lows has pared back some of the pain. Anyone relying on
their investments to fund regular spending will not only be concerned about
the loss in capital value, but also the reductions in dividends. National Bank
has lowered its interim dividend from 83 cents to 30 cents and ANZ Bank
has cancelled it completely in a sector which traditionally provides one-third
of all dividends in the listed market.

Market recovery patterns
Contrasting ‘investors’ with ‘traders’, most people do not make radical
changes in their portfolios based on short-term volatility. That’s a good
thing, as picking tops and bottoms is almost impossible, even for
professional fund managers who stare at screens all day. A well-designed
investment plan should focus on long-term goals and needs, and not worry
too much about monthly variations. Volatility is the cost of participating in
the long-term benefits of share investing.

Regardless of an investor’s ability to look long term, two questions remain:

1. How often does a diversified share portfolio lose money?

2. How long does it usually take to recover?

We opened the Morningstar Direct database for the Australian All
Ordinaries Accumulation Index to measure the total returns (including
dividends) over one year, three years and five years since 1983. For the
five year, we did a check using the Canadian Total Return Index, given the
similarities between the Canadian and Australian markets.

There are good reasons to take comfort from the charts, and the pictures
‘tell a thousand words’. Of course, Covid-19 is a unique threat, and only
time will tell whether ‘this time is different’.

One-year returns
Australian equity investors should expect to lose money for one year in
every four to five years. Anyone who considers this loss of capital
unacceptable should hold a more diversified portfolio including other asset
classes, because over time, the same pattern will probably repeat.

(In the chart, 0.1 equals 10%, 0.2 equals 20%, etc. Yes, the All Ords rose
67% in 1983, and fell 40% in 2008 and rose 40% in 2009).
Three-year returns
Moving to a three-year horizon of annualised returns (that is, 1985 shows
total returns over 1983, 1984 and 1985, annualised) shows good years
regularly offset down years, such that over 90% of three-year periods
produced a positive result. Over the period, only the severe loss of the GFC
carries into other years.

Five-year returns
Similarly for five-year performance, now about 19 times out of 20, the All
Ords produced a positive result.

Canadian Total Returns over five years
The Australian economy has experienced almost 30 years of economic
growth (which will be punctured in 2020), so as a quick check on whether
the above numbers are an Australian miracle, here are the Canadian Total
Returns numbers for five years. There are no five-year losses.
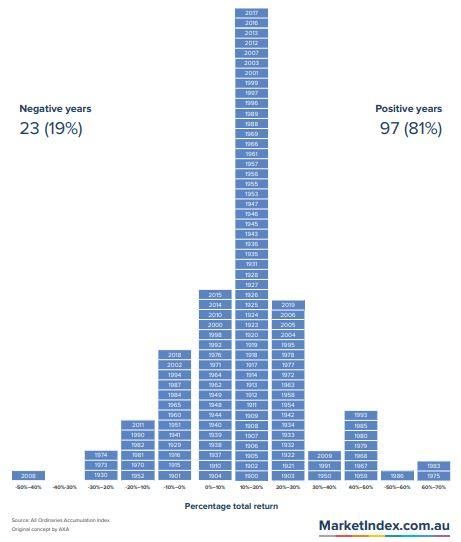
A longer-term perspective of 120 years
Taking the data back to 1900 shows annual returns are positive in 80% of
years, and the average annual return (nominal, not adjusted for inflation)
for the All Ords Accumulation Index is 13.2%. Remember that inflation has
reached double digits in the past so this number in no way reflects real
returns or the potential for the future.

Over this longer horizon, and measuring returns over a decade, Australian
shares have generated positive returns 100% of the time and 82% for US
shares.

All Ords Accumulation Index, annual returns for all years since 1900
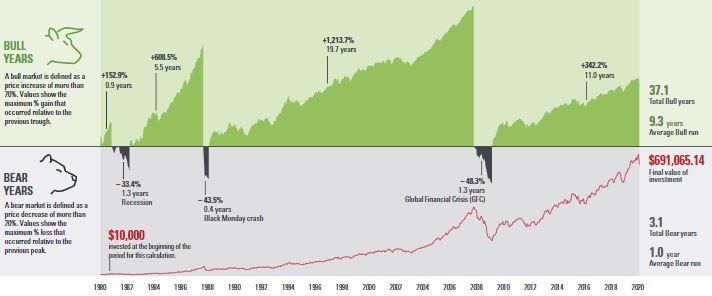
Bull and bear years since 1980
Finally, defining bull and bear years as 20% rises or falls in this Vanguard
chart of the All Ords index shows that in the last 40 years, persistence with
equity markets usually pays off. The bear markets have been much shorter
and shallower than the bull markets.

Is the past a prologue?
We will only know if this time is different when we look back in a few years,
and given the uncertainty in the market, there could be another leg down
from the recent drop. Taking history as a guide suggests those who do not
panic are likely to be rewarded over the long term.

Source: Morningstar
Past performance does not necessarily indicate a financial product’s future
performance.
You can also read