Indoor Air Quality, Environmental Tobacco Smoke, and Patron Perception: A Three Restaurant Case Study

Page created by Yolanda Benson
 
CONTINUE READING
Indoor Air Quality, Environmental Tobacco Smoke, and Patron Perception: A Three Restaurant Case Study
Indoor Air Quality,
                 Environmental Tobacco Smoke,
                 and Patron Perception:
                 A Three Restaurant Case Study
                     Roger A. Jenkins1, Douglas W. Peters2, and Beth Wilson3
                     1Oak Ridge National Laboratory, 2 Environmental Health

                               Management, 3Analytic Insight, Inc.

                  This research was sponsored by the Brown and Williamson Tobacco Company, Louisville, KY,
                             under contract no. ERD-99-01736 with the Oak Ridge National Laboratory,
                              managed by Lockheed Martin Energy Research Corp., Oak Ridge, TN,
                       for the U.S. Department of Energy under contract number DE-AC05-84OR9622464.

Presented at the 53rd Tobacco Science Research Conference, Montreal, Quebec, September 12 - 15, 1999
Indoor Air Quality, Environmental Tobacco Smoke, and Patron Perception: A Three Restaurant Case Study
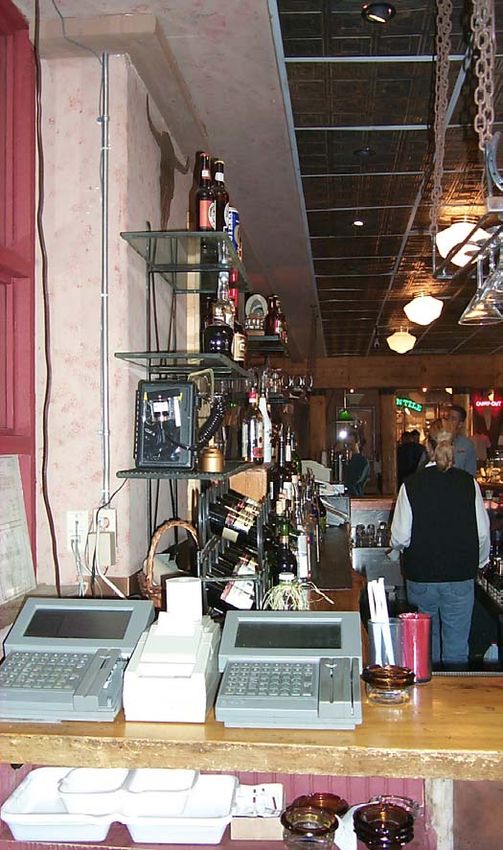
Objective
X Assess public perception to indoor air quality in
  three similar restaurants with somewhat different
  demographics.
X Measure common parameters for IAQ
  assessment.
X Determine extent to which IAQ could be
  improved with cost effective ventilation changes.
Indoor Air Quality, Environmental Tobacco Smoke, and Patron Perception: A Three Restaurant Case Study
Experimental Design
X   Measure IAQ/ETS components on
    five consecutive evenings, each of
    three facilities:
    smoking/non-smoking sections,
    selected components outside.

X   Conduct interviews of patrons,
    determine perception of air quality
Indoor Air Quality, Environmental Tobacco Smoke, and Patron Perception: A Three Restaurant Case Study
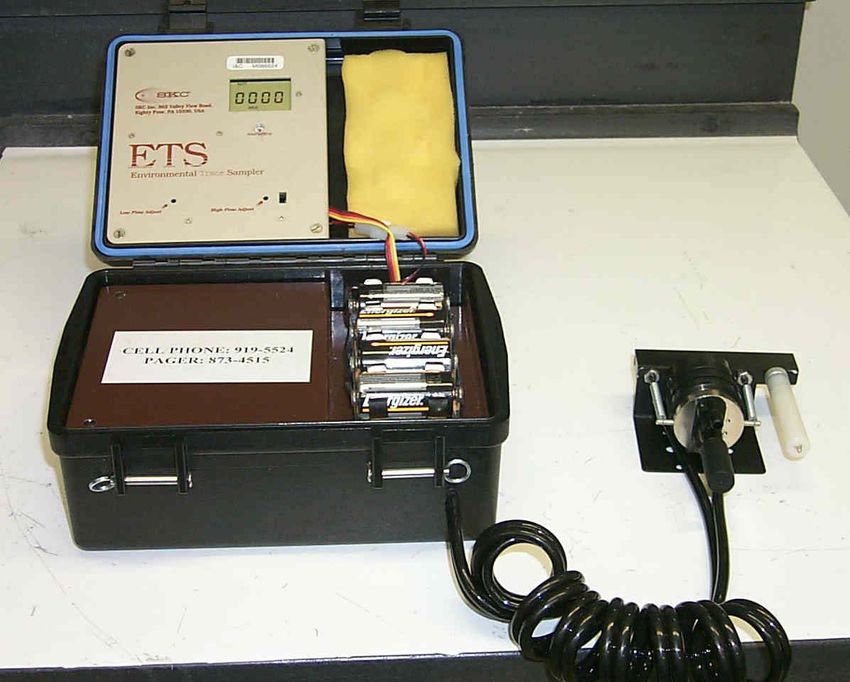
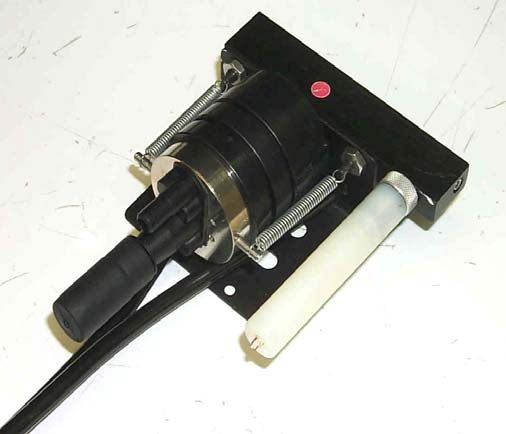
Sampling System is Same as ETS
Personal Sampler
                         Particle phase
                         collected on Teflon
                         membrane filter

                        Gas phase collected
                        on XAD-4 resin
Indoor Air Quality, Environmental Tobacco Smoke, and Patron Perception: A Three Restaurant Case Study
ETS Markers Used and
        Analytical Methods
X   Particulate Phase
    X   RSP (
Indoor Air Quality, Environmental Tobacco Smoke, and Patron Perception: A Three Restaurant Case Study
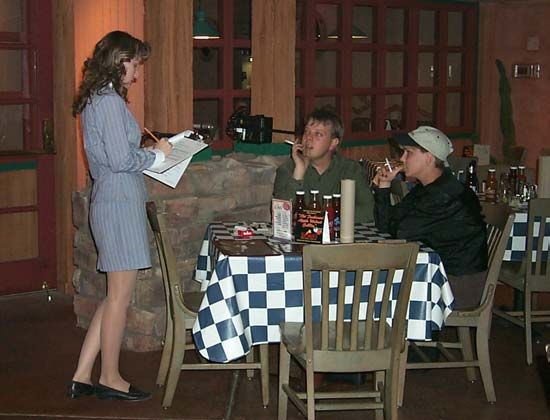
Additional Measurements
X Temperature, relative humidity
X Real time carbon monoxide and carbon dioxide.
X Inside and outside
Indoor Air Quality, Environmental Tobacco Smoke, and Patron Perception: A Three Restaurant Case Study
“Challenges”

“Recycled” air   External Sources
Indoor Air Quality, Environmental Tobacco Smoke, and Patron Perception: A Three Restaurant Case Study
Data Generated
X 80 Particulate samples, 80 vapor samples.
X 60 + hours of real time CO, CO2, temperature, RH
  measurements.
X 597 patron interviews
Smoking Status of those Interviewed

                                  60
Percent of Interviewed Subjects

                                  50

                                  40                                         Current Smoker
                                                                             Former Smoker
                                  30
                                                                             Never Smoker
                                  20                                         Don’t know

                                  10

                                   0
                                         Glendale   Ahwatukee   Scottsdale
 Compares with Arizona 1996 adult current smoking fraction: 23.8%
More than 10% of Interviewees Claimed
                                        Allergies to Smoke/Cigarette Smoke
Percent Claiming "Smoke" Allergy

                                   16
                                   14
                                   12
                                   10
                                    8
                                    6
                                    4
                                    2
                                    0
                                            Glendale    Ahwatukee    Scottsdale
Sampling System in Use
Limits of Quantification
       Constituent                 Limit of             Fraction of Real,
                                 Quantification,         Blank Corrected
                                    µg/m3              Samples at or Below
                                                              LOQ
RSP                                      35*                  50%
UVPM                                     11                     6%
FPM                                      1.82                    1%
Sol-PM                                   6.06                   48%
3-EP                                     0.17                  4%**
Nicotine                                 0.56                  35%**

*Problems with establishing LOQ for blanks      **No measurable blanks
CO2 Levels Do Exceed Standards
                          Friday, February 19th

                         1800

                         1600
CO2 Concentration, ppm

                         1400

                         1200

                         1000
                                                                    Inside CO2 Level
                          800
                                                                    Outside CO2 level
                          600

                          400

                          200

                            0
                           17:00             18:12          19:24             20:36

                                                     Time
Cumulative Distribution: FPM
                              100
Cumulative Distribtution, %

                               90
                               80
                               70
                               60
                                        Median: 22                 Median: 41          Non-smoking
                               50
                               40                                                      Smoking
                               30
                               20
                               10
                                0
                                    1            10                100          1000
                                                      FPM, ug/m3
Cumulative Distribution - SolPM
                             100
                              90
Cumulative Distribution, %

                              80
                              70
                                       Median: 4.2
                              60
                                                                Median: 8.5         Non-smoking
                              50
                                                                                    Smoking
                              40
                              30
                              20
                              10
                               0
                                   1                      10                  100
                                                     SolPM, ug/m3
Cumulative Distribution, 3-EP
                             100
                              90
                              80
Cumulative Distribution, %

                              70
                                     Median: 0.34
                              60
                                                          Median: 0.57        Non-smoking
                              50
                              40                                              Smoking
                              30
                              20
                              10
                               0
                                   0.1                   1               10
                                                    3-EP, ug/m3
Cumulative Distribution, Nicotine
                                  100
Percent Cumulative Distribution

                                   90
                                   80
                                   70
                                   60
                                            Median: 0.41              Median: 1.23         Non-smoking
                                   50
                                   40                                                      Smoking
                                   30
                                   20
                                   10
                                    0
                                     0.01         0.1             1          10      100
                                                           Nicotine, ug/m3
SolPM vs 3-EP in Smoking Sections
                 120

                 100
                           R = 0.876
                  80
  SolPM, ug/m3

                  60

                  40

                  20

                   0
                       0     0.5       1             1.5   2   2.5
                                           3-EP, ug/m3
SolPM vs 3-EP in Smoking Sections
                 120

                 100
                               R = 0.902
                  80
  SolPM, ug/m3

                  60

                  40

                  20

                   0
                       0   2     4    6          8     10   12   14
                                     Nicotine, ug/m3
Are the Phoenix Facilities Different?
                         Glendale      Knoxville
                         Smoking      Multiroom
                          Section   Restaurant-Bars
Median 3-EP, µg/m3         0.66          0.59

90th %ile 3-EP, µg/m3       1.38          3.09

Median Sol-PM:FPM           0.32          0.57
Ratio
Median Nicotine, µg/m3      1.25          1.15
Ratings of Overall Air Quality
                         70
                              94%          96%           96%
                         60
Percent of Respondants

                         50
                                                                    Excellent
                         40                                         Good
                         30                                         Fair
                                                                    Poor
                         20
                         10
                          0
                                Glendale   Ahwatukee   Scottsdale
Responses to: “Were you bothered by cigarette smoke
                                          at any time during your stay in the restaurant?”
% of Interviewees Responding "Yes"

                                     10
                                      9
                                      8
                                      7
                                      6
                                      5
                                      4
                                      3
                                      2
                                      1
                                      0
                                                Glendale        Ahwatukee        Scottsdale
Contribution from Other Sources?
X   ETS-derived particles as a fraction of all combustion
    derived particles: 25 - 40%
X   Levels of outside and inside CO are so low that trends
    can not be observed.
X   CO2: background not variable, and anthropogenic
    sources indoors have greatest influence
Observations and Conclusions
X   “Alteration” of smoking/non-smoking physical locations during
    tests complicates interpretation.
X   Large fraction of some ETS markers below LOQ.
X   ETS concentrations low: Median nicotine < 2 µg/m3 Median 3-
    EP < 1 µg/m3 Median SolPM < 10 µg/m3.
X   Patron perception of air quality was so good that it was deemed
    unnecessary to “improve” ventilation because an “improvement”
    was not likely to be detectable.
X   Presence of wood smoke may “mask” other odors.
You can also read