Math involved in Major League Baseball - By: Alexa Long
←
→
Page content transcription
If your browser does not render page correctly, please read the page content below

Math involved in
Major League Baseball
By: Alexa Long
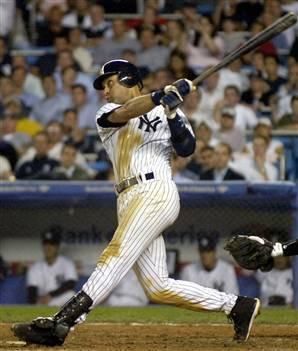
Batting Averages (Data Analysis as well as Operations) The batting average measures the performance of baseball players at the plate The batting average is calculated by dividing the amount of hits that season by the amount of ‘at-bats’ the player has received. A batting average can be calculated for a season, a career, a months span, or to see how a batter has done against a particular team or pitcher. A batting average can be a team or an individual statistic and is shown and read as a decimal Example: Derek Jeter’s 2012 Batting Average: .396 (36 hits / 91 at bats) Derek Jeter’s Career Batting Average: .314 (3122 hits / 9956 at bats)
Field Measurements (Measurement) The dimensions of a baseball field are very important to the game. The distance from the pitchers mound to home plate is exactly 60ft 6 inches, and the distance between each base is exactly 90ft The dimensions of a field determine factors such as how quickly one can run from base to base, or what is considered a fair or foul ball

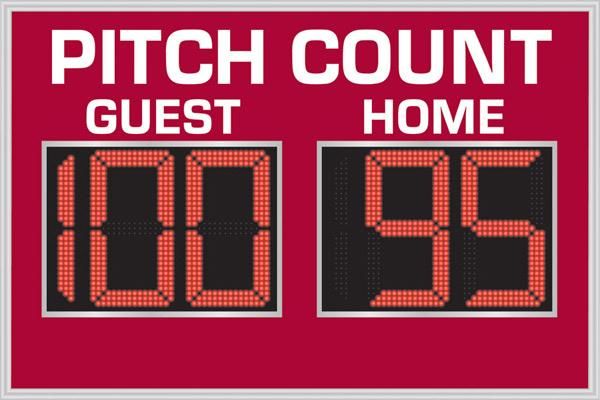
Pitch Count (Number and Operations) A pitch count is a statistic used to determine the number of pitches thrown by a pitcher in a game. Coaches of teams rely on a pitch count to show them when a pitcher needs to be taken out of a game, or how much longer they can last in a game. If a pitcher throws too many pitches, he will inevitably get tired and could possibly injure his arm. The less pitches a pitcher throws while getting batters out, the better.

Earned Run Average (ERA)
(Data Analysis as well as Operations)
A pitchers ERA is the mean of earned runs given
up by a pitcher per 9 innings pitched
An earned run is defined as a run that is not
affected by defensive errors, and scored solely
by hits/runners on base from the offensive team
An ERA is presented as a decimal
Example: Tim Lincecum 2012 ERA: 5.74 (17
earned runs, 26.2 total innings pitched)
Number of Games (numbers) There are 162 total games played in a Major League Baseball regular season The season begins on Opening Day and runs for 26 total weeks Teams that advance to the playoffs because of a certain amount of wins, will play more games than shown in the regular season schedule The amount of games played in the playoffs is also a result of wins and losses

Regulation Rules (Numbers) Regulation rules are what make the game of baseball There are 9 innings in a Major League Game 3 outs are needed in order to switch the teams from offense to defense There are 9 defensive positions on the field, and 9 batters allowed in the lineup
Individual Player Statistics (Data Analysis) Individual player statistics allow players and fans to determine how well or poorly they are producing during a season or for the entirety of their career. Individual player statistics can be batting average, ERA, total number of career hits, On-Base percentage, amount of Runs Batted In (RBI).. Etc Example: Josh Hamilton Individual Statistics: Career Batting Average: .311 2012 Batting Average: .388 Career Amount of Hits: 731 Career Amount of RBI’s: 449

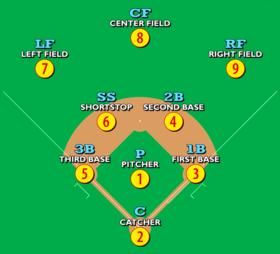
Position Numbering (numbers) In baseball, the defensive positions are given a number 1-9. These numbers are used by coaches, fans and statisticians alike to keep track of plays made in the field. For example: a double play made by the shortstop throwing to the second baseman who then throws to first base is a common play entitled the “6-4-3 double play” The numberings are as follows 1- pitcher 2- catcher 3- first base 4- second base 5- third base 6-short stop 7- left field 8- center field 9- right field
Position Numbering Guide
Reaction Time (numbers and operations) A batter’s reaction time is very important to the game of baseball because it determines how fast they need to react in order to hit the ball the pitcher is throwing A batter’s reaction time is based off of distance, velocity, and timing A major league pitcher is 60ft and 6inches away from home plate, and if he is throwing a ball 95 mph, that calculates into 139.33 ft per second. This means the batter has .434 of a second to decide whether he wants to swing the bat or not, as well as whether the pitch is appropriate to swing at
Win to Loss Ratio
(Probability)
Standings in Major League Baseball are important to the teams playing as well as the fans
The number of wins a team acquires is compared to the losses they will inevitably acquire
as well during the 162 game regular season
This is then translated into a ‘win percentage’ which is presented as a decimal but can be
looked at as a percentage as well.
This Win to Loss Ratio plays a significant part in the decision of which teams will advance
to the playoffs
Whether or not a team makes the playoffs based on their win to loss ratio, is a probability
problem
Example:
2012 Baltimore Orioles:
Wins: 14
Losses: 8
Win %: .636 (aka they have won approximately 64% of their games this year)
W/L Ratio: 14:8Fan Attendance (numbers and operations) The size of a stadium and seating determines the maximum amount of fans that can be present at a game There are thousands of people in stadiums at one time, whether they are fans, employees or players The amount of tickets sold shows how many fans will be in attendance at the games. The number of fans/tickets sold is usually based upon the success of the team and the organization as a whole Example: New York Yankees, Yankee Stadium Seating Capacity- 50,291 Seat width- 18 inches Seat length- 29.5 inches
Records
(Data Analysis)
Teams, as well as individuals, can hold statistical records in the game of
baseball
Statistical records show the success of the team or the individual, and where
they stand compared to other teams and individuals
When an individual player, or a a team, has a prominent statistic, they are
numbered and ranked among others who have excelled in that field.
Example:
The New York Yankees have won 27 World Championships.
They are ranked #1 in the amount of World Championships won, the #2 team is the St Louis
Cardinals with 11.
Example:
Derek Jeter has 3,122 career hits
He is ranked #19 in the all-time career hits record. The #1 amount of career hits is Pete Rose
with 4,256You can also read