Slavery in Arabia and east Africa, 1800-1913
←
→
Page content transcription
If your browser does not render page correctly, please read the page content below
Slavery in Arabia and east Africa, 1800-1913

                             Robert C. Allen

                        Working Paper # 0066
                             June 2021

           Division of Social Science Working Paper Series
    New York University Abu Dhabi, Saadiyat Island P.O Box 129188, Abu Dhabi, UAE

     http://nyuad.nyu.edu/en/academics/academic-divisions/social-science.html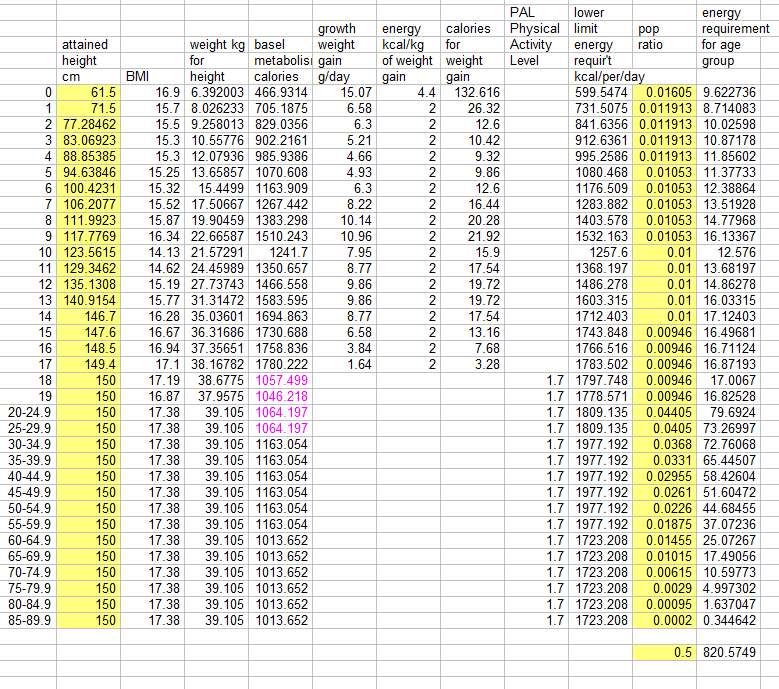
Slavery in Arabia and east Africa, 1800-1913

                       by

                 Robert C. Allen

Global Distinguished Professor of Economic History
             Faculty of Social Science
         New York University Abu Dhabi
        Abu Dhabi, United Arab Emirates

            email: bob.allen@nyu.edu

 NYU AD Social Science Working Papers No. 66

                      2021
Abstract

        Slavery in Arabia is usually regarded as benign in contrast to slavery in the Caribbean.
The difference is often explained in terms of cultural values and stress is often laid on the role
of Islam. This paper analyses this view primarily in terms of men employed in oasis
agriculture and pearling in Arabia in the long nineteenth century, although some attention is
also given to the situation of women. It is argued here that differences in the skill
requirements of growing sugar in the Caribbean and dates in Arabia, as well as differences in
the importance of self-supervision, explain the differences in the character of slavery. The
centrality of market forces in explaining behaviour is developed by analysing the supply of
slaves from Africa to Arabia and the demand for slaves derived from models of a date
plantation and a pearling voyage. The economic return to organizing date gardens, so that the
slaves have enough income to raise children is also discussed, and the interface between this
source of supply and that of newly purchased is analysed. A geo-referenced data base of
slave prices is developed and used to explore these issues. It is argued that Britain’s efforts to
suppress the slave trade, the division of east Africa among colonial powers, and state
development in Ethiopia drove long run increases in the supply price of slaves. The opening
of the Suez canal increased the demand price of dates after 1869, while rising incomes led to
an increased demand for pearls later in the nineteenth century. The increased prices of these
products increased the demand price of slaves. The evolution of demand and supply both
contributed to a long run rise in the price of slaves.

JEL codes: J47, N35, N55

key words: slavery, Arabia, date cultivation, pearling
In recent decades, the growth of the oil industry in Arabia has led to a great increase in
demand for labour. In the short run, the only way to meet this increase has been through
international migration. In countries with small populations and large oil exports, as much as
nine tenths of the population are foreigners. In countries with large populations, the
percentage of foreigners is smaller, and the growth of the local population through natural
increase is displacing them, as in Saudi Arabia today. Many of the foreign workers are in
weak legal positions and receive low wages by international standards. Comparisons with
slavery are often made.
         While the legal position of contemporary guest workers is better than slavery, the
comparison should be kept in mind in understanding the real slavery that existed in the past.
Frequently, Arabian slavery is judged to be benign in comparison to the slavery that existed in
the Caribbean in the seventeenth and eighteenth centuries. Indeed, the difference is great. In
the sugar plantations of the Caribbean, the work force was largely male (so reproduction was
impossible), the men were organized in centrally directed gangs and worked to death. Four
million slaves were shipped to the British West Indies and yet only 400 thousand were
present at emancipation in 1832 (Allen 2011, p. 70). In contrast, in Arabia many slaves
(especially women but also men) were treated as members of the master’s household. Males
working in agriculture and other productive activities had wives and children. Many slaves
were manumitted. These differences are often attributed to culture and the teachings of Islam.
         While Islam offered many reasons for treating slaves well, appealing to Islam as an
explanation is insufficient. People sort their cultural heritage and gradually abandoned parts
that are inconvenient. It took a few centuries–but only a few centuries– for instance, for
Christians to abandon prohibitions on loans at interest once the economy developed to the
point where financial markets made an important contribution to its operation. Why have
Islam’s injunctions regarding slavery routinely been honoured? I will argue the reason is that
they fit the economic needs of Arab slave owners in the past.
         To see what those needs were and how they might have been fulfilled, we need to
analyse the economic activities in which Arabs were engaged. I am here primarily interested
in the employment of men in Arabia in productive activities like agriculture, although I would
argue that similar incentives led to the similarly favourable treatment of male slaves
employed as soldiers, guards, or trusted deputies and, indeed, even to women in many cases.
         The main productive activity in which male slaves were employed from antiquity to
the twentieth century was oasis agriculture. Plants require water, and in Arabia water was
often found in oases. In some parts of Arabia, the water table was close to the surface and
erupted in springs forming natural oases. Farming could be extended easily in the vicinity of
springs since the water table could be reached with shallow wells, that could be dug by
individuals. The pre-eminent example is the al-Hasa Oasis, located about 60 km inland from
the Gulf near Qatar. With 2.5 million date palms, it is the largest in the world. Date palm
oases were located in many other parts of Arabia, where the irrigation issues were often far
more complex and expensive to resolve.
         An important feature of date cultivation is that it is highly skilled work and requires
considerable care for high yields of good fruit to be obtained. ‘Skilled’ in this context means
that it requires both execution and conceptualization. Execution means that the worker is
adept at a range of delicate tasks. Conceptualization means that the worker can organize the
work and, in particular, the timing of tasks, whose successful completion varies from tree to
tree and even from bunch to bunch depending on each tree’s growth experience. This need
posed two management challenges. The first was how to obtain skilled labour–indeed, any
labour. The second was how to motivate that labour to work attentively and responsibly to
increase production.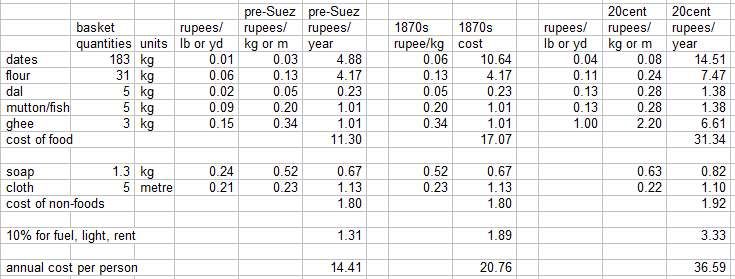
2

         These requirements were most acute during an export boom of which there have been
several in the history of Arabia. During a boom, date prices were high, and there were strong
profit incentives to expand production. More date palms and the irrigation to sustain them
were needed–how these investment requirements were met will not be comprehensively
discussed here–and more labour, skilled labour in particular, was required for cultivation.
Where would it come from? The best source was the natural increase of the existing
agricultural population since the best way to learn how to cultivate dates was to grow up on a
date farm and learn from one’s father. While this source (if properly supported) might
produce a steady growth in numbers, growth was slow and could not be accelerated in a short
time frame. Attracting labour from other parts of Arabia was not a viable option either.
Camel raising Bedouin were not inclined to take up farming. Settlement programs in recent
years to get them to do so have been failures. Their hardiness, group solidarity, and military
prowess meant that they “despise agriculture and [furthermore] know nothing about it.”
(Cole 1975, p. 160) The sheep herders were more flexible. In the north Arabian desert, they
often planted millet and returned later to harvest it, so they had some knowledge of crops and
more sympathy for them. “Within the space of a few decades, therefore, some villages in this
area [of Syria] passed through several stages: deserted or used only as summer camping
grounds until about 1870, then inhabited for a time by semi-sedentary tribesmen, and then
taken over by a landlord and cultivated on his behalf by share-croppers.” (Lewis 1987, p. 70)
This progression, often interrupted by reversions to pure nomadism, effected a transfer of
labour from the herding economy to the agricultural economy. Wilkinson (1977, pp. 190-1)
describes analogous shifts in Oman. In both cases, however, the operative word is ‘slow.’
Generations might be involved. Furthermore, it could be dangerous to existing land owners.
While a tribal group as a whole might slowly transition into an oasis if conditions were
attractive, it might do so by expelling the existing owners and taking over the oasis for itself
(Heard-Bey 1982, p. 198, Wilkinson 1977, pp. 189-99). This was not a source of labour to
react to a commodity boom.
         So the best source of more labour was international migration, just as it is today. The
slave trade functioned as a system of involuntary migration. Another advantage of slavery
was that it provided a labour supply that was free of tribal attachments and dependent on the
new slave owner and no one else. This dependence could be turned to positive loyalty if the
slave was well treated. Since a loyal, hardworking employee was the aim of the exercise,
good treatment was in the slave owner’s interest.
         Even if loyalty could be cultivated, the new slaves were not trained. This entailed
supervision costs that cannot easily be measured at today’s remove. The best way to mitigate
them, however, was to create slave families, so that the children of the slaves would provide a
skilled work force as they grew up. Stable slave families were in the interest of the slave
owner.
         The final management issue was how to incentivize the slave to work conscientiously
to maximize the value of production. This issue has been analysed on the theoretical plane by
Fenoaltea (1984). Fenoaltea’s model distinguishes tasks that are effort-intensive like digging
holes or harvesting sugar cane from those that are capital and care intensive like tending
animals, nurturing fruit trees, and gardening operations that require attention to the state of
individual plants. Fenoaltea argued that the former were best accomplished by gangs of
workers supervised by overseers and motivated by harsh physical punishments, while the
latter were best motivated by the absence of pain and instead rewards for good performance–
including eventual manumission. These considerations explain the difference between the
3

harsh treatment of slaves in sugar plantations, mining in both the classical world and the
Americas and large wheat growing latifundia in the Roman Empire, on the one hand, and the
benign treatment of slaves who were skilled craftsmen in Roman cities, slaves raising cattle
on Roman farms and the disappearance of slavery on Roman farms cultivating grapes and
olives.1 Our argument is that the cultivation of dates was like the cultivation of grapes and
olives and was the kind of activity that was most successfully accomplished when slaves were
rewarded for their efforts rather than driven by the lash. In Arabia, share contracts provided
the rewards. Since manumitted slaves remained dependent on the former owners and
continued to work on the same farms on the same terms, manumitting the slaves was not a
costly gift and might, indeed, secure more enthusiastic effort, which would benefit the former
owner.2

Early history of slavery

         These arguments will be developed in this essay by analysing slavery and the slave
trade, mainly on the eastern side of Arabia in the ‘long nineteenth century,’ from 1800 to the
First World War. More detailed information is available about slavery in this period than for
earlier times, although the nineteenth century evidence is limited compared to that for slavery
in other parts of the world at the same time. I begin, however, with two earlier, less well
documented examples of slavery, since they reveal some long run tendencies and recurring
patterns.
         I concentrate on the coast from Bahrain to Oman. While the aridity of the climate
implied a small population and that, in turn, meant that Arabia was never large enough to
significantly affect neighbouring civilizations like Mesopotamia, the reverse was not true.
Developments abroad created opportunities for trade that could lead to dramatic changes in
population, economic activity, and society overall. The process was straight forward: The
foreign demand for dates rose. As a result, the price in Arabia also rose, and there was a
corresponding incentive to expand production. More production required more labour, more
date palms, and more irrigation. Sometimes the need for capital could be met by local efforts
and sometimes it led to state action. The need for labour led to a demand for slaves when the
demand was so great that it could not be met by the local population. This pattern has been
repeated at least three times.
         We know the least about the earliest example, and so our account is highly

       1
        See Scheidel (2008) and Temin (2013, pp. 114-38) for discussions of this model in
the context of ancient Rome and other societies.
       2
          Dari-Mattiacci (2013) has proposed a similar model that emphasizes ‘asymmetric
information,’ that is, the slave knows more about what he is doing and how hard he is
working than does the master. This model leads to similar conclusions. This model comes
into its own in the context of pearling where it will be discussed. Since the slave owner can
observe the date harvest, however, which determines his income, I am not sure why it would
be important to him to know what the slave did during the year. However, one issue that
Dari-Mattiacci’s does illuminate is the slave master’s educating young slaves. Since the slave
does not have the option of quitting, the slave owner realizes the return to educating the slave
over the slaves’s life, and that increases the incentive to provide education.
4
speculative, but suggestive of later instances. This example concerns the al-Hasa oasis in
eastern Arabia and adjoining oases in neighbouring Qatar and Bahrain. This district has
exported dates for centuries. The earliest remains of cultivated dates in eastern Arabia were
found on Dalma Island in the UAE and dated to about 5000 BC. They have been cultivated
ever since although locations are sketchy, and the nature of the agrarian system is the subject
of considerable debate (Cleuziou and Costantini 1980, Charbonnier 2017, 2018). We posit
that there was an increase in production that began in the seventh century in response to
events in Iraq.
Southern Iraq has been a major date producer for millennia. Date palms were
extensively planted in ancient times on the banks of rivers and canals in Mesopotamia. “The
levees are optimal areas for the cultivation of a wide variety of crops, including date palms, in
the shadow of which smaller fruit trees, cereals, legumes and vegetables can be grown. Date-
palm shade creates a micro-climate of cooler than average temperature and higher than
average humidity, and the rooting system of the date-palm stabilizes the soil, improving
permeability and structure.” (Potts 1997, p. 17) This production system was deranged by the
great flood of 628 when the Tigris burst its banks and shifted its course, in the process
inundating much of southern Iraq (Christensen 1990, pp. 73-5). Reclaiming land was a
lengthy and expensive process. Al-Tabari reported fifteen thousand slaves clearing land in
southern Iraq in the ninth century. Conditions were so deplorable that they led to a
formidable rebellion that lasted years–the so called Revolt of the Zanj (Popovic 1976) The
flooding most likely destroyed many date-palms, reducing date production in Iraq, and
subsequent events like the civil wars of 861-70 and the Zanj Revolt (869-883) and continuing
unrest prevented recovery. If so, prices would have risen, and this increase would have
stimulated the expansion of date cultivation in al-Hasa and Bahrain.
The increase in date production required more labour and more date-palms. Because
of the closeness of the water table to the surface, the extra water needed was obtainable with
shallow wells, and massive state investment was not required as in other cases. The increased
labour supply might have come from population growth (bound to be a slow process).
African slaves were the only immediate source of supply. Indeed, the most specific piece of
evidence of about this period is an eleventh century report by Nasir-I Khusraw in his book of
travels. He reported “thirty thousand Zanzibari and Abyssinian slaves working in the fields
and orchards” of the al-Hasa oasis. (Reilly 2005, pp. 58-9, 126-7, 130).
What became of the slaves? Much is unknown. The likely trajectory is that they
became free and remained on their farms as sharecropping tenants. They intermarried with
Arabs, so their descendants are today visually indistinguishable from other Arabs. However,
they differ from most Arabs in that (a) they are Shiite muslims rather than Sunnis, and (b)
they are not members of traditional tribes. Instead they constitute recognized groups–the
Baharinah in Bahrain and the Hawaiyah in the al-Hasa oasis. Most significantly, however, (c)
serological studies show the wide spread prevalence of the hemoglobin S gene and Duffy-
negative antigen. Both confer immunity to malaria and are markers of African ancestry.
They indicate that Africans were the forebearers of the Shiite population of eastern Arabia.
(Reilly 2005, pp. 58-9, 126-7, 130).
We have more documentation about a second great boom, which occurred in Oman in
the seventeenth and eighteenth centuries. It was preceded by a millennium of chaos in the
region. Between 550 BC and 651AD, Oman was administered by the Achaemenid, Parthian,
and Sassanian empires. Wilkinson (1977, pp. 122-36) has argued that most of the falaj
irrigation in Oman was built by the Persians in this period, and dates would have been a5
major crop grown on fields watered by them. Conversion to Islam in the mid-seventh century
led to a revolt that drove out the Persians. During the eighth century, the Imamate was
established in central Oman under which an imam was elected spiritual, political, and military
leader. They provided direction but not administration, and Oman became a collection of
feuding tribes. When Portugal expanded its possessions in the Indian Ocean in the early
sixteenth century, it met little resistance in Oman and occupied all of the major ports, thus
isolating the interior from the coast. The empire did not last long as it came under assault by
the English and Dutch East Indies Companies as well as local nationalist groups. The fall of
the Portugese fort in Hormuz in 1622 to a combined English-Persian force was a turning
point (Steensgaard 1974). It was followed by the election of the first Yarubid Imam in 1624.
This dynasty ruled the country until 1742. The Yarubids did what earlier Imams had failed to
do. They gradually recaptured all of the cities and forts occupied by the Portugese and re-
united the country under an administration that had enough capacity to end tribal strife and
provide infrastructure.
The result was another boom in date production. It is unfortunate that records of the
prices of dates and dibs–the sweet liquid that could be pressed from the fresh fruit–around the
Indian Ocean have not survived in the early modern period. Prices would show whether
demand was rising in India, for instance. It is clear, however, that demand was rising in the
interior of Oman. Reuniting the country and establishing domestic order opened up foreign
markets and cut transport costs to Suhar, the leading port for exports.
The rise in prices in the interior made it profitable to plant date palms and construct
the presses to produce dibs in places as far inland as the Buraimi Oasis in al-Ain (Power and
Sheehan 2012). Expansion took place across Oman. In 1696, John Ovington (1696, p. 423)
reported that “the Staple Commodity of the Country is Dates, of which there are whole
Orchards for some Miles together. They have so much plenty of this Fruit, for which they
have so ready a vent in India, that several Ships are sent thither loaded from hence without
any other Cargo.” The Yarubid government played a pivotal role, for it financed the
construction (or re-construction according to Wilkinson 1977, p. 126) of falaj irrigation
schemes across the country.
[The Imām Sayf b. Sultān al-Ya)rubī] improved a large portion of Oman by
making water-courses and planting date and other trees… he had acquired one-
third of all the date-trees in Oman [over the course of his reign, c. 1692-
1711]… he repaired the al-Sāyighy canal at al-Rastāk, the al-Yazīly in the
Zāhira, the al-Kūthir at al-Hazm, and the also the Barazamān and al-Misfāh
canals… [He] planted at Na)mān Barkah 30,000 young date-trees and 6,000
cocoa-nut trees, besides which he planted at Bi(r al-Nashwa, al-Rāssa and al-
Mandzarīya. (Power 2018, p. 230, who annotated it.)
Building the falaj systems represented a major investment. “For falaj systems to be
introduced it is argued that first: there should be sufficient demand for crops to warrant the
expenditure upon the construction, and second: there should be enough capital available,
either from the government, shareholders or individual landlords to fund construction.”
(Costa and Wilkinson 1987, p. 78). The return on the investment came through a rise in the
value of oasis properties, and a significant share accrued to the Imam as a property owner.
The gains were distributed somewhat more widely including relatives of the Imam, as well as
merchant groups, who also bought oasis real estate. Land values were pushed upwards and6
protected as new crops were introduced to cultivators, and villagers were encouraged to
undertake the falaj maintenance work (Wilkinson 1977, p. 126).
The investment and subsequent increase in production required a bigger work force.
Population growth in response to higher labour incomes was one possible source, but it would
be a long time coming since it took close to two decades to produce another worker. A
reallocation of labour from herding to agriculture was another possibility, but it was bound to
be slow as well.
Slavery was the solution to the labour supply problem since slaves were available in
elastic supply at a low price in east Africa. Zanzibar had been a Portugese possession since
the early sixteenth century, and it was the major export point for slaves. After the Omanis
expelled the Portugese, they expanded their own possessions in the Indian ocean and in 1698
conquered Zanzibar and Mombasa, thus internalizing the slave trade. In 1811, it was
estimated that 6 - 10 thousand slaves a year were exported from Zanzibar. Around 1840
another estimate has it that one third of Oman’s population were black slaves (Power 2018, p.
231), and in 1902 that all of the work in the date gardens in the Buraimi Oasis was done by
black slaves who amounted to half of the population (Zwemer 1902, p. 62).
nineteenth century globalization
The third example concerns the impact of globalization on the Gulf and Oman during
the long nineteenth century (1800-1913). We have more information, particularly numerical
information, on some (but not all) of the key issues, so it warrants research.
The Gulf includes two important industries in which slaves were employed. One was
date farming as in our previous examples. There were important oases in Oman, al-Ain in the
UAE, Bahrain, and al-Hasa. Dates were consumed locally and many were exported to India.
The second industry was pearling. Pearls were harvested in the oyster banks off the present
UAE, Qatar, and Bahrain as well as on the Persian side of the Gulf. The pearls were sent first
to Bombay, and from there they might be shipped anywhere. Slaves formed an important part
of the labour force of both industries, although they were not employed to the same extent in
all districts.
Understanding slavery requires us to pay attention to both the demand for slaves and
their supply. The demand for slaves derived from demand for the commodities that they
produced, so I study the prices of those commodities and how the technology of production
and the prices of related items affected what producers found it profitable to pay for slaves.
The supply of slaves included new slaves imported from Africa as well as the children of
slaves already present in Arabia. In the next section I begin with supply.
The International Slave Trade
There were two main branches of the slave trade between Africa and Arabia. The first
was the so-called Swahili coast. The second was Ethiopia.
The Swahili coast was a long standing source of slaves. Africans captured other
Africans in the territory of present day Kenya, Tanzania, and Mozambique as well as in
Madagascar. The slaves were then marched or shipped to export ports. Zanzibar was the
biggest, but others like Mombasa and Kilwa were important (Vernet 2009).
There was an extensive trade between Oman and Zanzibar. Dhows left the Gulf in
September or October loaded with dates, which they carried to ports along the south Arabian7
coast and east Africa. In Zanzibar they sold their remaining cargo and purchased, timber
(poles cut in mangrove swamps), ivory and slaves. In April or May when the winds shifted,
they returned to Oman with a month’s sail and arrived at Gulf ports a few weeks later (Agius
2005, pp. 113-4, 126).
Ethiopia was the second major source of slaves. In the eighteenth and much of the
nineteenth century, the country was divided into an array of small kingdoms and polities, and
the Emperor was a mere figure head. For much of the time, the country was cut off from the
sea. Beginning in the nineteenth century, several leaders expanded their territorial control,
but they process proceeded slowly with many setbacks. In 1889, Menelik II, who had been
king of Shewa, which includes Addis Ababa, the city he founded 1886, became Emperor and
united much of central and northern Ethiopia. Thereafter, he expanded his control over the
southern part of the country.
Menelik’s wars in the 1880s and 1890s generated many captives who were sold as
slaves. Raiders from his more organized state took many more captives in the less organized
South, who joined the long march to export ports where they were shipped to Arabia. The
ports included Massawa (Mitsiwa) in the north that serviced Jeddah, Assab across the Red
Sea from Mocha, Tadjoura in what is now Djibouti, and Berbera in Somalia on the Gulf of
Aden that was the main shipping point to Muscat.
The purchasers of slaves in Arabia drew a number of distinctions that were reflected
in prices. In the first instance, prices depended on age. Children were in demand, especially
for domestic roles, but peak prices were realized on slaves in their mid teens since they could
work as adults and had longer lives ahead of them than older slaves. Adult males who had
been reared as slaves in the owners’ household were often educated and placed in roles
requiring trust. Men were purchased as agricultural workers. Eunuchs commanded very high
prices. Women were divided into two groups. Many were assigned menial domestic roles
and fetched relatively low prices. Attractive women became concubines or wives and
commanded very high prices. This was especially true if they were Gallas–a pejorative term
indicating Oromo slaves from southern Ethiopia. Gallas were light skinned and considered
particularly attractive.3 They were also regarded as especially hard working and trustworthy.
The west to east direction of the slave trade suggests that slave prices would have
been higher the further east they are observed since greater transport costs would have been
incurred in shipping the slaves there. This expectation is, indeed, confirmed by data. Several
historians have studied the slave trade and compiled lists of slave prices from Zanzibar and
Ethiopia to the Gulf. I have combined these to form a larger data set. In many cases, the
original sources have been consulted to clarify the information recorded. This has been a
valuable exercise since in many cases more information is available than has been previously
transcribed. The prices are not derived from the statistical analysis of samples of prices, but
are rather someone’s impression of the ruling price in the market. Examining the sources
makes the variation in data quality abundantly clear. British naval officers surveyed the
coasts of Arabia and wrote systematic and detailed reports that evince considerable numeracy.
Some European travellers and explorers shared the same outlook. Others were casual in the
treatment of their numbers. Where a choice can be made I prefer the report of the naval
officer to that of the idle wanderer who lacked a head for numbers. Despite these caveats, the
3
Testimonials to the beauty and character of Galla women include Beke, (1852 p. 22)
and Southworth (1875, pp. 349-50).8
data as a whole present a coherent picture.
Since, as noted, slaves sold at very different prices depending on gender, age, and
other attributes, the data are broken down in these terms. The data have also been divided by
time period. There is no apparent time trend in prices before the 1870s. Afterwards they rose
in part because of the depreciation of silver and in part for other reasons we will discuss.
(Prices were quoted in Maria Theresa dollars or rupees, which were silver coins.) By the late
nineteenth century prices had more than doubled. I distinguish two time periods in the
analysis–one before 1870 with most observations in the 1830s and 1840s and one from the
1890s to the First World War. Many categories lack enough observations for analysis.
Figures 1 to 3 map prices for young adult men, young adult women purchased as
domestic servants, and young adult women purchased as concubines or wives. The figures
for men show the main geographical patterns. In Figure 1, the price was low in Zanzibar.
This was the main source of slaves for Oman and the Gulf where prices were higher.
Unfortunately, we have no prices for slaves in the hinterland of Zanzibar. We can, however,
observe the price structure across the whole supply chain for Ethiopian slaves. Prices were
lowest in southwestern Ethiopia in what are today the Oromia Region and the Southern
Nations, Nationalities, and Peoples Region. These were the areas to the south of the
consolidated empire that Menelik II put together in the 1880s. The Southern and the Oromia
Regions were at war with Amharic armies and raided by slave traders through much of the
nineteenth century. It was a major source of slaves, and prices were lowest there. Prices
were higher in central Ethiopia where captives were first taken and then higher still in the
direction of export at Berbera on the Gulf of Aden, Massawa on the Red Sea, and Khartoum
on the Nile. Prices were highest on the eastern shore of the Red Sea at Jeddah and Mocha.
The prices of female domestic servants (Figure 2) had the same pattern, although the prices
were higher in Khartoum, Mecca, and the Gulf than they were for men. We lack prices for
concubines (Figure 3) in southwestern Ethiopia, but otherwise the data show the increase in
price with distance from that region and even higher prices in Mecca and the Gulf than those
realized for female domestics.
Figures 4-6 repeat these comparisons for the late nineteenth/early twentieth century.
All show the same increase in prices from the source. What is most striking is the overall
increase in prices compared to the 1840s. So far as eastern Arabia is concerned, prices in
Muscat were five times higher than in the 1840s and in the Gulf almost ten times higher. In
Zanzibar, the main port supplying this region, prices had risen more than three fold. In
Ethiopia, the cheapest price observed in the southwest region ($10) was two and a half times
greater than the cheapest price in the 1840s. Many prices in central and northern Ethiopia
were similarly inflated, and prices in Jeddah and Khartoum were much higher. Prices of
female slaves were also inflated, but the data are not as abundant as for men. Moreover, the
impression is that the geographical price structure was not as uniform as it was in the 1830s
and 1840s.
We can learn more by analysing the price patterns statistically. The strategy is to
measure the distances that would have been travelled from the source of the slaves to the
places where prices are quoted. Regressions of destination price on distance are then
estimated. Regressions of price on land and sea distance have been estimated, but the
specification is not very revealing for the sea voyages for which the data are very sparse and
irregular. Sea voyages will, therefore, be separated from land journeys. The investigation of9
overland costs is thus confined to Ethiopia with occasional observations for the Sudan.4
Overland distances between points are ascertained in two ways. Some distances
between major cities in Ethiopia, Somalia, and Eritrea were taken from the distances of
modern major driving routes. These were checked against descriptions of caravan routes (e.g.
Beke 1844), which were often somewhat obscure, to make sure that the modern route
followed the old route. In many cases, this procedure was not possible, and distances were
worked out from road maps. To do this, all data were entered in QGIS. A shapefile of
modern, local roads in Ethiopia was added.5 I assume that modern local roads followed
ancient routes since in both cases the roads traverse the same geography and were probably
built as inexpensively as possible. In addition, modern roads probably connected settlements
that were established in accord with older roads. The distance measuring tool in QGIS was
used to measure the distance along a path of local roads connecting the settlements in
question.
I begin with male slaves, for whom the data are most extensive. Table 1 shows
regressions of pre-1870 and post-1890 prices on distance from the point of capture in
southwest Ethiopia. A simple linear regression fits the data quite well with a very high R2
(.83) in the early sample and a lower R2 (.59) in the later. In the third regression the samples
are combined and the intercept and distance variables are interacted with a dummy variable
distinguishing the periods in order to test the significance of differences in the slope and
intercept. The intercept is significantly higher in the later period than in the first, while the
hypothesis that the slope coefficients are the same cannot be rejected. The implication of the
regressions is that the cost of shipping male slaves over land was about 2 cents per kilometre
throughout the nineteenth century. The larger value for the intercept after 1890 indicates that
slaves were more expensive to capture in southwest Ethiopia than they had been in the middle
of the nineteenth century, and this raised their price of slaves all along the route to the Red
Sea and Sudan by the same amount.
Table 2 reports the results of the same specifications for the price of concubines. The
value of the intercept, which equals the price where they were captured, is badly estimated in
all cases. This is probably due to the fact that only one observation is in the southwest part of
Ethiopia, so the intercept is an extrapolation from distant prices. What is most surprising,
however, is the comparatively large size of the coefficient on distance, which indicates that
concubines cost about 10 cents per kilometre to transport to the coast. The explanation may
be that they received special treatment, so that they arrived in Arabia in pristine condition.
This included being treated as a wife of the chief slaver, a dubious distinction, and getting
better food, her own hut each night, and the chance to ride a mule rather than walk for the
many months journey (Beke 1844, pp. 20-1). All of this cost money. While the result is not
statistically significant, the regressions do suggest that female slaves, like their male relatives,
were more expensive to capture at the end of the nineteenth century than they were earlier.
We can also say something about the cost of sea voyages, but there are not enough
observations to model the relevant variables in a regression framework. Instead, we report
the results of dividing the increase in price over the route (eg the price at Muscat minus the
4
A couple of observations on the upper Nile led to attempts to estimate cost per
kilometre on rivers, but the data were too few to reveal any pattern.
5
The ‘roads’ file on https://mapcruzin.com/free-ethiopia-arcgis-maps-shapefiles.htm10
price at Zanzibar) by the sailing distance between the ports.6
Table 3 shows the results. Several points stand out. I begin with the 1830s and 1840s
and consider men, for whom we have the fullest information. First, the cheapest routes by far
were those from Zanzibar to Muscat or the Gulf. The cost per kilometer ($.002) is about one
tenth that of overland transport in Ethiopia ($.02–see Table 1). Second, the rate per kilometer
on the route from Berbera on the Somali coast to Muscat and the rate from Muscat to Gulf
destinations ($.01) was five times higher than the Zanzibar routes. Why this was so is a
mystery. These were long routes, although not as long as Zanzibar-Muscat. Third, the most
expensive routes were those in the Red Sea between Ethiopia and Arabia. They were in the
range of $.04-.06 per kilometre. These were shorter than the others, which may have
contributed to higher costs, and sailing conditions in the Red Sea may have been less
auspicious. They rates for concubines were notably higher than the rates for men, as in the
case of land transport, perhaps for the same reasons.
Unlike land transportation, the cost of sea transportation was far higher at the end of
the nineteenth century than it had been in the 1830s and 1840s. Rates per kilometre for male
slaves shipped from Zanzibar and Mogadishu were almost ten times greater around 1900 than
they had been half a century earlier. The rate from Muscat to the Gulf was fifteen times
higher. Rates on Red Sea shipments had also advanced but to a lesser extent.
Shipping rates like any prices set in competitive markets depend on both supply and
demand. In this case, however, supply factors look like the principal determinants. Three
political factors lay behind the increased shipping costs. First, Menelik II consolidated his
control over southern Ethiopia, so the wars ended, and he decided to suppress slave raiding
there. This may have been due to British pressure but also reflected the view that a
productive agriculture would emerge if the people had peace and security, and taxes on
agriculture would generate more revenue than taxes on slaving (Fernyhough 1989). The
policy was not well enforced, so slave captures continued (Pankhurst 1968, pp 99-107), but
the price of newly captured slaves rose–hence, the rise in the intercept in Table 1. Slavery
itself, moreover, was not suppressed, so there was no marked increase in the rate per
kilometre of moving slaves across Ethiopia. Second, the occupation of the east African coast
by European powers after the Congress of Berlin in 1884-5 led to the suppression of slaving
on land. The result was the sharp rise in the price of slaves in Zanzibar, still controlled by
Oman. Third, the efforts of the Royal Navy to suppress the slave trade in the Indian Ocean,
Arabian (Persian) Gulf, and the Gulf of Aden was the probable cause of the rise in shipping
rates by sea shown in Table 3. “Great Britain’s Slave Trade Agreements with the Sultan of
Muscat and Trucial Chiefs of 1845, 1856 and 1873, followed by considerable British Naval
activities, practically put a stop to imports from overseas and to open slave markets in local
ports, but they have not succeeded in suppressing local slave usage.” (Thomas 1931, p. 237).
The effectiveness of the Navy’s efforts have been debated by historians.7 While the evidence
points in contradictory directions, the apparent dramatic rise in shipping costs suggests that
flying the flag may have been enough to reduce shipping and raise costs.
6
Sailing distance was normally taken from www.sea-distances.org.
7
Reilley (2015) surveys the debate and argues that the price history indicates that
naval patrols were ineffective.11
A Model of a Date Growing Village
While we have argued that the price at which slaves were supplied to eastern Arabia
depended mainly on the costs of capturing and transporting them from the interior of Africa,
someone had to be willing to pay the delivered price for the trade to operate. Who was
willing to pay the prices for men in Figures 1 and 4 and why? The answer depends on the
price of dates (and pearls) since that is what the slaves produced. Date prices rose sharply in
the 1870s, and that unleashed a date boom that led to Africans being imported for oasis work.
The demand pressure from dates lapsed thereafter, and pearling then became the activity that
generated the high demand for slaves, as we shall see.
Date prices rose in the 1870s because of the opening of the Suez canal in 1869.
Before then trade between eastern Arabia and Europe or America was limited and involved
only a few ships (mostly American) every year (Hopper 2015, pp. 51-60). With the opening
of the canal, the shipping distance to the north Atlantic was cut and with it the cost of
transport. The price of dates doubled in the Gulf. The prices of all varieties moved together,
and Figure 7 shows the history of the price of Sayr dates in Basra. This was the best selling
variety. Unfortunately the data are patchy with 1873 being the only year in that decade
represented. Nevertheless, its price and those in the 1880s were double most in the 1860s.
The highest price in the pre-Suez period was in 1866. It is as high as the later prices, but it is
the exception that proves the rule, for 1866 was a year of exceedingly low production: “When
the dates were about the size of currants, swarms of locusts made their appearance in this
district and destroyed such quantities of the fruit that the total yield was less than 30,000
tons–about half that of ordinary years.” (Basra consular report 1867-8, p. 34) In a normal
year production was much larger and prices were lower than after the opening of the Canal.
Higher date prices led to greater exports and production. Before the Suez Canal was
opened, 57 thousand tons of dates were produced in Iraq of which half (28 thousand tons)
were exported (Bussorah report, 1867, p. 256). Exports topped 57 thousand tons in 1887 and
hit 75 thousand tons in 1913 (Basra reports). Total production in the early twentieth century
was on the order of 139 thousand tons.8 A two and a half fold increase in production would
have led to a correspondingly great increase in the demand for labour in the date gardens. In
addition, complementary investments in date palms were occurring, although their magnitude
is hard to quantify. In Oman in 1884 “the American date trade is rising in importance and
yearly increasing...The particular sort of date required for the American market is the ‘fard,’
and the demand for it raised the value to such an extent that the Arabs are now beginning to
plant this kind in their gardens to the exclusion of others.” (Persian Gulf Residency and
Muscat Political Agency Administration Report 1883-4, p. 148).
Who would do that work? In particular, was it worthwhile buying slaves for work in
date gardens either before or after the Suez canal was completed? We can make some rough
calculations to answer that question with a model of a date plantation. These calculations are
not definitive since we must assume values for some variables about which we have little
information, but they are suggestive of the incentives in play.
Date gardens required a substantial supply of water. Sometimes that came from
natural springs or shallow wells when the water table was near the surface. The outstanding
example is the al-Hasa oasis. Often, however, more substantial irrigation was required. The
8
Lorimer (1915, p. 2298) reports 3.48 million date palms in Iraq. At 40 kg of dates
per tree, production would have been 139 thousand tons.12
Buraimi oasis at al-Ain on the UAE-Oman border is watered by at least nineteen aflaj that
bring water from the surrounding mountains. The aflaj are many kilometers long and
required substantial investment to construct (Power and Sheehan 2012, pp. 292-3).
There is a debate amongst archaeologists as to when and where the falaj (or its cousin
the qanat) was invented. Wilkinson (1977, pp. 122-136) argued for invention in Persia,
where qanats are widespread, and their introduction into eastern Arabia during the centuries
of Persian domination. Other archaeologists argue that invention was in Arabia with
diffusion to Persia.9 There is also a related debate as to when the aflaj were constructed with
Wilkinson arguing that all aflaj in eastern Arabia were built by the Persians since the Persian
empires were the only institutions that had the resources to build them. After the Persians
were driven out in the seventh century CE, many irrigation systems were abandoned. The
subsequent appearance of a falaj indicated the refurbishment of a Persian original rather than
something built from scratch. This view has been disputed in the case of the Buraimi oasis by
Sheehan and Power (2012, pp. 297-303) who contend that the aflaj of that oasis were new
constructions in the seventeenth century. Similar arguments were made for Balad Seet, Oman
by Nagiev et al (2004) and Siebert (2005, pp. 156, 171,175).
In the absence of general statistics that might guide us in developing a model of date
production in Arabia, I have based analysis on detailed surveys of oases in Oman conducted
as part of the German-Omani project “Transformation processes in oasis settlements of
Oman”10 as well as an agricultural census of the al-Hasa oasis in Saudi Arabi (Abu-Bakr
1976). A particular focus is the oasis in Balad Seet, Oman, whose history has been studied in
detail by Nagieb (2004), Nagieb et al (2004), and Siebert (2005). This was not a large oasis.
At its peak in the 17th to 19th centuries, it had 7.6 hectares of land planted with date palms.
They were the primary beneficiaries of the village’s aflaj. A further seven hectares were
cultivated with wheat and alfalfa. This land was irrigated with run off water from the date
palms during the winter when water levels were highest. The date trees were intercropped
with fruits and vegetables. In the absence of any specific information, I assume they were
tomatoes, cabbage, cucumber, egg plant, and onions. For our nutritional analysis, it makes
little difference exactly what vegetables or fruits were grown.
Table 4 summarizes the land use and cropping pattern.11 In addition to crops, sheep
and cows were also kept by the villagers (Wilkinson 1977, pp. 27-8). I assumed that there
were about half as many cows as households. The sheep flock was the number that could be
fed after deducting the feed consumed by the cows. The animals generated milk every year as
well as occasional meat as superannuated animals were slaughtered. The sheep also gave
wool, which was made into the village’s clothing.12
9
In addition to Wilkinson (1977), the debate includes English (1968), Goblot (1979),
al-Tikriti (2002), and Boucharlat (2001, 2003).
10
http://www.oases-of-oman.org/sites/project.htm
11
The starting point for this reconstruction was the similar reconstruction of Balad
Seet by Siebert (2005, pp. 161-2) and Nagiev et al (2004).
12
The 74 sheep would have produced about 74 kg of wool each year, and that, in turn,
would have made perhaps 222 metres of cloth. Divided by the population of 174, the village
wool supplied 1.3 metres per person. This was a scanty supply of cloth, but it should be born13
The table also shows the disposition of the farm production. The alfalfa was fed to
the animals, 10% of the wheat was saved for seed the following year, and half of the dates
were paid as rent. We have little information about land ownership and tenure arrangements
in Balad Seet, so this share is based on the usual generalizations. In most date palm oases the
land and the trees were the property of absentee landowners. They were often Bedouin tribes
but could also be the ruler, or his relatives, or merchants. The land was usually let on share
contracts with the rent being half of the production of the date crop–the most valuable
product of the oasis. The cultivators could have been either slaves or nominally free. Rent
extraction was the same in either case. The rest of the production was the village’s food
supply. (Reilly 2015, p. 89, 134, Heard-Bey 1982, pp. 223-5).
To assess how adequate the food supply was as well as to estimate the value of a slave
labourer to a landowner, we need to work out the population and the work force of the
village. One approach is demographic–how many people could the village sustain? The
second is technological–how much labour was required to cultivate the land? As it happens,
the two approach lead to similar conclusions. I begin with the demographic.
The population in the village that could be sustained by its agriculture equals the gross
production minus the seed and fodder consumed in producing it and the rent paid to
landowners, whom we assume were outside the village economy. Rent was typically half of
the date harvest and is shown in Table 4. How many people could that support? There are
two steps to answering that question. The first is to chose a reference standard of living, and I
assume that the village population was at subsistence. There are two reasons for this
assumption. One is that the villagers were either slaves or were free but could not move
elsewhere because they were still dependent on their former owners. It was in the owners’
interest that the population be as poor as possible subject to the condition that it would
reproduce, so there would always be a trained work force. This interest implies that the rent
share be set to leave the cultivators with a subsistence income–subsistence in the classical
sense that the population had enough to reproduce itself. There is no indication that the rent
share varied from place to place or over time, so it looks like a rule of thumb. The second
factor that would have ensured that the population was at subsistence was demographic. If
the population dynamics were Malthusian–that is the population expanded or contracted if
income was above or below subsistence–then the population would settle at the size such that
its income was at subsistence whatever rent share had been set.
How much food constitutes ‘subsistence’? I focus in the first instance on calories.
The World Health Organization and Food and Agricultural Organization have developed a
procedure to determine the minimum average calorie requirement of a group of people in
order for them to survive (FAO 2001, FAO 2008b). These calculations are the basis of the
‘food insecurity lines’ that are computed for poor countries. Values range from about 1600
calories to 2000 per day (FAO 2008, p. 8) depending on the age structure of the population
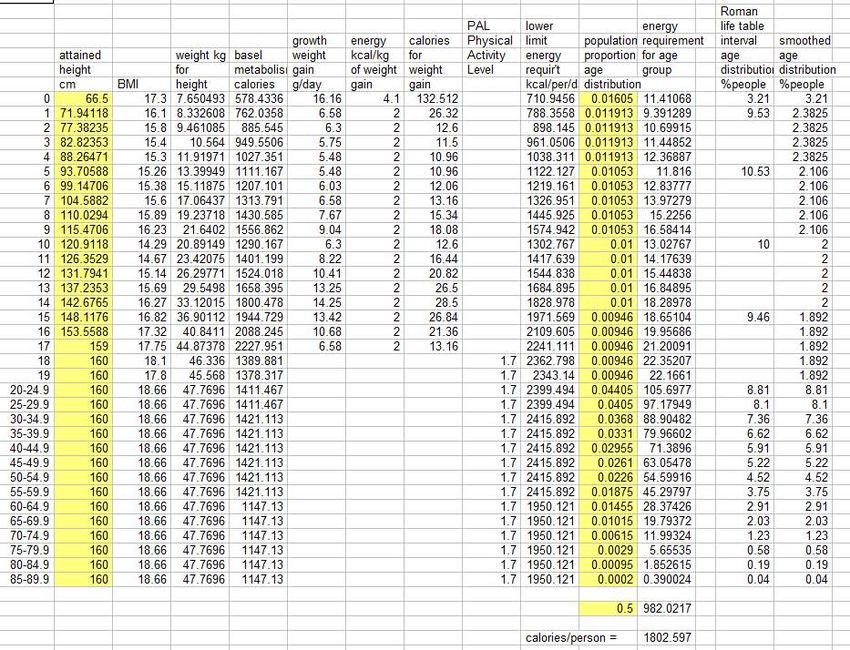
and the vigorousness of its physical activities.13 In the appendix, I summarize this model and
compute the calorie requirement with assumptions that look appropriate for nineteenth
century Arabia. The model indicates that 1803 calories per person per day were necessary for
in mind that very little of this went to the children.
13
The US Department of Agriculture computes food security lines for many countries
using a uniform standard of 2100 calories (USDA, 2018, p. 1).14
survival. This is an average across both sexes and all ages, so it allows working age men, for
instance, to consume 2416 calories per day while three year old girls have 913. Based on
these calculations, I take 1800 calories to have been ‘subsistence.’
Table 5 works out the nutritional implications of this calculation. They are dire.
Except for calories where the required standard of 1800 is reached by choosing the
appropriate size for the population, the diet fails to supply the requirements for protein, fat, or
any of the vitamins and minerals required to prevent anaemia, pellagra, beri-beri, or scurvy.
The reason is that dates were the main stay of the diet but supplied little beyond calories. One
hopes that the people were successful hunters since some game would have alleviated some
of these deficiencies, including, in particular, those of protein and fat. Many people in many
parts of the world, however, have subsisted, if not flourished, on diets this bad.
The population calculation also has important implications for economic organization.
Leaving aside boys and men too old to climb trees, about one quarter of the population would
have been adult male cultivators. Consequently, there would have been 43 farmers and
farms. If the agricultural land was divided equally among them, the average farm would have
been 0.34 hectares with 35 date palms. These farms were small, but not unusually so. The
modal farm size class in the al-Hasa oasis in 1973-4 was 0.2 to 0.5 hectares and included 40%
of the farms (Abu-Bakr 1976, p. 46).
Why was the rent share at 50%? Fairness usually commends a 50/50 split, and
possibly that was a consideration. A profit oriented owner of the land and slaves, however,
would have set the rent at the level that fully utilized the family’s labour in order to maximize
income from the land and the slaves. Although the agronomic data are not very strong, they
are consistent with the claim that a farm family could have cultivated about 35 date palms.
We reason as follows Date cultivation was the main activity in an oasis, and it involved a
series of tasks that were performed by adult males. The most important were fertilizing the
female plants, thinning and pruning, and harvesting the fruit. The harvest was the most
labour intensive and, given the time in which it had to be done, it was the bottle neck that
limited the size of the farm; that is to say, if the farm had enough labour to harvest its date
palms, it had enough labour to do all of the other tasks in dating growing, cultivating its other
crops, and caring for the animals.
How many trees could a farmer harvest? That number equals the duration of the
harvest multiplied by the number of trees per day that a farmer could deal with. Trees had to
be climbed multiple times in the harvest period since the dates did not ripen simultaneously.
Hence, the number of trees per day that a farmer could deal with equalled the number of trees
he could climb and harvest in one day divided by the number of times he had to climb each
tree in the harvest period. A range of values were possible for all of these parameters:
duration of the harvest period–In the date business, three different degrees of ripeness are
distinguished–Khalal, Rutab, and Tamar. The first are fresh and ready to eat but do not last,
while the last have been left on the tree the longest, so that they have dried out and keep
indefinitely. This would have been the predominant type harvested in Arabia in the
nineteenth century, for dates comprised the staple food over the whole year. The time frame
for harvesting tamar dates is variously stated as 2-4 weeks (Lobo et al 2014, p. 66), 2 weeks
(Morton 1987, p. 7), and “The crop is harvested over a some week period at the September.”
(Aboonajmi 2004, p. 2). I will work with a four week time period on the grounds that
farmers in the nineteenth century kept a lot of the crop themselves and did not have to meet
marketing demands.15
number of trees a farmer could climb and harvest in a day–One study found that in the USA
harvesters not using machinery could climb and harvest eight trees per day (Akyurt et al 2002,
p. 481). These trees, however, had ladders permanently attached to their upper reaches,
which would have made the work easier and more secure than it was in Arabia, where bare
foot men climbed the palms with a single rope looped around their waist and the tree for
security. I assume that an Arabian cultivator climbed and harvested 4-6 trees per day.
number of times each tree had to be climbed and harvested--Morton (1981, p. 6) reports that
6-8 ascents were required. Other sources indicate fewer. Akyurt (2002, p. 481) indicates that
in California only 2-5 ascents were made. I assume that each tree was climbed 3-5 times.
If we assume that the cultivator made 3-5 ascents of each tree during the tamar harvest
and could climb and harvest 4-6 trees per day, he could manage 22-56 trees in a four week
period. More extreme values broaden the range even more. These calculations do not narrow
the possibilities as much as we would like, but certainly include the 35 date palms that the
demographic calculations implied. A cultivator who made five ascents per day and harvested
each tree four times would finish exactly 35 trees in four weeks. These calculations accord
reasonably with Wilkinson’s (1977, p. 92) view that “40 to 50 palms support a family-group
of five persons.”
The Value of a Slave
The input-output relationships in Tables 4 and 5 can be turned into an economic
model of production by treating them as fixed coefficients and valuing them with prices. The
resulting equation is the profit function of the oasis. In fact, to analyse slavery, the only
product price we need is the price of dates: This is because the only revenue accruing to the
slave owner is the value of the rent, which is paid in dates. One further assumption will be
necessary, however.
The value of a slave to his owner is the value of the rent that his labour makes
possible and which is what the owner gets out of the farm. To complicate matters, however,
the rent also includes the value of the land in the farm since land and labour were used
together in fixed proportions (by assumption) in production. If we knew the rental value of
the land alone, we could subtract it and get the value of the labour, but we do not know that.
Wilkinson reports that Oman was littered with abandoned aflaj (in his view constructed by
the Persians) that could be restore for much less expense than a new system would have cost.
Burdened by the precariousness of the assumption, we proceed on the basis that three quarters
of the rent per farm was a return to labour and the remaining quarter was a return to land
(including trees and water).
Table 6 shows the implications of the production model for the value of slaves in
Oman and the Gulf at different points in the long nineteenth century. The figures labelled the
1840s are broadly representative of the situation before the opening of the Suez Canal. The
figures labelled ‘coast’ are coastal locations like Bahrain and the Batina–Oman’s coastal strip
along the Gulf of Oman. The price in these districts is presumed to have been the same as the
price in Basra. The price at ‘inland’ sites like valleys in the Hajar mountains and the al-Hasa
oasis are set equal to 75% of the coastal price to allow for transport costs to the coast. In both
districts, the date rent of our stylized village (30400 kg in line 1 of Table 4) is set equal to the
value in Table 6. This is valued at the price of dates in sterling (line 2) and converted toYou can also read