Socio-economic inequalities in access to planned hospital care: causes and consequences
←
→
Page content transcription
If your browser does not render page correctly, please read the page content below

Socio-economic inequalities in
access to planned hospital care:
causes and consequences

Prepared for the Midlands Decision Support Network

13th May 2021 (v2)

Prepared by:
Steven Wyatt                Jake Parsons
Head of Analytics           Analytics Manager
swyatt@nhs.net              jake.parsons@nhs.net

Document control
 Document Title                       Midlands Decision Support Network
 Job No                               753
 Prepared by                          Steven Wyatt & Jake Parsons
 Checked by                           Fraser Battye & Simon Bourne
 Date                                 13th May 2021

The Strategy Unit | Socio-economic inequalities in access to planned hospital care:
causes and consequences                                                                                                        i
https://csucloudservices-my.sharepoint.com/personal/rachel_caswell_mlcsu_nhs_uk/Documents/Documents/DSU/DSU project -/socio-
economic inequalities in access to planned hospital care - 210513 with adjusted hyperlinks.docx

Foreword
‘Reducing health inequality’ must be one of this country’s most stable policy aims. With peaks and
dips in emphasis, it has been featured consistently in policy statements since at least the late 1990s.

Yet outcomes have got worse. Gaps between rich and poor have widened. Defying a trend that
began in late Victorian times, gains in life expectancy have stalled for poorer groups - and have
even fallen for women from the poorest backgrounds. Most recently, the pandemic has exposed
the radically different experiences and outcomes of different ethnic groups in the UK.

Faced with this situation, it may be tempting for those of us in the NHS to see inequality as
someone else’s problem. The determinants of inequality are broad and social; healthcare has only a
contributory role - so the ‘real solutions’ lie outside the NHS. This has a ring of truth. Getting a grip
on inequality does require cross-societal, cross-governmental action. Yet it would only ring true if
the NHS was already doing all it could.

This analysis shows that it isn’t.

The headline results are jarring. They show a consistent and growing inequality in the use of
elective care. Notwithstanding some subtlety, the general pattern is of wealthier groups receiving
more elective care than poorer groups. This pattern has emerged over recent years: it was not the
case in 2005. And it is seen most clearly late in the ‘pathway’; this is a problem of choices made
once people are receiving care.

Are there reasons to hope this might change?

One such reason might be to see the pandemic as a ‘teachable moment’. Inequality has been such
a central part of the story; maybe the resulting attention and comment will be converted to actions
and outcomes?

Another, more technical, reason is that NHS Planning Guidance demands the opposite situation to
that revealed by this analysis. It demands that people experiencing the worst outcomes are
prioritised for treatment. (It also demands that such prioritisation is done using robust analysis).

But there are even simpler reasons for hope. This analysis has highlighted a problem that is directly
within the NHS’s ability to control. Many of the solutions, which will be the subject of a further
project, will also therefore be within NHS control. So this report identifies a problem that local
services can do something about. Moving from analysis to action is then a question of will and
practicality.

                                                                                                              Fraser Battye

                                                                                                      The Strategy Unit

The Strategy Unit | Socio-economic inequalities in access to planned hospital care:
causes and consequences                                                                                                        ii
https://csucloudservices-my.sharepoint.com/personal/rachel_caswell_mlcsu_nhs_uk/Documents/Documents/DSU/DSU project -/socio-
economic inequalities in access to planned hospital care - 210513 with adjusted hyperlinks.docx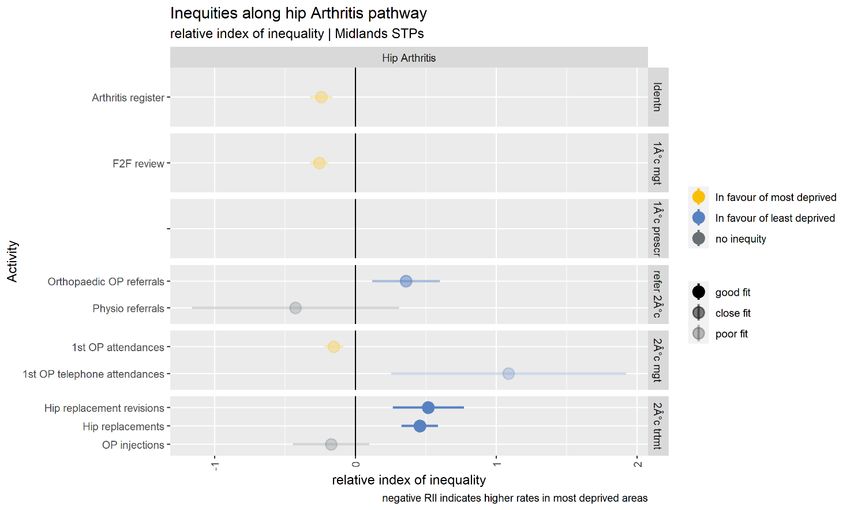
Contents
Foreword........................................................................................................................................ ii

Executive Summary ....................................................................................................................... 1

1.                Introduction .................................................................................................................. 3

     1.1          Planned hospital care .................................................................................................................................... 3
     1.2          Inequalities and inequities ........................................................................................................................... 4
     1.3          Dimensions of inequality.............................................................................................................................. 4
     1.4          Measuring inequalities .................................................................................................................................. 5
     1.5          Previous research ............................................................................................................................................ 5
     1.6          Recent policy context .................................................................................................................................... 6
     1.7          Report structure............................................................................................................................................... 7
     1.8          Supplementary materials.............................................................................................................................. 8

2.                Describing socio-economic inequalities in access to planned hospital care .............. 9

     Key findings ..................................................................................................................................................................... 9
     2.1          Activity levels and trends............................................................................................................................ 10
     2.2          Activity rates by age and sex .................................................................................................................... 11
     2.3          Activity rates by condition ......................................................................................................................... 12
     2.4          Differences in rates of planned hospital care by deprivation....................................................... 13
     2.5          Changes in rates of planned hospital care by deprivation ............................................................ 14
     2.6          Differences in rates of elective spells by deprivation and condition ......................................... 15
     2.7          Differences in rates of elective spells by deprivation and STP ..................................................... 16

3.                Where in the pathway do inequities in planned hospital care emerge? .................. 17

     Key findings ................................................................................................................................................................... 17
     3.1          Moving from inequalities to inequities ................................................................................................. 17
     3.2          Pathways of care............................................................................................................................................ 18
     3.3          Chronic obstructive pulmonary disease ............................................................................................... 19
     3.4          Heart failure..................................................................................................................................................... 23
     3.5          Arthritis of the hip ......................................................................................................................................... 24
     3.6          Cataracts ........................................................................................................................................................... 25
     3.7          Four pathways ................................................................................................................................................ 26

The Strategy Unit | Socio-economic inequalities in access to planned hospital care:
causes and consequences                                                                                                                                                                iii
https://csucloudservices-my.sharepoint.com/personal/rachel_caswell_mlcsu_nhs_uk/Documents/Documents/DSU/DSU project -/socio-
economic inequalities in access to planned hospital care - 210513 with adjusted hyperlinks.docx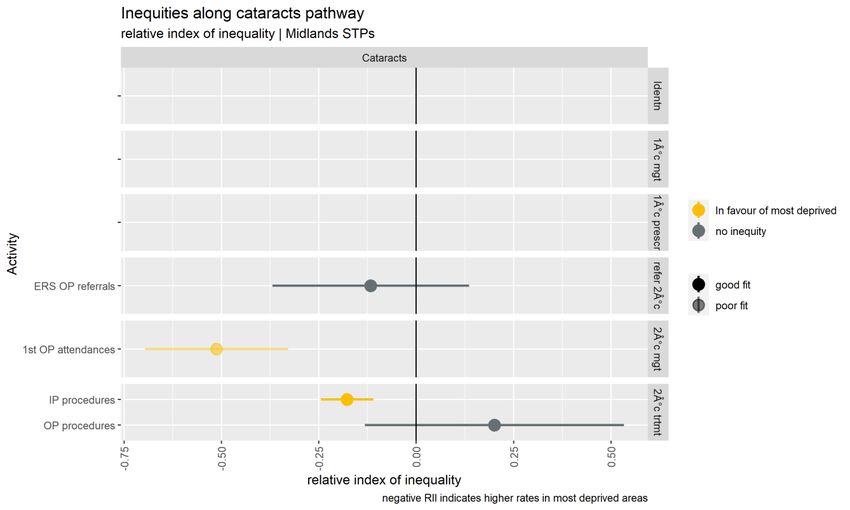
4.                Possible drivers of inequalities in access to planned hospital care .......................... 27

     Key findings ................................................................................................................................................................... 27
     4.1          Differential impacts of health policies to improve or control access to planned hospital
     care         .............................................................................................................................................................................. 27
     4.2          Waiting times targets .................................................................................................................................. 29
     4.3          NHS-funded access to private hospital provision ............................................................................ 30
     4.4          Access to new diagnostic technologies ................................................................................................ 31
     4.5          Access to procedures arising from new screening programmes ................................................ 32
     4.6          Access to procedures with extensive eligibility criteria .................................................................. 33

5.                Does poor access to planned hospital care increase demand for unplanned care? . 35

     Key findings ................................................................................................................................................................... 35
     5.1          Rates of elective and emergency spells by deprivation ................................................................. 36
     5.2          Change in rates of elective and emergency spells by deprivation ............................................. 37
     5.3          Rates of elective and emergency spells by deprivation and ICD10 chapter........................... 38
     5.4          Rates of emergency spells before and after an elective spell ...................................................... 39
     5.5          Rates of emergency spells before and after an elective spell by deprivation ........................ 40
     5.6          Modelling the impact of elective activity on emergency activity ............................................... 41
     5.7          Equalising access to elective care ........................................................................................................... 43

6.                Conclusions ................................................................................................................. 45

Appendix A: Adjusting for need ................................................................................................. 46

Appendix B: Pathway metrics ..................................................................................................... 48

Appendix C: Additional pathway charts ..................................................................................... 52

     Heart failure ................................................................................................................................................................... 52
     Hip arthritis .................................................................................................................................................................... 54
     Cataracts ......................................................................................................................................................................... 55

Appendix D: Methods used to explore the relationship between elective and emergency
spells ............................................................................................................................................ 56

Appendix E: Data sources and analytical methods .................................................................... 58

The Strategy Unit | Socio-economic inequalities in access to planned hospital care:
causes and consequences                                                                                                                                                                        iv
https://csucloudservices-my.sharepoint.com/personal/rachel_caswell_mlcsu_nhs_uk/Documents/Documents/DSU/DSU project -/socio-
economic inequalities in access to planned hospital care - 210513 with adjusted hyperlinks.docx
Executive Summary
Tackling inequalities in health is a long-standing NHS policy objective. Variation in the experiences
and outcomes of different communities during the COVID-19 pandemic served to bring this issue
back into focus. In the Summer and Autumn of 2020, as the first wave of the pandemic subsided,
concern grew about reduced access to routine hospital care: diagnostics, outpatient care and
planned surgery. Waiting lists and waiting times began to grow. The network of Decision Support
Units in the Midlands recognised the potential for this issue to exacerbate existing inequalities.
They jointly commissioned this analysis to explore the extent, causes and consequences of socio-
economic inequalities in access to planned hospital care. The recent NHS Planning Guidance
emphasises the importance of identifying and tackling these inequalities.

The report has four objectives:

    1. To describe socio-economic inequalities in access to planned hospital care
    2. To identify where in the patient pathways these, inequalities in planned care emerge
    3. To explore potential drivers of these inequalities
    4. To explore whether poor access to planned care in some communities leads to increased
         demand for unplanned care.

The key findings are set out below.

The report builds on earlier research, advancing our understanding in some key areas. Although
further analysis may certainly add benefit, this report is sufficient to support some immediate and
targeted actions. We look forward to working with the network of Decision Support Units in the
Midlands to improve the outcomes for people living in the most deprived parts of the region.

Describing socio-economic inequalities in access to planned hospital care

Rates of access to planned care have increased substantially in recent years.

Rates of access are higher among those living in the least deprived areas. This was not always the
case.

This pattern holds for most major causes of morbidity and in most STPs.

Where in the pathway do inequities in planned hospital care emerge?

We explored four pathways: chronic obstructive pulmonary disease, heart failure, arthritis of the hip
and cataracts.

The Strategy Unit | Socio-economic inequalities in access to planned hospital care:
causes and consequences                                                                                                        1
https://csucloudservices-my.sharepoint.com/personal/rachel_caswell_mlcsu_nhs_uk/Documents/Documents/DSU/DSU project -/socio-
economic inequalities in access to planned hospital care - 210513 with adjusted hyperlinks.docx
Having adjusted for levels of need, activity in the early parts of each the four pathways was skewed towards the most deprived. This pattern was reversed towards the very end of the pathway, when secondary care treatment occurs. Possible drivers of inequalities in access to planned hospital care The late pathway skew towards the least deprived populations that has occurred in recent years, may be a function of various policy initiatives introduced to improve or control access to secondary care treatments. Access to NHS-funded private sector treatment is substantially higher in the least deprived populations. As waiting times improved between 2000 and 2014, the benefits were felt disproportionately by those living in the least deprived areas. Growth in the rates of access to new imaging technologies tends to be slower in the most deprived areas. When the NHS seeks to limit access to certain forms of surgery, rates tend to fall more rapidly in the most deprived areas. When the NHS introduces new screening programmes, interventions resulting from those programmes tend to increase more slowly in the most deprived areas. Does poor access to planned hospital care increase demand for unplanned care? There is good evidence of a relationship between levels of planned and emergency spells. For every 10 additional elective spells, we estimate that one emergency spell will be avoided. The effect accumulates over two years. Increasing access to elective care for those in the most deprived areas is likely to lead to reductions in emergency care overall and to inequalities in levels of emergency care. The Strategy Unit | Socio-economic inequalities in access to planned hospital care: causes and consequences 2 https://csucloudservices-my.sharepoint.com/personal/rachel_caswell_mlcsu_nhs_uk/Documents/Documents/DSU/DSU project -/socio- economic inequalities in access to planned hospital care - 210513 with adjusted hyperlinks.docx
1. Introduction
This report explores socio-economic inequalities in access to planned hospital care. It has four
primary objectives:

    1. To describe socio-economic inequalities in access to planned hospital care.

    2. To identify where in the patient pathways these inequalities in access emerge,

    3. To explore potential drivers of these inequalities

    4. To explore whether poor access to planned care in some communities leads to increased
         demand for unplanned care.

Reducing inequalities in health outcomes and in access to healthcare is a long-standing national
policy objective, but the profile of this policy is particularly high at present. Indeed, the recent NHS
Planning Guidance requires STPs to make progress on this issue as a condition for accessing the
Elective Recovery Fund.

The analysis has been conducted by the Strategy Unit on behalf of the Midlands STPs network of
Decision Support Units.

1.1       Planned hospital care
In contrast to urgent and emergency care, planned hospital care is arranged in advance and often
follows a referral from a GP. This type of care can involve a consultation with a hospital specialist, a
diagnostic test, surgery, or the administration of a specialist form of medication. Care can be
provided in an outpatient or inpatient setting and may include one or more overnight stay.
Activities of this type consume approximately half of all NHS hospital expenditure.

In our analysis, we focus on attendances at outpatient clinics and elective (planned) inpatient spells
whether or not these involve an overnight stay. We have excluded some other similar forms of
care: inpatient maternity care, planned transfers between hospitals and regular day admissions
where care is delivered as a planned series of short admissions as part of an on-going regimen of
repeated treatments. These are relatively small components of planned hospital services and are
subject to different challenges.

The Strategy Unit | Socio-economic inequalities in access to planned hospital care:
causes and consequences                                                                                                        3
https://csucloudservices-my.sharepoint.com/personal/rachel_caswell_mlcsu_nhs_uk/Documents/Documents/DSU/DSU project -/socio-
economic inequalities in access to planned hospital care - 210513 with adjusted hyperlinks.docx
1.2 Inequalities and inequities The terms ‘inequalities’ and ‘inequities’ are used throughout this report. The terms have particular and distinct meanings within a healthcare policy context. The term ‘inequalities’ is used to describe differences in rates of access to a service between population subgroups; it makes no claims about the appropriateness or fairness of these differences. In contrast the term ‘inequities’ is used to describe unjustifiable differences in rates of access between subgroups. An equity analysis must control for levels of need within each population subgroup. Having done this, an equitable distribution of services is one where rates of access to a service or population follow the distribution of need, such that a patient with a given level of need in one subgroup has the same chance of accessing a service as their counterparts with a similar level of need in other subgroups. This is the standard that the NHS seeks to achieve. Assessing equity is challenging. In practice it is only feasible for specific services or pathways (e.g., for hip replacements) rather than for broader sets of services (e.g., elective hospital spells), because patterns of need vary substantially between services. This report uses both inequality and inequity assessments as required. 1.3 Dimensions of inequality Inequalities and inequities can act across many different dimensions: gender, ethnicity, geography, sexual preference, religion etc. This report is particularly concerned with differences in rates of access between socio-economic groups as defined by indices of deprivation. These indices score and rank small geographical areas (known as lower super output areas) by the relative levels of deprivation experienced by their residents. The English Indices of Deprivation 2019, the most recent release, measures deprivation across seven domains: income, employment, education, health, crime, barriers to housing and services and living environment. Because this multi-faceted definition of deprivation is used, deprivation should not be considered equivalent to poverty although it is often the case that people living in the most deprived areas have lower levels of income than people living in other areas. Areas are often grouped in to 10 equally sized, deciles of deprivation with decile 1 representing the 10% of areas with the highest levels of deprivation and decile 10 representing the areas with the lowest levels of deprivation. Quintiles of deprivation, five equally sized groups, are also commonly used. The Strategy Unit | Socio-economic inequalities in access to planned hospital care: causes and consequences 4 https://csucloudservices-my.sharepoint.com/personal/rachel_caswell_mlcsu_nhs_uk/Documents/Documents/DSU/DSU project -/socio- economic inequalities in access to planned hospital care - 210513 with adjusted hyperlinks.docx
1.4        Measuring inequalities
There are many, well-established approaches to measuring inequalities and inequities across a
population. In this report, we use the relative index of inequalities (RII) to indicate the extent to
which the rate of an activity or event varies across socio-economic groups defined by deciles of
deprivation. It is similar to the range (the difference between the highest and lowest rates), but
takes into account the values for all deprivation deciles as well as the population size of each
group, such that smaller groups do not unduly skew the results. Where the denominator of the
rates assessed is the population size, the RII measures degrees of inequality. Where the
denominator is a measure of need, the RII measures inequities.

1.5        Previous research
In 1971, the Lancet published a paper titled ‘The inverse care law’.1 The paper was authored by
Julian Tudor-Hart, drawing heavily on his experiences as a general practitioner in Glyncorrwg, a
coal-mining area in South Wales. The law states that:

        "The availability of good medical care tends to vary inversely with the need for it in the
        population served.”

He observed that while this is particularly apparent where medical care is distributed according to a
person’s ability to pay, it also holds true in health systems where individuals are fully insured. In
the 50 years since the paper was published, many quantitative and qualitative studies have
confirmed this relationship between the need and supply of healthcare. We highlight four such
papers.

In 2003 Anna Dixon, Julian Le Grand, John Henderson, Richard Murray and Emmi Poteliakhoff
reviewed the available evidence to determine whether the NHS was equitable.2 They concluded
that most studies exploring equity of access to specific planned procedures found that utilisation
rates were higher in higher-income groups after adjusting for need. Some studies pointed in the
opposite direction, but the authors highlight that these studies often relied on self-reported health
status as a proxy for need and that this may be subject to systematic bias, or that the studies did
not distinguish between planned and emergency care.

1
    https://www.thelancet.com/journals/lancet/article/PIIS0140-6736(71)92410-X/fulltext
2
    https://journals.sagepub.com/doi/10.1258/135581907780279549

The Strategy Unit | Socio-economic inequalities in access to planned hospital care:
causes and consequences                                                                                                        5
https://csucloudservices-my.sharepoint.com/personal/rachel_caswell_mlcsu_nhs_uk/Documents/Documents/DSU/DSU project -/socio-
economic inequalities in access to planned hospital care - 210513 with adjusted hyperlinks.docx
In 2010 Andy Judge, Nicky Welton, Jat Sandhu and Yoav Ben-Shlomo compared rates of need and
supply of NHS-funded hip and knee replacement surgery by quintiles of deprivation in England in
2002.3 Having adjusted for levels of need, they concluded that people living in the most deprived
areas were substantially less likely to receive an NHS-funded hip or knee replacement than their
counterparts in the least deprived areas.
In 2015 Martin Wenzl, Sarah McCuskee and Elias Mossialos reviewed the evidence on equity as a
policy goal and the NHS’s capacity to deliver equity through the process of commissioning.4 They
found that commissioners (Clinical Commissioning Groups) had limited capacity and incentives to
commission for equity. They concluded that the 2012 health reforms prioritised the goal of
efficiency at the expense of equity.
In 2020, Eric Brunner, Martin McKee, Martin Shipley, George Stoye and Ben Zaranko used self-
reported health status from a sample of older adults, to explore socio-economic inequities in
access to hospital care between 2004 and 2015.5 They found that since 2010, gaps in rates of
access to outpatient care had opened up between socio-economic groups. By 2015, individuals
with higher levels of qualification received higher levels of outpatient care relative to the
individual’s self-reported health status.
1.6 Recent policy context
The most recent planning guidance was issued by NHS England in March 2021.6 Two themes
receive particular attention: reducing health inequalities and managing the backlog of planned
hospital care that has built up over the course of the COVID-19 pandemic. An Elective Recovery
Fund (ERF) has been established to ensure that local health systems have sufficient resources to
deliver increased levels of planned hospital activity. To qualify for ERF monies, systems must
demonstrate that their plans meet the Fund’s objectives to address health inequalities. In
particular, local plans must:
• Use waiting list data (pre and during pandemic), including for clinically prioritised cohorts, to
identify disparities in relation to the bottom 20% by Index of Multiple Deprivation (IMD) and
black and minority ethnic populations.
3
https://www.bmj.com/content/341/bmj.c4092
4
https://academic.oup.com/bmb/article/115/1/5/260428
5
https://www.ifs.org.uk/publications/15059
6
https://www.england.nhs.uk/operational-planning-and-contracting/
The Strategy Unit | Socio-economic inequalities in access to planned hospital care:
causes and consequences 6
https://csucloudservices-my.sharepoint.com/personal/rachel_caswell_mlcsu_nhs_uk/Documents/Documents/DSU/DSU project -/socio-
economic inequalities in access to planned hospital care - 210513 with adjusted hyperlinks.docx• Prioritise service delivery by taking account of the bottom 20% by IMD and black and minority
ethnic populations for patients on the waiting list and not on the waiting list, including
through proactive case finding.
• Use system performance frameworks to measure access, experience and outcomes for black
and minority ethnic populations and those in the bottom 20% of IMD scores.
• Evaluate the impact of elective recovery plans on addressing pre-pandemic and pandemic-
related disparities in waiting lists, including for clinically prioritised cohorts.
• Demonstrate how the ICS’s SRO for health inequalities will work with the Board and partner
organisations to use local population data to identify the needs of communities experiencing
inequalities in access, experience and outcomes and ensure that performance reporting allows
monitoring of progress in addressing these inequalities.
2021/22 priorities and operational planning guidance: Implementation guidance,
NHS England March 2021
1.7 Report structure
This report has four substantive chapters. Chapter 2 sets out levels of planned hospital care, before
moving on to describe inequalities in access to planned hospital care by activity type, condition
and STP. These assessments are made at two points in time: 2005 and 2018.
Chapter 3 seeks to identify where inequities emerge along the clinical pathway from the
development of symptoms to secondary care treatments. It describes four clinical pathways: those
for chronic obstructive pulmonary disease, heart failure, arthritis of the hip, and cataracts. Having
adjusted for levels of need, we estimate levels of inequity at six stages of each pathway:
identification, primary care management, primary care prescribing, referral to secondary care,
secondary care management and secondary care treatment.
Chapter 4 seeks to explain the results observed in Chapter 3 by exploring the impact of various
policy and clinical interventions including waiting times targets, the roll-out of new technologies
and screening programmes and processes that seek to control access to some forms of treatment.
Chapter 5 explores the relationship between inequalities in access to planned care and demand for
unplanned care. We consider the credibility of this claim before subjecting the causal hypothesis
to a formal test. Finally, we estimate how much unplanned care might be avoided if we addressed
inequalities in access to planned hospital care.
The Strategy Unit | Socio-economic inequalities in access to planned hospital care:
causes and consequences 7
https://csucloudservices-my.sharepoint.com/personal/rachel_caswell_mlcsu_nhs_uk/Documents/Documents/DSU/DSU project -/socio-
economic inequalities in access to planned hospital care - 210513 with adjusted hyperlinks.docx1.8 Supplementary materials Two additional sets of materials are provided alongside this regional report. The pathway analysis in Chapter 3 is reproduced for each STP/ICS in the Midlands region, drawing out the key messages for those systems and in particular highlighting where the results for an STP/ICS vary substantively from those for the region as a whole. These can be found in a supplementary paper made available alongside this report. We also provide a series of technical appendices, in the form of r-markdown files, for each of the substantive chapters in this report. These files set out the data sources we relied on, the processes we used to assemble the data and the methods we used to analyse it. This material is supplied to enable other analysts to check, replicate and advance our analysis (see Appendix E for details). We welcome feedback from our fellow analysts on our approaches and methods. The Strategy Unit | Socio-economic inequalities in access to planned hospital care: causes and consequences 8 https://csucloudservices-my.sharepoint.com/personal/rachel_caswell_mlcsu_nhs_uk/Documents/Documents/DSU/DSU project -/socio- economic inequalities in access to planned hospital care - 210513 with adjusted hyperlinks.docx
2. Describing socio-economic inequalities
          in access to planned hospital care

Key findings
Rates of access to planned care have increased substantially in recent years.

Rates of access are higher among those living in the least deprived areas. This was not always the
case.

This pattern holds for most major causes of morbidity and in most STPs.

In this chapter we estimate rates of outpatient attendances and elective spells per head of
population in 2018, and illustrate how these have changed since 2005. We show how activity rates
vary by age, sex and health condition. We then move on to explore how rates of access to planned
hospital care vary by socio-economic group, as defined by deciles of deprivation. We make these
assessments for 2005 and 2018, by health condition and STP/ICS.

The Strategy Unit | Socio-economic inequalities in access to planned hospital care:
causes and consequences                                                                                                        9
https://csucloudservices-my.sharepoint.com/personal/rachel_caswell_mlcsu_nhs_uk/Documents/Documents/DSU/DSU project -/socio-
economic inequalities in access to planned hospital care - 210513 with adjusted hyperlinks.docx
2.1 Activity levels and trends In 2018 there were 152.5 elective spells and 1,681 outpatient attendances per 1000 population in England. This emphasises the scale of this aspect of NHS provision. The level of planned hospital care increased considerably between 2005 and 2018. Rates of elective spells per head of population increased by 33.1% in that period (2.2% per annum), while outpatient attendances per head increased by 78.1% (4.5% per annum). This occurred despite constraints on NHS funding growth in the years following the economic downturn in 2008 and 2009. The Strategy Unit | Socio-economic inequalities in access to planned hospital care: causes and consequences 10 https://csucloudservices-my.sharepoint.com/personal/rachel_caswell_mlcsu_nhs_uk/Documents/Documents/DSU/DSU project -/socio- economic inequalities in access to planned hospital care - 210513 with adjusted hyperlinks.docx
2.2       Activity rates by age and sex
Rates of planned hospital care rise slowly with age to age 50 and then more sharply to age 80,
before declining. Obstetrics and gynaecology activity elevates outpatient rates for women aged 20-
45. Rates of elective spells and outpatient attendances are higher in older men than in women of
the same age. The bowel scope screening programme had a substantial impact on activity rates
for men and women aged 55, but this screening programme was discontinued in January 2021.

The Strategy Unit | Socio-economic inequalities in access to planned hospital care:
causes and consequences                                                                                                    11
https://csucloudservices-my.sharepoint.com/personal/rachel_caswell_mlcsu_nhs_uk/Documents/Documents/DSU/DSU project -/socio-
economic inequalities in access to planned hospital care - 210513 with adjusted hyperlinks.docx
2.3       Activity rates by condition
Cancer, digestive system disorders and musculo-skeletal conditions were the most common driver
of elective inpatient spells. Between 2005 and 2018, absolute growth was largest for disorders of
the digestive system and for cancers. In relative terms, growth was greatest for infections, blood
disorders and injuries. These differential growth rates are likely to be a product of differential
changes in need, treatment options, treatment thresholds and capacity.

The Strategy Unit | Socio-economic inequalities in access to planned hospital care:
causes and consequences                                                                                                    12
https://csucloudservices-my.sharepoint.com/personal/rachel_caswell_mlcsu_nhs_uk/Documents/Documents/DSU/DSU project -/socio-
economic inequalities in access to planned hospital care - 210513 with adjusted hyperlinks.docx
2.4       Differences in rates of planned hospital care by deprivation
Next, we move on to consider inequalities in access to planned hospital care by levels of
deprivation. The charts below show rates of elective spells and outpatient attendances in 2005 and
2018. Within each chart, the rates for the 10% of areas with the highest levels of deprivation
appear on the left and those for the least deprived areas on the right.

In 2005, crude rates of elective spells favoured those living in the most deprived areas. By 2018 the
gradient for elective spells had reversed such that crude rates were highest amongst the least
deprived populations.

There is now no observable gradient in rates of outpatient attendances, although a gradient in
favour of the most deprived areas was present in 2005.

The Strategy Unit | Socio-economic inequalities in access to planned hospital care:
causes and consequences                                                                                                    13
https://csucloudservices-my.sharepoint.com/personal/rachel_caswell_mlcsu_nhs_uk/Documents/Documents/DSU/DSU project -/socio-
economic inequalities in access to planned hospital care - 210513 with adjusted hyperlinks.docx
2.5       Changes in rates of planned hospital care by deprivation
After taking account of differential changes in the age/sex structure, rates of elective spells and
outpatient attendances for those living in the most deprived areas have grown at a slower rate.

The Strategy Unit | Socio-economic inequalities in access to planned hospital care:
causes and consequences                                                                                                    14
https://csucloudservices-my.sharepoint.com/personal/rachel_caswell_mlcsu_nhs_uk/Documents/Documents/DSU/DSU project -/socio-
economic inequalities in access to planned hospital care - 210513 with adjusted hyperlinks.docx
2.6       Differences in rates of elective spells by deprivation and
          condition
The relative index of inequality (RII) can be used to measure the direction and extent of any
inequality in rates of healthcare use by people living in areas of differing levels of deprivation.

Rates of elective spells for most of the major causes of morbidity (including cancer, circulatory,
ophthalmic, musculo-skeletal, nervous system and skin conditions) are skewed towards people
living in the least deprived areas.

The Strategy Unit | Socio-economic inequalities in access to planned hospital care:
causes and consequences                                                                                                    15
https://csucloudservices-my.sharepoint.com/personal/rachel_caswell_mlcsu_nhs_uk/Documents/Documents/DSU/DSU project -/socio-
economic inequalities in access to planned hospital care - 210513 with adjusted hyperlinks.docx
2.7 Differences in rates of elective spells by deprivation and STP In most STPs/ICSs, rates of elective spells and outpatient attendances are skewed towards people living in the least deprived areas. The Strategy Unit | Socio-economic inequalities in access to planned hospital care: causes and consequences 16 https://csucloudservices-my.sharepoint.com/personal/rachel_caswell_mlcsu_nhs_uk/Documents/Documents/DSU/DSU project -/socio- economic inequalities in access to planned hospital care - 210513 with adjusted hyperlinks.docx
3. Where in the pathway do inequities in
          planned hospital care emerge?

Key findings
We explored four pathways: chronic obstructive pulmonary disease, heart failure, arthritis of the
hip, and cataracts.

Having adjusted for levels of need, activity in the early parts of each the four pathways was skewed
towards the most deprived.

This pattern was reversed towards the very end of the pathway, when secondary care treatment
occurs.

Having established that rates of planned hospital spells are lower for those living in the most
deprived areas, this chapter seeks to confirm whether these differences persist after adjustments
are made for levels of need and, if so, where these inequities emerge over the planned care
pathway. We make these assessments for four planned care pathways: chronic obstructive
pulmonary disease (COPD), heart failure, arthritis of the hip, and cataracts. These high-volume
pathways were selected in consultation with colleagues in the DSU network. Two pathways - for
hip arthritis and cataracts - are predominantly surgical, requiring some form of localised
intervention. Those for COPD and heart failure are predominantly medical and involve a more
systemic approach to treatment.

3.1       Moving from inequalities to inequities
In Chapter 2, we saw that rates of planned hospital spells per head of population were lower
among those living in the most deprived areas - but levels of need per head of population might
differ between those living in more or less deprived areas. A more useful assessment would
involve comparing rates of planned hospital spells across deciles of deprivation having adjusted for
levels of need. An assessment of this type supports judgements not only about differences in rates
of access between groups, but also about whether these differences are clinically justified.

Information about how we adjusted for levels of need can be found in Appendix A.

The Strategy Unit | Socio-economic inequalities in access to planned hospital care:
causes and consequences                                                                                                    17
https://csucloudservices-my.sharepoint.com/personal/rachel_caswell_mlcsu_nhs_uk/Documents/Documents/DSU/DSU project -/socio-
economic inequalities in access to planned hospital care - 210513 with adjusted hyperlinks.docx
3.2 Pathways of care
For each of the four pathways, we identified a series of metrics for which data was available at a GP
practice level. Each metric was assigned to one of six stages along the pathway: identification of a
condition in primary care, primary care management, primary care prescribing, referral to
secondary care, management in secondary care, and finally treatment in secondary care.
The pathway metrics are set out in Table 1. Full definitions and data sources for each pathway
metric are included in Appendix B.
Table 1 – Pathway metrics
Condition COPD Heart failure Arthritis (hip) Cataracts
Rheumatoid
Identification COPD register HF register
arthritis register
Diagnosis
1 care Annual review,
confirmed by F2F review
management flu vaccination
ECG
ACEi, ARBs,
Bronchodilator
1 care Betablockers,
inhalers,
prescribing Sacubitril,
steroid inhalers
Digoxin
ERS OP referrals, Physio referrals,
Referral to 2
offered ERS OP referrals orthopaedic OP ERS OP referrals
care
pulmonary rehab referrals
1st OP
2 care 1st OP 1st OP attendances, 1st 1st OP
management attendances attendances OP telephone attendances
attendances
Steroid tablets,
OP injections,
2 care lung volume Pacemakers, OP procedures,
hip replacements,
treatment reduction valve repair IP procedures
hip revisions
procedure
The Strategy Unit | Socio-economic inequalities in access to planned hospital care:
causes and consequences 18
https://csucloudservices-my.sharepoint.com/personal/rachel_caswell_mlcsu_nhs_uk/Documents/Documents/DSU/DSU project -/socio-
economic inequalities in access to planned hospital care - 210513 with adjusted hyperlinks.docxThe following charts for each of the pathways show the activity-to-need ratios (activity per 1,000 need) by deprivation decile for each of the activity measures detailed above. The relative index of inequalities (RII) is given for each measure. The RII represents the inequality gap across the whole population between the most and the least disadvantaged. It allows for comparison of inequity across different measures. The sign of the RII indicates the direction of the inequity: a negative RII indicates that activity-to-need ratios are higher for those in more deprived groups, whereas a positive RII indicates higher activity-to-need ratios in the least deprived groups. The absolute size of the RII (i.e., its numerical value without the sign) indicates the size of the inequity. 3.3 Chronic obstructive pulmonary disease Chronic obstructive pulmonary disease is a term used to describe progressive, chronic conditions such as emphysema and chronic bronchitis that cause breathing difficulties. These conditions can be managed in primary care, but as symptoms worsen, patients are often referred to secondary care for more specialised medical treatment. In some cases, patients are offered surgical interventions to remove air pockets and damaged parts of the lung. The charts that follow show the ratio of activity to need at various points on the COPD pathway. Patients with COPD in the most deprived areas are more likely to be identified by their GP and placed on a COPD register than patients in the least deprived areas. Patients with COPD in the most deprived areas are also more likely to receive primary care management (annual reviews and influenza vaccinations), to be prescribed inhalers, to be referred to secondary care and, to be seen by a specialist in an outpatient setting. However, patients with COPD living in the least deprived areas are more likely to receive treatments in secondary care, such as lung volume reduction surgery. The Strategy Unit | Socio-economic inequalities in access to planned hospital care: causes and consequences 19 https://csucloudservices-my.sharepoint.com/personal/rachel_caswell_mlcsu_nhs_uk/Documents/Documents/DSU/DSU project -/socio- economic inequalities in access to planned hospital care - 210513 with adjusted hyperlinks.docx
Identification

Primary care management

Primary care prescribing

Referral to secondary care

Secondary care management

Secondary care treatment

The Strategy Unit | Socio-economic inequalities in access to planned hospital care:
causes and consequences                                                                                                    20
https://csucloudservices-my.sharepoint.com/personal/rachel_caswell_mlcsu_nhs_uk/Documents/Documents/DSU/DSU project -/socio-
economic inequalities in access to planned hospital care - 210513 with adjusted hyperlinks.docx
The summary chart below illustrates the RII for each metric on the COPD pathway. It includes
confidence intervals indicating whether the observed inequity is statistically significant. Yellow
points on the chart indicate that activity is significantly skewed towards more deprived populations,
and blue points indicate that activity is significantly skewed towards less deprived populations.
Grey points indicate there is no evidence of inequity at these points on the pathway.

For some metrics, the level of detail in the underlying datasets means we can be confident that the
metrics relate exclusively to patients on the relevant pathway. For example, the COPD pathway
metric relating to influenza vaccinations relates specifically to patients on primary care COPD
registers. For other metrics, this is not the case, for example, the hip arthritis pathway metric
relating to outpatient referrals, measures rates of all orthopaedic outpatient referrals, not just those
for hip arthritis. We provide some indication of the degree of ‘fit’ between the metric and the
pathway in Appendix B and the subsequent charts. This is also indicated on the charts, with the
level of transparency of each dot representing the extent to which the metric fits the pathway.

It shows that at the early part of the COPD pathway, activities are skewed towards patients living in
the most deprived areas, but at the end of the pathway the skew is reversed with people living in
the least deprived areas being more likely to receive secondary care treatments.

The Strategy Unit | Socio-economic inequalities in access to planned hospital care:
causes and consequences                                                                                                    21
https://csucloudservices-my.sharepoint.com/personal/rachel_caswell_mlcsu_nhs_uk/Documents/Documents/DSU/DSU project -/socio-
economic inequalities in access to planned hospital care - 210513 with adjusted hyperlinks.docx
One potential explanation for this finding is that patients living in the least deprived areas are in
greater need of secondary care treatments because they receive lower levels of care at earlier
stages of the pathway. However, we note that having adjusted for need, emergency COPD
hospital spells and deaths in hospital following an emergency COPD spell are higher among those
living in the most deprived areas. This suggests that the skew towards the most deprived in the
earlier parts of the pathway are not sufficient to slow disease progression relative to those living in
the least deprived areas.

The Strategy Unit | Socio-economic inequalities in access to planned hospital care:
causes and consequences                                                                                                    22
https://csucloudservices-my.sharepoint.com/personal/rachel_caswell_mlcsu_nhs_uk/Documents/Documents/DSU/DSU project -/socio-
economic inequalities in access to planned hospital care - 210513 with adjusted hyperlinks.docx
3.4       Heart failure
Heart failure is a chronic, progressive condition that occurs when the heart becomes too weak or
rigid to effectively pump blood around the body. The early stages of the disease can be managed
in primary care with the use of several forms of medication. As the condition progresses, there
may be a need to fit a cardiac pacemaker or similar device or to carry out surgery to repair heart
valves or clear blockages in an artery supplying the heart.

The chart below shows that heart failure patients living in the most deprived areas are more likely
to be identified by GPs and placed on a heart failure register. These patients are also more likely to
have their diagnosis confirmed with ECG, to receive several forms of medication (ACEs,
betablockers and sacubitril), to be referred to secondary care, and to be seen by a specialist in an
outpatient setting. However, patients with heart failure living in the least deprived areas are more
likely to receive treatments in secondary care, such as surgical valve repair.

The Strategy Unit | Socio-economic inequalities in access to planned hospital care:
causes and consequences                                                                                                    23
https://csucloudservices-my.sharepoint.com/personal/rachel_caswell_mlcsu_nhs_uk/Documents/Documents/DSU/DSU project -/socio-
economic inequalities in access to planned hospital care - 210513 with adjusted hyperlinks.docx
3.5       Arthritis of the hip
Arthritis is a term, used to describe several progressive, autoimmune disorders of the joints.
Osteoarthritis and rheumatoid arthritis are two common forms of arthritis affecting the hip that
cause pain and, stiffness and reduce the range of motion. Improvements to a patient’s lifestyle can
help, and over-the-counter medications can be used to manage pain and inflammation at the early
stages of the disease. As the condition progresses, physiotherapy and prescribed medications may
be required. When a patient’s hip pain or mobility has deteriorated sufficiently, they are often
offered surgery to replace the hip with an artificial joint. Modern hip prostheses last for many
years, but surgery to replace an artificial joint with another may sometimes be required.

Compared with those living in the least deprived areas, patients with hip arthritis living in the most
deprived areas are more likely to be identified by GPs and placed on an arthritis register. They are
also more likely to receive a face-to-face review in primary care and to be seen by a specialist in an
outpatient setting. Patients with hip arthritis living in the least deprived areas are, however, more
likely to receive a telephone consultation from a specialist and to receive a hip replacement.

The Strategy Unit | Socio-economic inequalities in access to planned hospital care:
causes and consequences                                                                                                    24
https://csucloudservices-my.sharepoint.com/personal/rachel_caswell_mlcsu_nhs_uk/Documents/Documents/DSU/DSU project -/socio-
economic inequalities in access to planned hospital care - 210513 with adjusted hyperlinks.docx
3.6       Cataracts
The term ‘cataracts’ describes a progressive condition in which the lens in a person’s eye becomes
cloudy, obscuring vision. The condition is usually diagnosed by a community optician who in turn
refers a patient to a specialist ophthalmologist. Surgery to replace the lens with an artificial one is
the only proven form of treatment.

Data on the early part of the cataracts pathway is difficult to obtain in the detail required for this
assessment. However, the available data, suggests that patients living in the most deprived areas
are more likely to receive a first outpatient appointment with a consultant. Cataract surgery can be
delivered in outpatient or an inpatient setting; the data suggests that people living in the most
deprived areas are more likely to receive inpatient surgery.

Note that our method of estimating need for cataract surgery is comparatively crude. The method
adjusts for some risk factors (e.g., age) but not for risk factors such as smoking, alcohol
consumption, diabetes, or steroid use. This may mean that our estimates understate the level of
need in the most deprived areas and overstate need in the least deprived areas.

The Strategy Unit | Socio-economic inequalities in access to planned hospital care:
causes and consequences                                                                                                    25
https://csucloudservices-my.sharepoint.com/personal/rachel_caswell_mlcsu_nhs_uk/Documents/Documents/DSU/DSU project -/socio-
economic inequalities in access to planned hospital care - 210513 with adjusted hyperlinks.docx
3.7       Four pathways
When we look at the data for the four pathways together, a more general picture emerges. In the
earlier parts of pathways, activity is generally skewed towards patients in need living in the most
deprived areas. These patterns tend to reverse in favour of patients living in the least deprived
areas only at the very end of the pathway, when secondary care treatments are provided.

The analysis in this chapter focuses on four pathways. Although these are high-volume pathways,
they constitute only a small minority of all planned hospital activity. The consistency of the results
should provide some confidence that the findings might generalise to other pathways; however
this can only be established definitively through additional analysis. The availability of pathway
metrics and suitable need data is likely to be the main barrier to such a comprehensive assessment.

The Strategy Unit | Socio-economic inequalities in access to planned hospital care:
causes and consequences                                                                                                    26
https://csucloudservices-my.sharepoint.com/personal/rachel_caswell_mlcsu_nhs_uk/Documents/Documents/DSU/DSU project -/socio-
economic inequalities in access to planned hospital care - 210513 with adjusted hyperlinks.docx
4. Possible drivers of inequalities in
          access to planned hospital care

Key findings
The late pathway skew towards the least deprived populations that has occurred in recent years
may be a function of various policy initiatives introduced to improve or control access to secondary
care treatments.

Access to NHS-funded private sector treatment is substantially higher in the least deprived
populations.

As waiting times improved between 2000 and 2014, the benefits were felt disproportionately by
those living in the least deprived areas.

Growth in rates of access to new imaging technologies tends to be slower in the most deprived
areas.

When the NHS seeks to limit access to certain forms of surgery, rates tend to fall more rapidly in
the most deprived areas.

When the NHS introduces new screening programmes, interventions resulting from those
programmes tend to increase more slowly in the most deprived areas.

In Chapters 2 and 3 we saw substantial and widespread inequities in access to planned hospital
care. These inequities have not always been present at this scale and they tend to emerge late in
the care pathway. Pinning down the causes or drivers of these changes is not straightforward. In
this chapter we offer our emerging theories and provide some supporting evidence. We regard
these theories as credible explanations, but further work is required to confirm them.

4.1       Differential impacts of health policies to improve or control
          access to planned hospital care
Improving access to planned hospital care has been a key theme of health policy since the early
2000s, reducing waiting times, maximising uptake of new diagnostic tests and, surgical procedures,
and rolling out screening programmes.

As NHS budgets became increasingly constrained following the economic downturn in 2008 and
2009, NHS policy turned to controlling access to certain low-value forms of secondary care. The

The Strategy Unit | Socio-economic inequalities in access to planned hospital care:
causes and consequences                                                                                                    27
https://csucloudservices-my.sharepoint.com/personal/rachel_caswell_mlcsu_nhs_uk/Documents/Documents/DSU/DSU project -/socio-
economic inequalities in access to planned hospital care - 210513 with adjusted hyperlinks.docx
policies recognised that NHS budgets were limited and that NHS resources should be spent on
those activities that generate the greatest utility.
Table 2: Examples of policies to…
improve access to planned hospital care: control access to planned hospital care:
Waiting times targets Polices on procedures of limited clinical value
Patient choice Referral management
NHS-funded access to private hospitals Lifestyle-based eligibility criteria
Many of these policies have been successful in their own terms, reducing average waiting times,
increasing capacity, making new technologies available, reducing supply of low-value interventions,
and so on.
In the remainder of the chapter, we explore whether the effects of these policies have been felt
differentially across socio-economic groups, leading to more rapid growth in planned hospital care
for those living in the least deprived areas. The examples given were chosen to test our theories,
rather than to illustrate them; further work would be required to assess the generalisability of these
results.
The Strategy Unit | Socio-economic inequalities in access to planned hospital care:
causes and consequences 28
https://csucloudservices-my.sharepoint.com/personal/rachel_caswell_mlcsu_nhs_uk/Documents/Documents/DSU/DSU project -/socio-
economic inequalities in access to planned hospital care - 210513 with adjusted hyperlinks.docxYou can also read