SOUND EVENT LOCALIZATION AND DETECTION USING CRNN ARCHITECTURE WITH - dcase
←
→
Page content transcription
If your browser does not render page correctly, please read the page content below
Detection and Classification of Acoustic Scenes and Events 2019                                             25–26 October 2019, New York, NY, USA

        SOUND EVENT LOCALIZATION AND DETECTION USING CRNN ARCHITECTURE WITH
                          MIXUP FOR MODEL GENERALIZATION

                    Pranay Pratik 1∗ , Wen Jie Jee 2∗† , Srikanth Nagisetty1 , Rohith Mars1 , Chong Soon Lim1 ,

                                                  Panasonic R&D Center Singapore
                                                          1

                        {pranay.pratik, srikanth.nagisetty, rohith.mars, chongsoon.lim}@sg.panasonic.com
                                          2
                                            Nanyang Technological University Singapore,
                                                       wjee001@e.ntu.edu.sg

                                     ABSTRACT                                         techniques for joint localization and classification of multiple sound
                                                                                      sources. In [4] authors proposed 2D-CNN based network for joint
             In this paper, we present the details of our solution for the            sound source localization and classification. In [5] authors intro-
        IEEE DCASE 2019 Task 3: Sound Event Localization and Detec-                   duced convolutional recurrent neural network architecture (CRNN),
        tion (SELD) challenge. Given multi-channel audio as input, goal               where the CNN module learns the audio spectral information fol-
        is to predict all instances of the sound labels and their directions-         lowed by the RNN module, that learn the temporal information.
        of-arrival (DOAs) in the form of azimuth and elevation angles.                This network architecture has been set as the baseline model in the
        Our solution is based on Convolutional-Recurrent Neural Network               DCASE2019 Task 3 challenge - Sound Event Localization & Detec-
        (CRNN) architecture. In the CNN module of the proposed architec-              tion. In [6] authors introduced two-stage training approach, which
        ture, we introduced rectangular kernels in the pooling layers to min-         shows improvement in the overall performance over [5]. In this ap-
        imize the information loss in temporal dimension within the CNN               proach the training of the network is split into two branches, i.e.,
        module, leading to boosting up the RNN module performance. Data               the SED branch and the localization branch.
        augmentation mixup is applied in an attempt to train the network for               In this paper, we proposed two deep CRNN architectures with
        greater generalization. The performance of the proposed architec-             log-mel spectrogram and generalized cross-correlation phase trans-
        ture was evaluated with individual metrics, for sound event detec-            forms (GCC-PHATs) as input features to the network. In the CNN
        tion (SED) and localization task. Our team’s solution was ranked 5th          module of one of the proposed network architecture, we restricted
        in the DCASE-2019 Task-3 challenge with an F-score of 93.7% &                 pooling in the frequency domain, this helps in preserving tempo-
        Error Rate 0.12 for SED task and DOA error of 4.2° & frame recall             ral information, boosting the performance of RNN module. Data
        91.8% for localization task, both on the evaluation set. This results         augmentation technique mixup was used in an attempt to general-
        showed a significant performance improvement for both SED and                 ize the network. We investigated the effect of mixup on each of the
        localization estimation over the baseline system.                             sub-task, SED and localization and compared our results with base-
          Index Terms— DCASE-2019, SELD, SED, Localization,                           line system provided by the DCASE-2019 challenge and with other
        CRNN, mixup                                                                   prior-arts.
                                                                                           The rest of the paper is organized as follows. In Section 2,
                                                                                      we presented the details on feature extraction, data augmentation
                               1. INTRODUCTION                                        technique and our proposed CRNN architectures. In Section 3, we
                                                                                      discuss experiments setup & compare our results with prior-arts.
        Sound event localization and detection (SELD) is a challenging                Finally, conclusion and future work is presented in Section 4.
        and well-researched topic in the field of acoustic signal processing.
        There are two sub-tasks for SELD, first: the sound event detection
        (SED), second: the sound source’s direction estimation. An ideal                                    2. METHODOLOGY
        SELD system would be able to detect & classify multiple sound
        events and for each detected sound event determines its direction             In this section, we present our methodology starting with input fea-
        of arrival. Signal processing algorithms have been traditionally              ture extraction description followed by CRNN architecture descrip-
        employed to address this challenging task. However performance                tion. In addition, we also discuss the data augmentation step used
        achieved by such methods are still limited under practical condi-             during training for improving model generalization. For training the
        tions.                                                                        network we adopted the strategy proposed in [6], where the model
            In recent research, deep learning based techniques have been              is first trained on SED task, then on localization task using the same
        applied individually for both SED and localization part of the SELD           network architecture.
        task. In [1, 2], it has been shown that CNN based network can
        detect and classify sound events with high accuracy. In [3], 1D-              2.1. Features
        CNN has been applied for solving the sound localization task. The
        recent trend in this field has been about developing deep learning            Input features plays a crucial role in training deep neural network.
                                                                                      In this work, the raw data is in the form of four-channel audio signal,
           ∗ Bothauthors contributed equally.                                         recorded at 48kHz sampling rate using a microphone array and was
           † Thiswork was done during an internship at Panasonic R&D Center           provided by DCASE Task-3 organizers [7]. The time domain multi-
        Singapore.                                                                    channel signals were first down-sampled to 32 kHz and then used

                                                                                199

https://doi.org/10.33682/gbfk-re38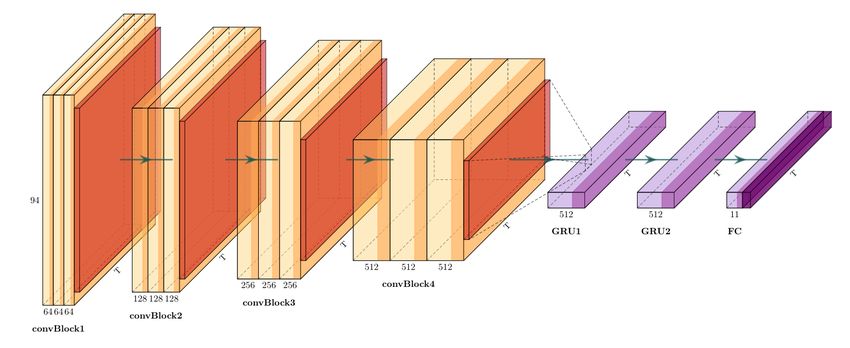
Detection and Classification of Acoustic Scenes and Events 2019 25–26 October 2019, New York, NY, USA
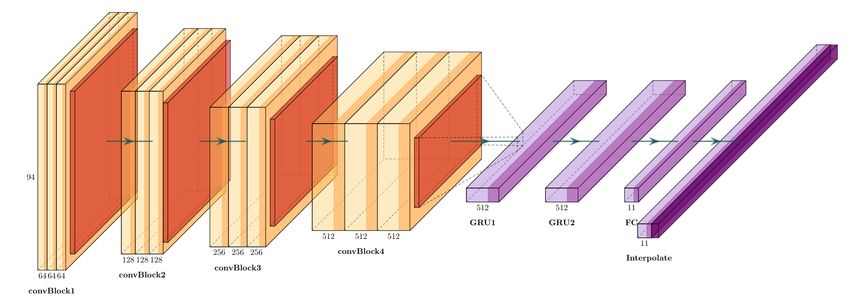
Figure 1: Base architecture TS-C2Rnn. Each convBlock contains three Conv2D layers followed by (2 × 2) average pooling. Each CNN
layer is followed by batch normalization and ReLU activation. convBlock1 receives the input features.
Figure 2: Proposed architecture TS-C2Rnn-P, with (2 × 1) average pooling after each convBlock, with no interpolation layer.
to extract log-mel spectrogram and GCC-PHAT features. ReLU activation. For convolutional layers in the convBlocks, 3 × 3
The log-mel spectrogram is commonly used as input feature kernel is used, with stride and padding fixed to 1. The number
in speech recognition [8] because of its similarity to frequency de- of filters used in convBlock1 to convBlock4 are {convBlock1 :
composition of the human auditory system. To obtain the log-mel 64, convBlock2 : 128, convBlock3 : 256, convBlock4 : 512}.
spectrogram, time domain audio signal is converted to the time- For performing average pooling in convBlocks, we used 2 × 2 win-
frequency (TF) domain using short-time Fourier transform (STFT). dow, with a stride of 2 × 2 . The CNN module of the network
This ensures that both the temporal and spectral characteristics of is followed by RNN module, which has two GRU layers, GRU-1
the audio data are utilized. After the frequency domain conversion, and GRU-2. The output of the GRU-2 layer is fed into fully con-
we extracted the log-mel spectrogram corresponding to each audio nected (FC) layer of size N, where N is the number of sound event
clip using 96 Mel bands. For the STFT parameters, we employ a classes. FC layer is followed by interpolate layer to ensure the fi-
frame length of 1024 points, with a hop length of 10 ms. nal number of the time frames is approximately equal to the original
GCC-PHAT is widely used for estimation of time difference of number of time frames of the input clip. This is necessary due to the
arrival (TODA) of acoustic signal between two microphones. A ba- presence of square kernels in the pooling layers in each convBlock.
sic frequency domain cross-correlation is estimated by the inverse- The output of the interpolate layer contains N class scores, azimuth
FFT of cross power spectrum. GCC is the improved version of and elevation values corresponding to each T time frames, where T
cross-correlation, it is estimated by adding a windowing (or filter- varies from clip to clip.
ing) function prior to the inverse transform to improve the estima- We proposed another network architecture TS-C2Rnn-P which
tion of the time delay, depending on the specific characteristics of is a modified version of TS-C2Rnn architecture as shown in Figure
the signals and noise. GCC-PHAT is the phase-transformed version 2. In the CNN module of TS-C2Rnn the 2 × 2 pooling across time
of GCC, which eliminate the influence of amplitude in the cross and frequency domain reduces the information both in frequency
power spectrum, hence only preserving the phase information [9]. and temporal dimension of feature maps. In order to preserve the
time domain information which may be critical for GRU perfor-
mance, we introduced 2 × 1 rectangular kernels in the CNN module
2.2. CRNN Architecture
pooling layers for TS-C2Rnn-P architecture. This results in restrict-
The base network architecture introduced in this work is inspired ing the pooling of feature maps in the frequency dimension.
from [6] and named as TS-C2Rnn as shown in figure 1 . The Both the proposed networks TS-C2Rnn & TS-C2Rnn-P), were
extracted audio features are provided as input to a CRNN archi- first trained on SED task and then on the localization task. In the
tecture. CNN module of TS-C2Rnn consist of 4 convolutional first stage, all features are fed into the network to train for SED
blocks, named convBlock1 to convBlock4. Each convBlock is fol- task and only the loss of SED is minimized. After SED have been
lowed by an average pooling layer. Within each convBlock there trained, the learned weights from the convBlocks in the SED branch
are 3 convolutional layers, followed by batch normalization and is transferred to the convBlocks in the localization branch to train
200Detection and Classification of Acoustic Scenes and Events 2019 25–26 October 2019, New York, NY, USA
for the localization task using the reference event labels to mask the audio. In this work, we only used TAU Spatial Sound Events 2019:
localization predictions. Microphone array dataset for all our experiments. The dataset con-
sist of multiple audio recordings from 4 channel, directional micro-
2.3. Data Augmentation: MIXUP phones arranged in a tetrahedral array configuration with overlap-
ping sound events recorded in different environments. Dataset is
For better model generalization, we adopted mixup [10] a data aug- divided into two sets, development set and evaluation set. The de-
mentation technique which is a popular for image classification velopment set consists of 400, one minute long recordings sampled
tasks. It has been illustrated in [10] that mixup scheme helps in at 48kHz, divided into four cross-validation splits of 100 recordings
alleviating undesirable behaviors of the deep neural network such each. The evaluation set consists of 100, one-minute recordings.
as memorization and sensitivity to adversarial examples. Mixup is a There are total 11 isolated classes of the sound events. We trained
data-agnostic data augmentation routine. It makes decision bound- our network using this 4 pre-defined cross-validation folds and the
aries transit linearly from class to class, providing a smoother esti- final results are the overall aggregated from the test data of all 4
mate of uncertainty. folds in the development set. The performance of the architecture
The idea behind mixup is that of risk minimization. We wish to is evaluated with individual metrics, for SED F-score and error rate
determine a function f that describes the relationship between input (ER) was considered and for localization task, direction of arrival
xi and target yi , and follows the joint distribution P (x, y). We can (DOA) error and frame recall (FR) were used. We trained our net-
minimize the average of the loss function ` (or expected risk) over work with an objective to achieve lower DOA error & ER and higher
P in the following manner FR & F-score.
Z Below is the list of prior arts and proposed architectures used
R(f ) = `(f (x), y)dP (x, y) , for experiments and evaluations.
where f (x) is a function that describes the relationship between in- • Baseline, which is the benchmark model [5] released by
put vector x and target vector y, ` is the loss function that penalizes DCASE-2019 Task-3 organizers. This network is based on the
the difference between the output of f (x) and target y. While P is CRNN architecture, and take magnitude & phase spectrogram
unknown is most practical cases, it can be approximated. There are as input features.
two such approximations raised in [10] namely empirical risk min- • SELDNet, this network has the same architecture as in Base-
imization [11] and vicinal risk minimization [12]. While the vici- line, but instead of magnitude & phase spectrogram, it takes
nal virtual input-target pairs are generated by addition of Gaussian log-mel spectrograms & GCC-PHAT as input features.
noise in [12], Zhang et al. [10] proposed the generation of virtual • Two-Stage (TS), this network has CRNN architecture and is
input and target pairs as such, based on two stage training methodology [6] .
X = λ × x1 + (1 − λ) × x2 , • TS-CRnn, same as our base network architecture TS-C2Rnn
(1) except only 1 GRU layer used as the RNN.
Y = λ × y1 + (1 − λ) × y2 ,
• TS-C2Rnn, our base network architecture as illustrated in Fig-
where λ is a weight drawn from the beta distribution with parame- ure 1 and explained in section 2.2 .
ters α, β = 0.2 and x1 , x2 , y1 and y2 are two pairs of input-target • TS-C2Rnn-P, the modified version of our base network archi-
pairs drawn randomly from the dataset. The parameters α and β tecture TS-C2Rnn, which has 2 × 1 kernel size for pooling
are chosen such that the probability density is denser in the domain layers, as illustrated in Figure 2 and explained in section 2.2.
0 < λ < 0.1 and 0.9 < λ < 1.0 which can be seen in Figure 3.
The average of the loss function can then be minimized over this Table 1 presents the performance results on development set
probability distribution approximation. w.r.t to prior-arts for SED and localization task, with the effect of
data augmentation technique, mixup. Compared with Baseline, our
base network TS-C2Rnn without mixup shows 12.6% and 50.2%
improvement on ER and F-score respectively for the SED task,
while for localization task it show 20° and 2.6% improvement on
DOA error and FR respectively. This result shows that deep CRNN
based architectures improves the performance for SELD task com-
pared to CNN based architecture.
In addition, TS-C2Rnn-P architecture which uses average pool-
ing with kernel size of 2 × 1 in the CNN module, shows the best
improvements with the best score across all evaluation metrics. For
the SED task, TS-C2Rnn-P achieved an error rate of 0.149 and an F-
score of 91.9%. For the localization evaluation metrics, it achieved
a DOA error of 4.588 °and frame recall of 0.896. It shows improve-
Figure 3: Beta distribution with α, β = 0.2
ment of 13% and 4° respectively on ER and DOA error, over the
state-of-art Two-Stage(TS) network. This result infers that 2 × 1
3. EXPERIMENTS AND RESULTS pooling in the CNN module of TS-C2Rnn-P, helps it to learn the
spectral information efficiently, and at the same time minimize the
DCASE2019 Task-3 organizers has provided two datasets [7], TAU loss of information in the temporal dimension. In turn there is more
Spatial Sound Events 2019: Ambisonic, Microphone Array datasets information available to the RNN module, which helps in effec-
of an identical sound scene with only difference in the format of the tively learning the temporal information. This lead to boosting up
201Detection and Classification of Acoustic Scenes and Events 2019 25–26 October 2019, New York, NY, USA
no mixup with mixup
ER F-score DOA(°) FR ER F-score DOA(°) FR
Baseline 0.350 0.800 30.800 0.840 — — — —
SELDNet 0.213 0.879 11.300 0.847 — — — —
Two-Stage (TS) 0.166 0.908 9.619 0.863 0.194 0.888 8.901 0.839
TS-CRnn 0.186 0.897 9.450 0.857 0.200 0.888 7.866 0.841
TS-C2Rnn 0.174 0.901 8.881 0.862 0.176 0.903 7.236 0.856
TS-C2Rnn-P 0.147 0.916 5.631 0.902 0.149 0.919 4.588 0.896
Table 1: Performance evaluation of the proposed network architecture on the development set comparing with prior-arts
DCASE-2019 Task-3 Evaluation-result
Team Name Rank ER F-score DOA(°) FR
Kapka SRPOL [13] 1 0.08 0.947 3.7 0.968
Cao Surrey [14] 2 0.08 0.955 5.5 0.922
Xue JDAI [15] 3 0.06 0.963 9.7 0.923
He THU [16] 4 0.06 0.967 22.4 0.941
Jee NTU (our) 5 0.12 0.937 4.2 0.918
Table 2: Comparison of top 5 results of DCASE-2019 Task-3.
of the overall performance of the proposed TS-C2Rnn-P network. to be suppressed by increasing the number of layers. This can be
Table 1 also illustrate the effect of data augmentation i.e. mixup seen from the F-score converging to 0.904 for networks tested with
on the performance of above mention networks. Comparing the re- mixup applications in Table 3.
sults we can infer that upon applying the mixup the F-score slightly The DOA error could be improved further by learning from
dropped while the DOA error improved. We realized that the mixup the trained weights of a mixup-applied SED task instead of a non-
is having positive effect on improving the localization task perfor- mixup-applied SED task although that would adversely affect the
mance but at the same time it is showing a slight drop or no change results of SED predictions. Thus, a balance must be found in the
in performance for the SED task. We applied a new training strat- use of mixup, depending on the use case and the allowance for error
egy of applying mixup only on the localization task during training, in SED and DOA predictions.
as there is no effect of mixup on SED task. Table 2 presents the top 5 teams results on the DCASE-2019
Task 3 evaluation set. In this Table ”Jee NTU” refers to the results
mixup on localization task only of TS-C2Rnn-P architecture proposed in this work. From the table
ER F-score DOA(°) FR we can infer that our DOA error performance, which is the rank 5
system has given a positive improvement over rank 2-4 systems. In
Two-Stage 0.175 0.903 8.056 0.861
addition our overall F-score for the SED task is comparable with
TS-C2Rnn 0.171 0.903 7.486 0.861
other systems. With the usage of both the data sets provided by
TS-C2Rnn-P 0.144 0.904 4.746 0.902
DCASE-2019 Task 3 and including mixup, we believe TS-C2Rnn-
P can yield similar results as the top system.
Table 3: Results from using mixup in localization branch training
only. 4. CONCLUSION & FUTURE WORK
Comparing between the performance of Two-Stage, TS-C2Rnn In this paper, we proposed CRNN architecture with mixup as data
and TS-C2Rnn-P in Table 1 (no mixup) and Table 3 (mixup on lo- augmentation technique for SELD task. Experimentally, we have
calization task only), an improvement could be seen across all four shown that using mixup helps in improving the localization perfor-
evaluation metrics for all of the networks. In contrast while compar- mance. In addition, usage of rectangular kernels for the pooling
ing the results of these network in Table 1 (with mixup) and Table layers helps in overall performance of SED and localization. Ex-
3, only three metrics showed an improvement while DOA error in- perimental results show that our proposed network architecture TS-
creased. This abnormality tell us that, training for localization task C2Rnn-P with mixup is shown to significantly outperform the base-
is built upon the trained weights of the SED task, therefore for im- line system for both SED and localization task. For future studies,
proving the results in the localization branch, SED results are also the changing of parameters α and β in mixup can be investigated.
essential. Although mixup appear to slightly drop in the perfor- The parameters were chosen so as not to create too many vastly
mance score for SED predictions, but its negative effect on SED different virtual input-target pairs. There might be a beneficial im-
score, appears to have a positive performance surge on the localiza- provement if the λ is less heavily weighted to one side of the input-
tion task. The negative effects of mixup on the SED branch appeared target pair.
202Detection and Classification of Acoustic Scenes and Events 2019 25–26 October 2019, New York, NY, USA
5. REFERENCES [16] J. Zhang, W. Ding, and L. He, “Data augmentation and prior
knowledge-based regularization for sound event localization
[1] A. Kumar and B. Raj, “Deep cnn framework for audio event and detection,” DCASE2019 Challenge, Tech. Rep., June
recognition using weakly labeled web data,” arXiv preprint 2019.
arXiv:1707.02530, 2017.
[2] S. Hershey, S. Chaudhuri, D. P. Ellis, J. F. Gemmeke,
A. Jansen, R. C. Moore, M. Plakal, D. Platt, R. A. Saurous,
B. Seybold, et al., “Cnn architectures for large-scale au-
dio classification,” in 2017 ieee international conference on
acoustics, speech and signal processing (icassp). IEEE,
2017, pp. 131–135.
[3] J. Vera-Diaz, D. Pizarro, and J. Macias-Guarasa, “Towards
end-to-end acoustic localization using deep learning: From
audio signals to source position coordinates,” Sensors, vol. 18,
no. 10, p. 3418, 2018.
[4] W. He, P. Motlicek, and J.-M. Odobez, “Deep neural net-
works for multiple speaker detection and localization,” in
2018 IEEE International Conference on Robotics and Au-
tomation (ICRA). IEEE, 2018, pp. 74–79.
[5] S. Adavanne, A. Politis, J. Nikunen, and T. Virtanen, “Sound
event localization and detection of overlapping sources using
convolutional recurrent neural networks,” IEEE Journal of Se-
lected Topics in Signal Processing, vol. 13, no. 1, pp. 34–48,
March 2019.
[6] Y. Cao, Q. Kong, T. Iqbal, F. An, W. Wang, and M. D.
Plumbley, “Polyphonic sound event detection and localization
using a two-stage strategy,” arXiv preprint arXiv:1905.00268,
2019. [Online]. Available: https://arxiv.org/pdf/1905.00268.
pdf
[7] S. Adavanne, A. Politis, and T. Virtanen, “A multi-
room reverberant dataset for sound event localization and
uetection,” in Submitted to Detection and Classification of
Acoustic Scenes and Events 2019 Workshop (DCASE2019),
2019. [Online]. Available: https://arxiv.org/abs/1905.08546
[8] B. Logan et al., “Mel frequency cepstral coefficients for music
modeling.” in ISMIR, vol. 270, 2000, pp. 1–11.
[9] J. Hassab and R. Boucher, “Performance of the generalized
cross correlator in the presence of a strong spectral peak in the
signal,” IEEE Transactions on Acoustics, Speech, and Signal
Processing, vol. 29, no. 3, pp. 549–555, 1981.
[10] H. Zhang, M. Cisse, Y. N. Dauphin, and D. Lopez-Paz,
“mixup: Beyond empirical risk minimization,” arXiv preprint
arXiv:1710.09412, 2017.
[11] V. N. Vapnik, “Statistical learning theory,” vol. 1, 1998.
[12] O. Chapelle, J. Weston, L. Bottou, and V. Vapnik, “Vicinal risk
minimization,” in Advances in neural information processing
systems, 2001, pp. 416–422.
[13] S. Kapka and M. Lewandowski, “Sound source detection, lo-
calization and classification using consecutive ensemble of
crnn models,” DCASE2019 Challenge, Tech. Rep., June 2019.
[14] Y. Cao, T. Iqbal, Q. Kong, M. Galindo, W. Wang, and
M. Plumbley, “Two-stage sound event localization and detec-
tion using intensity vector and generalized cross-correlation,”
DCASE2019 Challenge, Tech. Rep., June 2019.
[15] W. Xue, T. Ying, Z. Chao, and D. Guohong, “Multi-beam and
multi-task learning for joint sound event detection and local-
ization,” DCASE2019 Challenge, Tech. Rep., June 2019.
203You can also read