South Africa's National Parks: Overview of the Kruger Malaise Program
←
→
Page content transcription
If your browser does not render page correctly, please read the page content below

South Africa’s National Parks:
Overview of the Kruger Malaise Program
                    Michelle van der Bank1 Michelle D’Souza2, Ryan Rattray1,Paul Hebert2
  1   The African Centre for DNA Barcoding, Department of Botany & Plant Biotechnology, University of Johannesburg, PO Box 524 Auckland Park, 2006
                                    2 Centre for Biodiversity Genomics, University of Guelph, Guelph, Ontario, Canada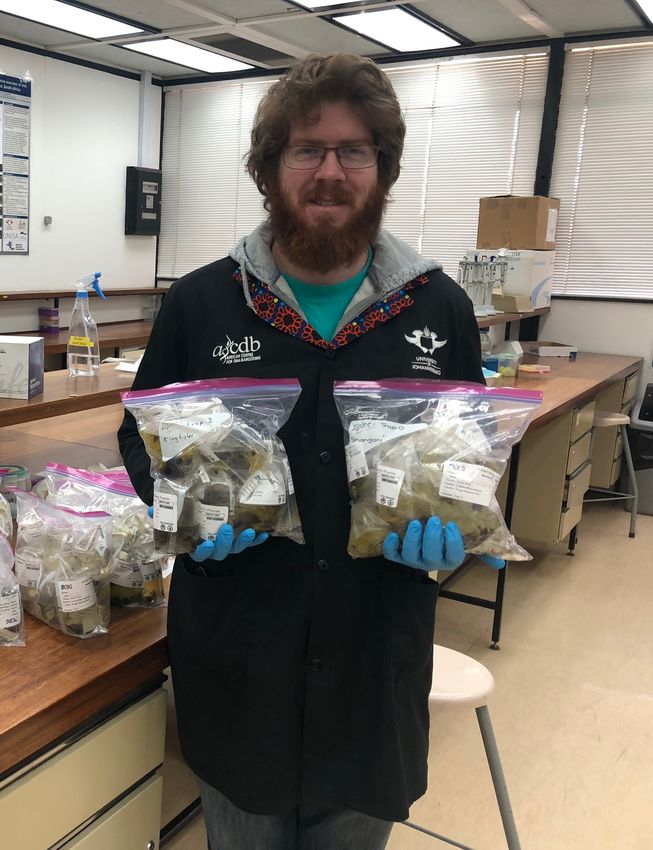
National Parks

 • Megadiverse country with three biodiversity hotspots

 • A Protected Areas Network - 1,527 National Parks, nature reserves,
   wilderness areas, Heritage sites
 • 19 National Parks (selected on affordability of land rather than on the
   biological diversity within them)
Plants - Gap Analysis

 What is the degree to which the endemic flora is
 conserved within the country’s Protected Areas Network?

                                                           Only 67% of the flora is protected
                                                           within the protected areas
                                                           network, of which 80% are of low
                                                           conservation concern.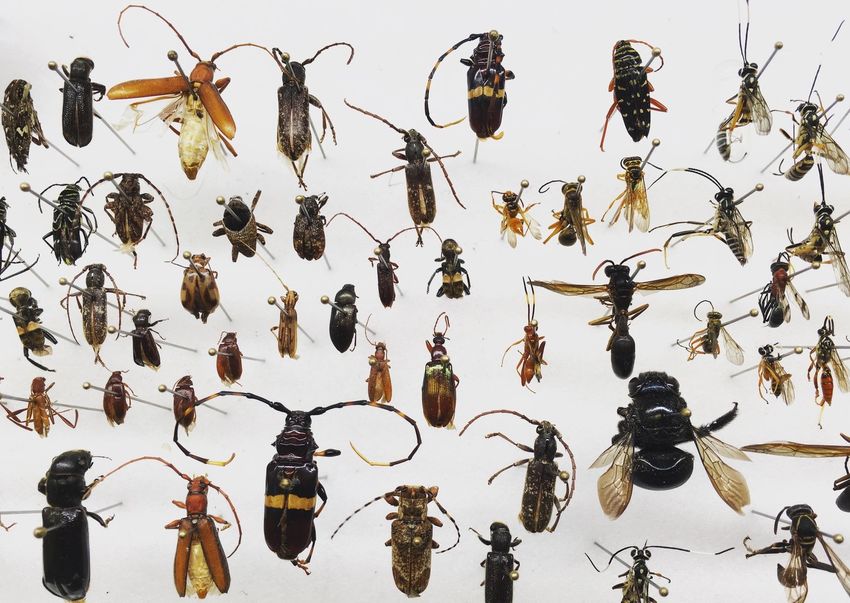
Plants - Gap Analysis

Only 47% of the country has been well sampled         Large gaps in availability of DNA sequences
                                                                     (39% available)

                                  What is the situation regarding insects?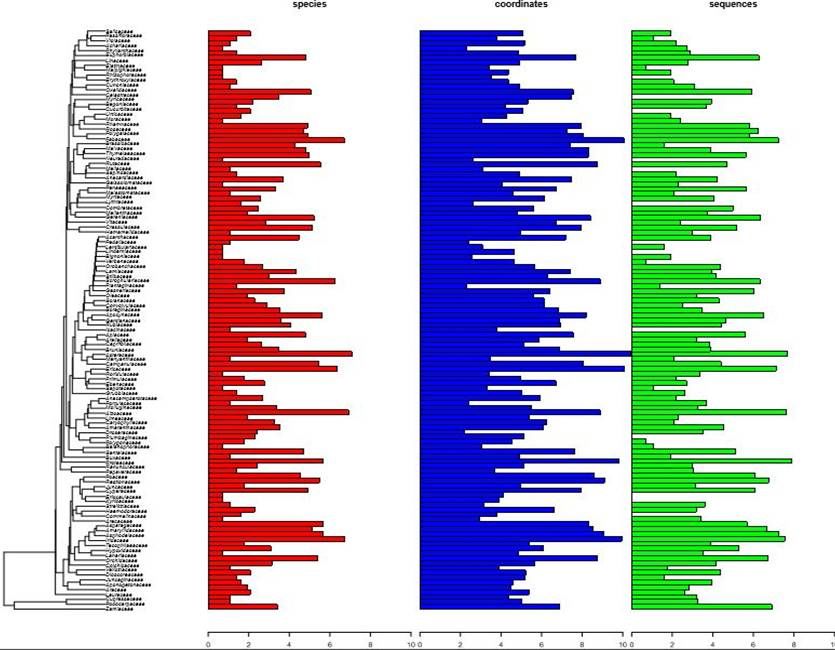
Insect Diversity

         Shortage of data on African insect species richness

                     Last comprehensive count on insect species for southern Africa
                     published in 1995 (Scholtz & Chown) – 43,565 species

            Registered
            projects in
            National
            Parks on
            invertebrates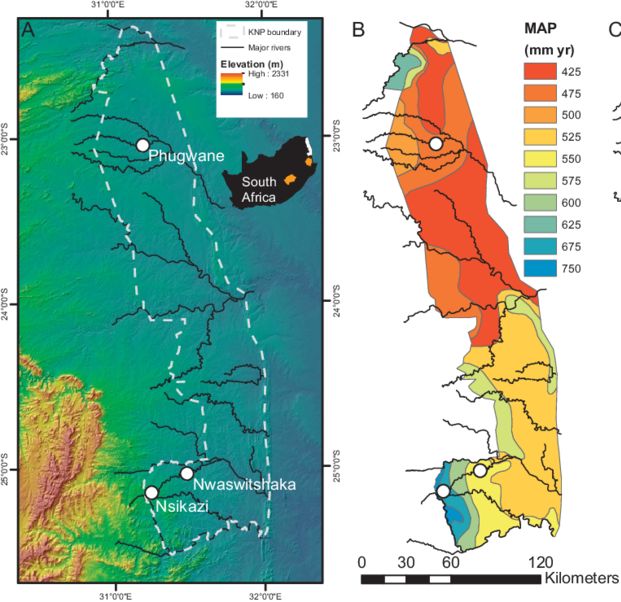
Kruger Malaise Program (KMP)

                               Map from Chadwick et al., (2013)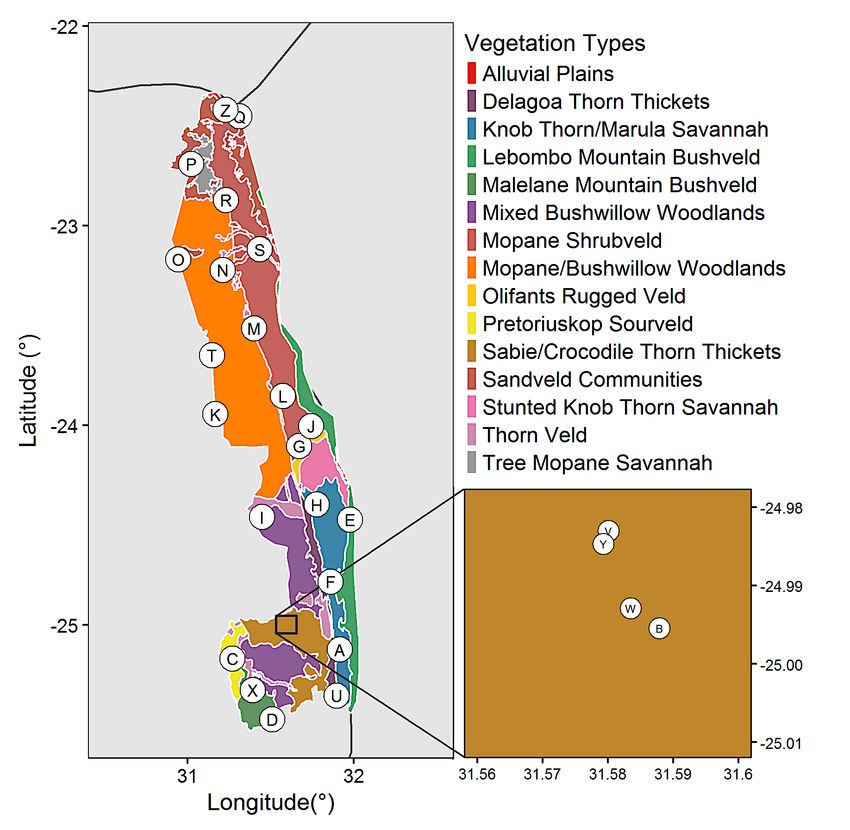
KMP - Aim & Objectives
The KMP aims to examine pattern of variation in species diversity and biomass of arthropod
  communities in KNP by coupling a year-long sampling program (weekly collections) with
                   subsequent DNA barcode analysis of the specimens.

     1        To show that DNA barcoding can enable rapid, low-cost evaluations of the
              species composition of arthropod communities in National Parks

                2         To quantify seasonal and spatial patterns of variation in arthropod
                          biomass in Kruger National Park

     3        To provide baseline data on arthropod community structure and species
              diversity in Kruger National Park to evaluate future changes

                          To provide detailed information on species
                4         distributions to help South Africa meet its reporting obligations
                          under the CBD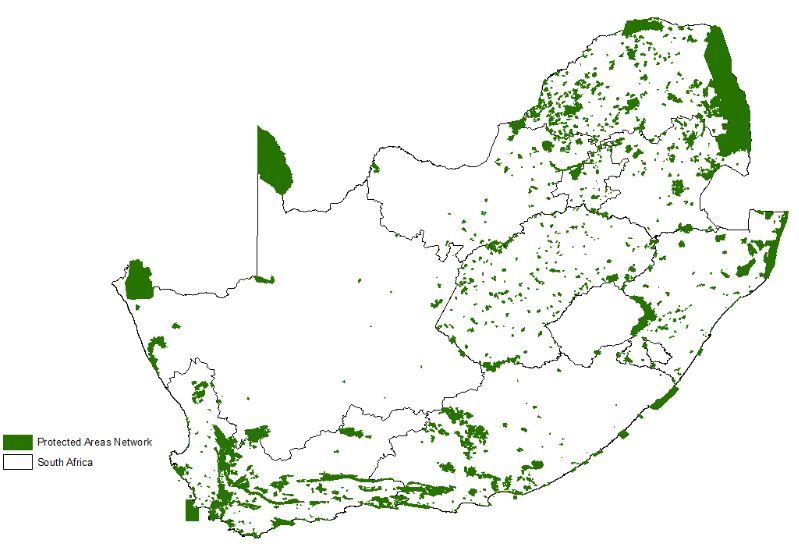
KMP – The Team

                 Ryan Rattray, Michelle D’Souza, Zandisile Shongwe

                     Ross Stewart              Danny Govender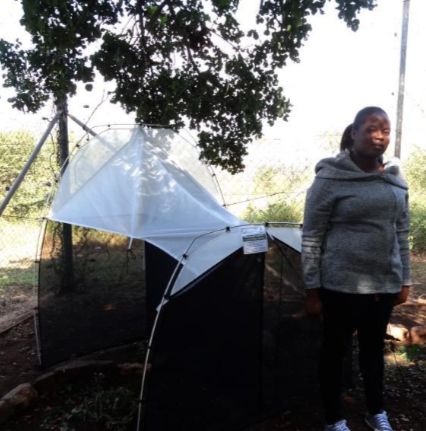
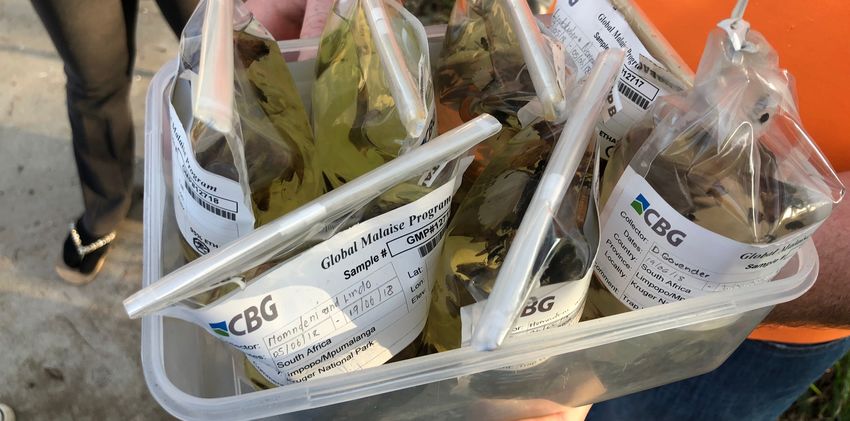
KMP – Deployment of malaise traps
                                                   JULY 2018: Collect first batch of 194
                                                          samples (24/26 traps)

MAY 2018: Deployed 26 malaise traps (22 sections
        across 11/15 vegetation types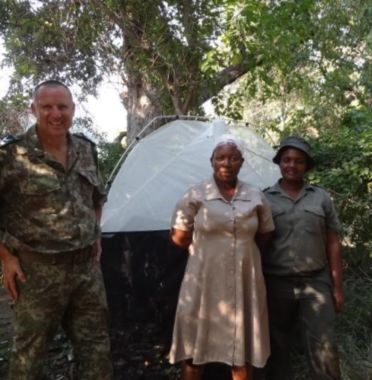
KMP – First Results

• On average 8.1 (+ 0.27) samples per site
• + 475 specimens per sample = Estimated 642,200
  specimens for programme
KMP – Sanger Sequence Recovery & Quality

• 95 Specimens from 24 traps analysed (2,280)

• 83% of specimens generated a sequence

• 77% had sequences >500bp resulting in OTU
  assignment

                      17%!

                6%!          500+ bp

                             1-499 bp

                             0 bp

                                        77%!

• Sequencing success ranged between 66-96%
  across sites
KMP – Number of OTUs recovered
• 768 unique OTUs
• On average 49 OTUs
(36-63) OTUs per
trap with 24 (12-35)
OTUs unique
Number of OTUs (black circles), total OTUs (solid bars) and unique OTUs (faded bars)KMP – Number of families identified = 117
1
2
3 4
5
Five most OTU rich families: 1. Cecidomyiidae (56 OTUs)
2. Ceratopogonidae (49 OTUs) Diptera
3. Chironomidae (44 OTUs)
4. Cicadellidae (44 OTUs) - Hemiptera
5. Platygastridae (37 OTUs) - HymenopteraKMP – Estimated number of OTUs
Kruger Na*onal Park Magaliesburg
iii
Species accumulation curve for arthropods collected in KNP and Magaliesburg grassland. Solid line represents the specimen-based
rarefaction curve while the dashed line segment extrapolates the curve to double the observed sample size. Shaded area indicates
the 95% confidence intervals (200 replications) and the solid dot represents the observed species richness.
• Preliminary OTU accumulation curve indicates 60% of estimated 1,915 (+50) UTUs still needs
to be sampled
• If compared to Magaliesberg and correct it to similar specimen numbers the total estimate
for KNP is approximately 6,000 OTUs
• Number of described species in South Africa +44,000
• Through this program we could potentially uncover
14% of the known diversity in a single yearKMP - Summary
Overall, the sequencing success rate indicates that samples are being
collected appropriately with minimal specimen and DNA degradation
during transport
With only 2280 specimens sequenced, high diversity (768 unique
OTUs) has been uncovered indicating both significant diversity in
Kruger National Park as well as variation in diversity across traps
in the park
• November 2018
• February 2019
• May 2019Global Spore Sampling Project (GSSP)
• Project managed by University of Helsinki
• Network involves 50 confirmed sampling locations that covers all continents
• Start of project: 01 Oct 2018Acknowledgements
Thank you!
Partner Institutions:You can also read