Sp Mortgage Bank and Savings Banks Group - Investor Presentation June 2019

 
CONTINUE READING
Sp Mortgage Bank and Savings Banks Group - Investor Presentation June 2019
Sp Mortgage Bank and
Savings Banks Group
     Investor Presentation
          June 2019
Sp Mortgage Bank and Savings Banks Group - Investor Presentation June 2019
Agenda

I     Group Structure and Strategy                  p. 4

II    Market Position                               p. 8

III   Financials and Funding                        p. 16

IV    Sp Mortgage Bank & Contemplated Transaction   p. 24

V     Macro Outlook                                 p. 33

VI    Appendices                                    p. 37

                                                            2
Sp Mortgage Bank and Savings Banks Group - Investor Presentation June 2019
Summary of the Savings Banks Group
                     • The Savings Banks Group is the oldest banking group in Finland consisting of 21 Savings Banks across the country as well as entities providing products and
                         services to the Savings Banks
                     •   The Group has close to 500,000 customers and about 150 branch offices
The Savings Banks
                     •   The main focus is on retail customers which comprise 74% of lending, predominantly in form of mortgages. Other target groups include SMEs (19% of
Group                    lending) and agricultural customers (7% of lending)
                     •   The Group has approximately a 5% market share in household lending and a 4% market share in household deposits
                     •   In 2018, the Savings Banks Group had on average 1,386 employees

The Amalgamation of •    The 21 Savings Banks, Central Bank of Savings Banks Finland (CBSBF), Sp Mortgage Bank and their central institution Union Coop together with certain other
                         product and service companies form the Amalgamation of Savings Banks (as laid down in the Amalgamations Act)
Savings Banks       •    Under the Amalgamations Act, the Savings Banks, CBSBF, Sp Mortgage Bank and the Union Coop are jointly liable for each others’ debts and commitments

                     •   Total assets of the Group were EUR 11.7bn at the end of 31 December 2018. The Group’s profit before taxes amounted to EUR 36.4m
                     •   Loan book of EUR 8.5bn consists mainly of residential mortgages with low loan loss impairments of 0.04% at the end of December 2018
Financial position   •   Large and stable deposit base of EUR 6.9bn comprises the largest part of the Group’s funding
                     •   Strong capital position is reflected by a CET1 ratio of 17.6% and a total capital ratio of 18.2% at the end of 31 December 2018
                     •   Solid leverage ratio of 8.6% at the end of 31 December 2018 (Tier 1 Capital / Total Liabilities)

                     • S&P Global Ratings has assigned ‘A-/A-2’ long- and short-term counterparty credit ratings to CBSBF, the entity responsible for senior unsecured financing of
                         the Group. The outlook on the ratings is stable. As the central credit institution CBSBF’s ratings reflect the wider Group's franchise and creditworthiness
Funding & Ratings    •   Sp Mortgage Bank is responsible for issuance of covered bonds within the Group and issued cover bonds are rated ‘AAA’ by S&P Global Ratings
                     •   The 100% Finnish prime mortgage cover pool is well diversified, with a majority of the pool located in growth centres and their close proximity. The pool
                         has no non-performing loans and has average LTV of 58.5% (indexed) as of 31 March 2019

                                                                                                                                                                                       3
Sp Mortgage Bank and Savings Banks Group - Investor Presentation June 2019
Group Structure and
     Strategy
Sp Mortgage Bank and Savings Banks Group - Investor Presentation June 2019
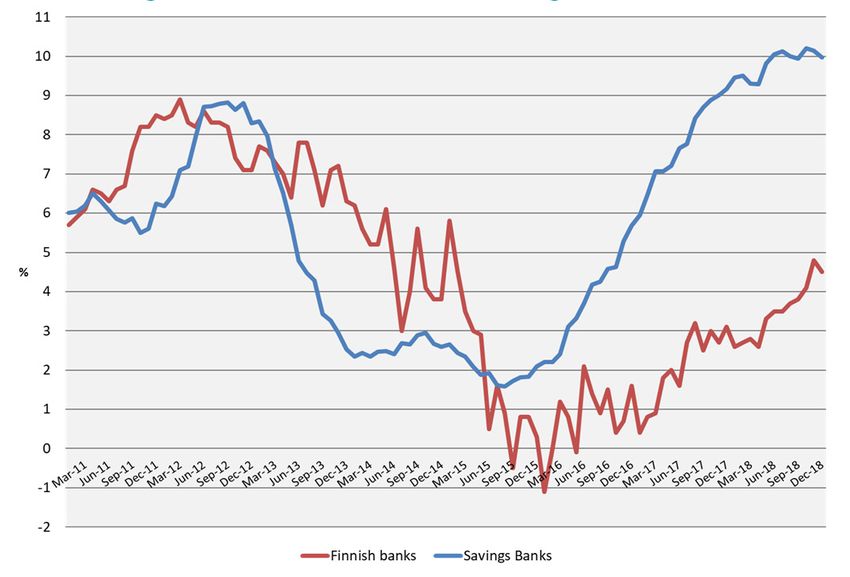
Structure of the Savings Banks Group

                                                                                                       JOINT LIABILITY
                              Member Savings Banks                                                      The member credit institutions in the
                                                                                                        Amalgamation share joint liability for each
                                Retail banking operations
                                                                                                        others’ debts and commitments
                             Savings Banks’ Union Coop
                                    Strategic steering
                                    Risk management                   100%
                                       Supervision

           Central Bank of
                                                     Sp Mortgage Bank Plc                              THE AMALGAMATION
      Savings Banks Finland Plc
          Central Bank operations                        Mortgage Bank business                         Sp-Fund Management and Savings Bank
                                    94.7%                                         100%                  Services Ltd are part of the Amalgamation
                                                                                                        but not part of the joint liability since they
        Sp-Fund Management                                                                              are not a member credit institutions
                                                  Savings Bank Services Ltd
            Company Ltd
             Fund management                               Back Office company
                                    92.6%                                         100%

                                                                                                       THE SAVINGS BANK GROUP
Sb Life Insurance Ltd                 Sp-Koti Oy                 Säästöpankkien Holding Oy
                                                                                                        The Group includes also product companies
    Life insurance
                     81.2%
                                    Real estate agency                  Strategic holdings    80.1%
                                                                                                        jointly owned by the Savings Banks as well as
                                                         100%
                                                                                                        the associated company PP-Laskenta which
                                                                                                        do not belong to the Amalgamation but are
                                Associated company                                                      consolidated to the Group
                                       PP-Laskenta
                                                         25%
                                                                                         Ownership %

                                                                                                                                                         5
Sp Mortgage Bank and Savings Banks Group - Investor Presentation June 2019
Growth and profitability of retail banking are
       key questions addressed in the strategy

 Profitability   • All savings banks showed positive results, but improvement is needed in profitability

                 • Number of customers has increased and quality of relationships has improved, but the growth
                   must be further accelerated

 Customers       • Number of customer meetings (per day, per person) must be increased

                 • Customer satisfaction is very high among the existing customers, this strength must be leveraged
                   to create new customer relationships

                 • The banking group is much more united than it was some years ago, but there is still room to
                   improve efficiency and scalability by more effective co-operation and coordination
Banking group
                 • The Group must jointly and unanimously commit to significant investments in the coming years
                   to build a fully digital banking platform

                                                                                                                      6
Sp Mortgage Bank and Savings Banks Group - Investor Presentation June 2019
Successful strategy execution requires success in two main things

1. Build on strengths by differentiating with customer
                                                                                              VISION 2021
experience                                                              Active and trusted partner in customers’ financial matters
Provide the customers with the best combination of digital and
personal services
Increase sales activity and subject-matter expertise in personal/SME
finance
                                                                                                                                              ♥   ♥ ♥
Leverage the winning customer experience to wider audience, not just
the current customers                                                    FINANCIALS        COMPETITIVE        OPERATING     CABABILITIES       BRAND
                                                                                           ADVANTAGE           MODEL

                                                                       Steadily growing    Savings Banks’       Local for        High          Known as
                                                                        and profitable        customer        customers,    performing and      trusted
2. Improve retail banking profitability                                    banking        experience – the    united and    versatile team    partner on
                                                                          operation       best in combining     efficient         of          customers’
Increase income                                                                            digital services    internally    professionals   side advising
   Increase number of customers, increase share of wallet                                 and high value-                                    in financial
   Innovate new services                                                                  added personal                                       matters
                                                                                               services
Improve operational efficiency
   Harmonise, centralise, and automate processes
   Maximise time spent with customers

                                                                                                                                                    7
Sp Mortgage Bank and Savings Banks Group - Investor Presentation June 2019
Market Position
Sp Mortgage Bank and Savings Banks Group - Investor Presentation June 2019
The Savings Banks Group operates countrywide

•   A group of 21 financially solid Savings Banks as well as collectively owned product
    and service companies

•   Operations across Finland offering its customers a complete package of financial
    products and services

•   Total assets of EUR 11.7 bn, loans of EUR 8.5 bn and total deposits of EUR 6.9 bn

•   483,000 customers, with main focus on private customers (74 % of lending), small
    and medium sized businesses (19 %) and agricultural and forestry customers (7 %)

•   Savings Banks’ customers have access to: about 150 branches, 24 automated
    service and payment points, online banking via net bank and mobile bank

•   The Group is a part of European Savings Banks network (ESBG)

                                                                                          9
Sp Mortgage Bank and Savings Banks Group - Investor Presentation June 2019
The Savings Banks Group’s market share increasing
                                                           Savings Banks’ customers as % of the Finnish population

Source: Source: Statistics Finland & Savings Banks Group

                                                                                                                     10
The Customer Experience Index improving and among the highest

                                                                                                       Year               2018      2017      2016      2015
Industry Average                                               74.4
                                                                                                       POP Pankki         86.8      83.8      82.0      82.4
     POP Pankki                                                                            86.8
                                                                                                       Savings Banks      82.8      82.1      81.6      80.5
  Savings Banks                                                                     82.8
                                                                                                       Handelsbanken      80.1      79.6      80.1      81.9
 Handelsbanken                                                               80.1
                                                                                                       S-Bank             79.0      N/A       N/A       75.0
           S-Bank                                                            79

      OP-Group
                                                                                                       OP-Group           76.6      78.9      78.5      78.2
                                                                      76.6

              Aktia                                             75.1                                   Aktia              75.1      77.5      77.3      79.8

   Danske Bank                                          72.2                                           Danske Bank        72.2      72.0      69.9      70.8

          Nordea                                67.4                                                   Nordea             67.4      70.9      65.1      71.8

                           50   55     60      65       70            75          80       85     90

                                                                                                       The Customer Experience Index looks at
                       EPSI Rating Customer Experience Index 2018                                      Benefit: Does the product match what the customer needs?
                                                                                                       Ease: How simple is it to work with the company?
                                                                                                       Pleasantness: How pleasant is it to work with the company?

     Source: EPSI Rating

                                                                                                                                                                    11
Continuous growth in Savings Banks’ loan portfolio
                                          (including Sp Mortgage Bank)

        Annual loan growth, %                              Savings Banks’s market share in loans
        Savings Banks vs. Finnish banking sector           Savings Banks vs. Finnish banking sector

Source: Bank of Finland & Savings Banks Group

                                                                                                      12
Savings Banks growing predominantly in mortgages

       Annual mortgage loan growth, %                     Savings Banks’ market share in
       Savings Banks vs. Finnish banking sector           mortgage loans
                                                          Savings Banks vs. Finnish banking sector

Source: Bank of Finland & Savings Banks Group

                                                                                                     13
Savings Banks’ mortgage margins remaining around industry average
        whilst the Group is maintaining good lending growth

 Source: Bank of Finland & Savings Banks Group

                                                                14
Strong growth in the Savings Banks Group’s deposit base

                Deposits annual growth, %-change                               Deposits market share
                                  Savings Banks vs. Finnish banking sector   Savings Banks vs. Finnish banking sector
                                           Euroarea eurodeposits

Source: Bank of Finland & Savings Banks Group

                                                                                                                        15
Financials and Funding
Key financials of Savings Banks Group

                                              FY2018                                      FY 2017                                     FY 2016                                     FY 2015

  Profit before tax                        EUR 36.4m                                   EUR 88.2m                                    EUR 69.6m                                   EUR 69.7m

  Net interest
                                          EUR 152.7m                                  EUR 142.2m                                   EUR 131.7m                                  EUR 125.0m
  income

  Cost-to-income                               84.3%                                       64.7%                                       64.4%                                        63.4%

                                      Amalgamation :                               Amalgamation:                                Amalgamation:                               Amalgamation:
  Capital adequacy                   Total capital 18.2%                        - Total capital 19.1%                        - Total capital 19.5%                       - Total capital 18.8%
                                       - CET1 17.6%                                 - CET1 18.2%                                 - CET1 18.5%                                - CET1 17.8%

  Leverage ratio*                               8.6%                                        8.8%                                        9.1%                                         9.2%

  Loans and
                                           EUR 8.6bn                                    EUR 7.8bn                                   EUR 7.0bn                                   EUR 6.4bn
  advances
  Total assets                            EUR 11.7bn                                   EUR 11.3bn                                  EUR 10.4bn                                   EUR 9.2bn

  Personnel                                    1,386                                       1,343                                        1,270                                       1,230
                              *The leverage ratio has been calculated according to the known regulation, and it describes the ratio of the Amalgamation’s Tier 1 capital to total liabilities.

Source: Savings Banks Group

                                                                                                                                                                                                 17
Savings Banks Group – Overview of income statement

     Income statement (EUR thousand)         FY2018    FY 2017    FY 2016

  Net interest income                       152,704    142,176    131,693

  Net fee and commission income              84,486     79,159     71,428

  Net trading income                         -24,332     3,156        -56
  Net investment income                       4,979     39,065     17,809
  Net life Insurance income                  13,163     15,552     11,810
  Other operating revenue                     3,669      3,083     12,692
  Total operating revenue                   234,670    282,191    245,376
  Operating expenses                        -197,719   -182,693   -168,792
  Net impairment loss on financial assets     -3,868    -13,265     -8,411
  Associate’s share of profits                3,323      1,977      1,430
  Profit before tax                          36,408     88,210     69,603
  Taxes                                       -5,767    -16,316   -12,406
  Profit                                     30,640     71,894     57,197

Source: Savings Banks Group

                                                                             18
Savings Banks Group – Overview of assets and liabilities
12,000                                                                                               12,000
         EURm                                   1.5%, PPE, Intangible assets & other items                                  0.4%, Basic capital & Non-controlling interest
                                                                                                              EURm
                                                0.8%, Loans and advances to credit institutions                             2.1%, Reserves
                                                1.0%, Financial assets at fair value & Derivatives
                                                                                                                            6.3%, Retained earnings
                                                7.2%, Cash and cash equivalents
                                                                                                                            1.9%, Other liabilities
                                                                                                                            1.9%, Liabilities to credit institutions
10,000                                           7.2%, Life insurance assets                         10,000
                                                                                                                            6.8%, Life insurance liabilities

                                                 9.8%, Investment assets

                                                                                                                             21.3%, Debt securities issued
 8,000                                                                                                8,000

 6,000                                                                                                6,000

                                                  72.5%, Loans and advances to customers

 4,000                                                                                                4,000

                                                                                                                              59.3%, Liabilities to customers

 2,000                                                                                                2,000

    0                                                                                                    0
                                         2018                                                                        2018
           Source: Savings Banks Group

                                                                                                                                                                   19
Loan portfolio with good credit quality
         Loan exposure by collateral type (Dec 2018)                          Non-performing loans have remained low and stable
                  0.7%      0.4%                                             4.0%
                                   2.9%
               1.0%
                                                    Real estate collateral
                                                                             3.0%               Delays 30-89 days

                                                    Other                                       Delays over 90 days
                                                                             2.0%
                                                    Guarantees received
                                                                                                              0.77%
                                                                             1.0%                                                                     0.86%
                                                    Securities                                                0.87%                                   0.57%
                                                                             0.0%
                                                    Uncollateralized                                           2018                                    2017
                                                                                                       Sp Mortgage Bank does not have any non-performing loans
                                   95.3%

         Loan portfolio development                                           Corporate (SME) lending exposures by industry
        9.00
                                                                                                       3.0% 1.6% 1.1%
        8.00                                                                                        3.2%                               Property
                                                                     2.20                    4.9%
        7.00
                                             1.97                                                                                      Construction
                                                                                                                            51.9%
        6.00         1.74                                                             5.7%                                             Trade
        5.00                                                                                                                           Basic industries, fisheries & mining
                                                                                                                                       Industry
EURbn

                                                                                    5.8%
        4.00
                                                                                                                                       Research, consulting & other business service
        3.00                                 5.79                    6.22
                     5.20                                                           6.3%                                               Other services
        2.00
                                                                                                                                       Transport
        1.00                                                                                                                           Hotels & restaurants
                                                                                       7.6%
        0.00                                                                                                                           Financing
                     2016                    2017                    2018
                                                                                                                                       Energy, water & waste disposal
                         Private Customers          SME and agriculture                              8.8%
                                                                                                                                                                         Source: Savings Banks Group

                                                                                                                                                                                                20
Strong capital adequacy and solid capital base
•   At the end of 2018, the Savings Banks Amalgamation had a
    strong capital structure, consisting primarily of CET1 capital–
    CET1 ratio was 17.6% and total capital ratio 18.2%.                            Own funds (EUR million)     31.12.2018 31.12.2017 31.12.2016      31.12.2015

•   Tier 2 capital base amounted to EUR 29.7 million and total         Common Equity Tier 1 (CET1) before
                                                                                                                 986.8       969.7     915.7              849.8
                                                                       adjustments
    capital base was EUR 978.0 million.
                                                                       Regulatory adjustments to CET1            -38.5       -30.6     -27.8              -25.3
•   The capital requirement of Savings Banks Amalgamation was
                                                                       Common Equity Tier 1 (CET 1) capital      948.2       939.1     887.9              824.5
    EUR 593.9 million that equals to 11.0 % of risk-weighted assets.
                                                                       Additional Tier 1 (AT1) capital             0          0          0                   0
    The capital requirement is formed by:
                                                                       Tier 1 capital (T1 = CET1 + AT1)          948.2       939.1     887.9              824.5
     •   8 % minimum capital requirements set by Capital               Tier 2 (T2) capital before regulatory
         Requirement Regulation (CRR),                                                                            29.7       45.5       48.7               44.8
                                                                       adjustments
     •   2.5 % CET1 capital conservation buffer of according to the    Tier 2 capital                             29.7       45.5       48.7               49.7
         Act on Credit Institutions,                                   Total capital (TC = T1 + T2)              978.0       984.6     936.6              874.3

     •   0.5 % CET1 Pillar II requirement of set by the Financial
         Supervisory Authority and
                                                                                         Capital ratios        31.12.2018 31.12.2017 31.12.2016       31.12.2015
     •   The country-specific countercyclical CET1 capital
         requirements of foreign exposures.                            Common Equity Tier 1 ratio, %            17.6 %      18.2 %     18.5 %             17.8 %

• The systemic risk buffer requirement for Savings Banks               Tier 1 ratio, %                          17.6 %      18.2 %     18.5 %             17.8 %
  Amalgamation will be 1 % of risk weighted assets and this            Total capital ratio, %                   18.2 %      19.1 %     19.5 %             18.8 %
  requirement enters into effect on 1 July 2019.
• Capital adequacy will be kept at strong levels also going forward.                                                                            Source: Savings Banks Group

                                                                                                                                                                 21
Capital requirement driven by credit risk
•   The Amalgamation’s credit risk and market risk for
    currency position are calculated using the standard             Capital base (EUR million)         31.12.2018 31.12.2017 31.12.2016      31.12.2015
    model. Operational risk capital requirement is
    calculated with the basic method.                       Total capital base                           978.0      984.6      936.6               874.3

•   Major part of the capital requirement comes from        Capital requirements for credit risk         385.3      368.2      340.0               327.8
    credit risk (89% at 31 December 2018).
                                                            Capital requirement for CVA                   5.8        5.8        7.9                  8.4
•   The Amalgamation has no trading activity for own or
    customers’ account. The member credit institutions
                                                            Capital requirement for market risk           3.1        3.2        2.8                  3.8
    may have a so-called small trading book as defined in
    article 94 of the CRR.                                  Capital requirement for operational risk     36.7       36.1        33.7                31.5
•   Capital requirement for market risk is based on the
                                                            8 % minimum capital requirement              430.8      413.3      384.4               371.5
    currency risk, calculated by combined positions from
    the member banks.                                       Capital buffer
                                                                                                         571.3      571.3      552.2               502.8
                                                            (after 8% minimum capital requirement)

                                                                                                                                          Source: Savings Banks Group

                                                                                                                                                          22
Solid funding and liquidity position

Amalgamation’s funding base, as of 31 December 2018                                     Amalgamation’s expected funding base, by YE 2021*

                     1% 1%                                                                                          1% 2%
            10%
                                                                                                     15%
                                                      Debt to credit institutions                                                                             Debt to credit institutions

   14%                                                Retail deposits                                                                                         Retail deposits

                                                      Wholesale deposits                   12%                                                                Wholesale deposits

  3%                                                  Domestic CDs                                                                                            Domestic CDs
                                                                                            2%
   4%                                                 EMTN / Senior Unsecured               1%                                                                EMTN / Senior Unsecured

                                                      Covered bonds                                                                                           Covered bonds
                                       70%                                                                                                69%
                                                      Subordinated loans                                                                                      Subordinated loans

                                                                                             *The 2021 funding composition is a projection based on medium term planning data of the Group

         • Being compliant with the MREL requirement starting from 31.12.2018 does not require issuing of Non-Preferred instruments. The requirement is
           currently covered by using own funds and senior unsecured debt.
         • In 2019, the Group plans to issue one public covered bond. There will be no public EMTN issuances in 2019, however occasional PPs are possible.
         • As of 31.12.2018, the Amalgamation level LCR was at 158%. The liquidity buffer consisted 77% of ECB receivables and 16% of Government Bonds.
                                                                                                                                                                            Source: Savings Banks Group

                                                                                                                                                                                            23
Sp Mortgage Bank &
Contemplated Transaction
Sp Mortgage Bank in brief

•   Sp Mortgage Bank Plc is the covered bond funding vehicle of Savings Banks Group
•   Licensed by the European Central Bank to issue covered bonds according to the Finnish covered bond
    legislation (Covered Bond Act (688/2010) or CBA)
•   Sp Mortgage Bank’s sole purpose is to raise funding for Savings Banks Group by issuing covered bonds
    with mortgage collateral
•   Sp Mortgage Bank is 100% owned by the Savings Banks in the Group
•   The covered bonds issued are rated AAA by S&P and are ECB eligible
•   In addition to the joint liability, covered bond investors will benefit from the ring-fenced structure of
    the cover pool. Sp Mortgage Bank benefits fully from the joint liability based on the Act on the
    Amalgamation of Deposit Banks

                                                        Sp Mortgage Bank’s covered bond programme complies
                                                        with European Covered Bond Council’s (ECBC) Covered
                                                        Bond Label

                                                        Read more about ECBC Covered Bond Label at www.coveredbondlabel.com

                                                                                                                              25
Sp Mortgage Bank - Operating model and roles

                                           Borrowers

                        21 Savings Banks – Origination of loans, Servicing

Savings Bank’s                                                               Central Bank of
Union Coop                                                                   Savings
Business                                                                     Banks Finland
Development                                                                  Short-term liquidity
Support functions                                                            provider
                                           Sp Mortage Bank                   Support functions
                                           Mortgage lender
Savings Banks                              Covered bond issuer
Services Ltd
Back office servicing

                                                                                 Swap
                                            Investors                        counterparties

                                                                                                    26
Cover pool characteristics as of 31 March 2019

  Pool size                         EUR 1,807.9 million

  Collateral                        100% Finnish prime mortgages

  Geographical distribution         Throughout Finland, a majority in growth centers and their close proximity

  Average loan size                 EUR 87,500

  Number of loans                   21,252

  Average LTV (indexed/unindexed)   58.5% / 57.9%

  Average seasoning                 34.0 months

  Non-performing loans / loans in
                                    0 bp / 14 bps
  arrears

  Interest base                     98.3% variable, 1.7% fixed

  Over-collateralisation            80.8%

Source: Sp Mortgage Bank Plc

                                                                                                                 27
Geographically well diversified cover pool
                                                                                                                       Regional distribution of cover pool and
                                                                                                                             Finland’s 10 largest cities(3)
 The cover pool is well diversified throughout Finland with the
 majority of the pool in close proximity to key growth centers

 Regional distribution of cover pool as of 31 March 2019
                                                                                                                                                             3%
Region                      Major City            Region’s Population(1)   Mortgages, EUR mn(2) Share of the pool(2)

Uusimaa                     Helsinki                     1,671,024                           513                28 %
Varsinais-Suomi             Turku                          478,582                           320                18 %                             OULU       6%
Pirkanmaa                   Tampere                        515,095                           261                14 %
Pohjois-Savo                Kuopio                         245,602                           114                 6%
Pohjois-Pohjanmaa           Oulu                           412,161                           103                 6%
Satakunta                   Pori                           218,624                            95                 5%
                                                                                                                                                                 6%
Kanta-Häme                  Hämeenlinna                    171,364                            86                 5%                                               KUOPIO
                                                                                                                                                    3%
Päijät-Häme                 Lahti                          200,629                            71                 4%                              JYVÄSKYLÄ
Keski-Suomi                 Jyväskylä                      275,521                            53                 3%                    TAMPERE
                                                                                                                                PORI
Lappi                       Rovaniemi                      178,522                            49                 3%
                                                                                                                                5%     14%     4%
Rest of Finland             -                            1,150,795                           143                 8%                       5% LAHTI
                            TOTAL                        5,517,919                                                              TURKU
                                                                                           1,808               100 %                18%
                                                                                                                                         28% VANTAA
 Sources: (1) Statistics Finland: Finnish Regional Population 31.12.2018                                                                         HELSINKI
          (2) Sp Mortgage Bank Plc                                                                                                     ESPOO
          (3) Statistics Finland: City population 31.12.2018

                                                                                                                                                                           28
Breakdown of cover pool as of 31 March 2019
LTV distribution              Loan distribution by size

                              Loan balance, EUR thousand

Loan maturity profile         Loan balance by origination year

                                                                 Source: Sp Mortgage Bank Plc

                                                                                            29
Underwriting criteria

Sp Mortgage Bank’s    • Aligned with the overall credit policy of the Savings Banks Group
credit policy         • Complies with the requirements of the CBA
                      • Customers must be identified and verified, also regarding age and legal capacity
Customer
identification        • Customers’ background and financial position must be determined, including both external (credit bureau)
                        and internal payment defaults
Customer scoring      • A customer is scored every time when applying for a new mortgage
                      • Customers’ income is always verified
Income verification
                      • For current customers income and source of the income can be checked on bank account details in the
                        bank
                      • For new customers income is checked by using pay slips and/or taxation information
                      • A customer must have sufficient repayment abilities for the repayment of the loan
Assessment of the
customer’s
                      • When calculating customers’ available income for interest and loan management costs, exposures to
                        Amalgamation and other parties are taken into account
repayment ability
                      • Stress test with a 6% fixed interest rate level and 25 years maximum repayment period

Follow-up
                      • Existing loan stock is scored on a monthly basis with a scoring model taking into account changes in
                        customers’ payment behaviour

                                                                                                                                   30
Collaterals, loan decision, servicing and collection

Collaterals                                             Loan decision
•   All collaterals are located in Finland              •   Preparation of a loan decision and actual loan
•   Only residential purposes (real estates or shares       decision must always be done by two separate
    in housing companies)                                   persons

•   Only priority ranking pledges                       •   Loan-to-Value ratio is max 70% or with a State
                                                            Guarantee up to 85%
•   Valuation must be independent of the credit
    decision process
      •   Either market valuation that is maximum of
          one year old
             •   Both contract of sale and valuation    Servicing and collection
                 certificate
                                                        The originating Savings Banks are responsible for:
             •   Genuine (not between related
                                                        •   Servicing the Mortgage Loans together with the
                 parties) recent contract of sale
                                                            Back Office company
      •   Or by an external qualified evaluator
                                                        •   Collection / foreclosure processes as any non-
•   Revaluation quarterly based on the housing index        performing Mortgage Loan is transferred back
    data provided by Statistics Finland                     to the originating Savings Bank

                                                                                                             31
Contemplated transaction and indicative terms

                                                         Sp Mortgage Bank
Issuer
                                                           
                                                                                 •   Sp Mortgage Bank is contemplating
Type                                                  Finnish Covered Bond
                                                                                     an issuance of a EUR 500 million
Expected Issue Rating                                             AAA (S&P)          Covered Bond with a 7-year maturity.

Maturity                                                 7 years (soft bullet)   •   The issue will be ECBC Covered Bond
                                                                                     label compliant as well as ECB repo
Size                                             EUR 500 million (no-grow)           and LCR Level 1B eligible.
Coupon                                                                  Fixed
                                                                                 •   BNP Paribas, Deutsche Bank, LBBW
                           The Issuer’s EUR 3bn Covered Bond Programme               and Nordea have been mandated as
Documentation
                                                    dated 27 March 2019              lead managers for the transaction.
Law                                                              English Law

Listing                                                 Irish Stock Exchange

Denominations                                          EUR 100,000 + 1,000

Target market           Eligible counterparties and professional clients only

Lead Managers                  BNP Paribas, Deutsche Bank, LBBW, Nordea

                                                                                                                            32
Macro and housing market
        overview
Finnish economy grows and operates more efficiently
       The economy has seen robust growth in recent years                                                                             Unemployment rate falling and employment at record-high levels
        4                                                                                                                              73                                                                                                                      12
                 %                                                                                                                          %                                                                                                    %
        3                                                                                                                              72                                                                                                                      11

        2                                                                                                                              71                                                                                                                      10

        1                                                                                                                              70                                                                                                                      9

        0                                                                                                                              69                                                                                                                      8

       -1                                                                                                                              68                                                                                                                      7

       -2                                                                                                                              67                                                                                                                      6

       -3                                                                                                                              66                                                                                                                      5

       -4                                                                                                                              65                                                                                                                      4
         Jan-12      Jul-12 Jan-13      Jul-13 Jan-14 Jul-14   Jan-15 Jul-15 Jan-16   Jul-16 Jan-17   Jul-17 Jan-18   Jul-18
                                                               Real GDP growth, YoY
                                                                                                                                                                Employment Rate                               Unemployment Rate (RHS)

       Constant growth in investments since 2015                                                                                      Consumer confidence at high levels whilst households plan to buy houses
       14                                                                                                                      12     30                                                                                                                       10
                %                                                                                          EURbn                            Index
       10                                                                                                                      11.5   25
                                                                                                                                                                                                                                                     %         9
                                                                                                                                                                                                                                                               8
         6                                                                                                                     11     20
                                                                                                                                                                                                                                                               7
         2                                                                                                                     10.5   15                                                                                                                       6
        -2                                                                                                                     10     10                                                                                                                       5
        -6                                                                                                                     9.5     5                                                                                                                       4
                                                                                                                                                                                                                                                               3
      -10                                                                                                                      9       0
                                                                                                                                                                                                                                                               2
      -14                                                                                                                      8.5     -5                                                                                                                      1
      -18                                                                                                                      8      -10                                                                                                                      0

Source: Macrobond, Statistics Finland         Growth in investments, YoY                        Investments (RHS)                               Consumer Confidence          % of households intending to buy a dwelling within a year, 3m moving avg. (RHS)

                                                                                                                                                                                                                                                       34
Price stability in the Finnish housing market
 Nominal house price indices, 2010 = 100                                                                 House price indices deflated by CPI, 2010 = 100
180                                                                                                      160
       Index, 2010 = 100                                                                                       Index, 2010 = 100

160
                                                                                                         140

140
                                                                                                         120

120

                                                                                                         100

100

                                                                                                          80
 80

                                                                                                          60
 60

 40                                                                                                       40
      2000 2001 2002 2003 2004 2005 2006 2007 2008 2009 2010 2011 2012 2013 2014 2015 2016 2017 2018           2000 2001 2002 2003 2004 2005 2006 2007 2008 2009 2010 2011 2012 2013 2014 2015 2016 2017 2018

                 Finland                 Sweden   Norway     Denmark          Germany           France               Finland         Sweden          Norway           Denmark          Germany           France
 Source: Macrobond, Statistics Finland

                                                                                                                                                                                                          35
Affordability of housing and limited household indebtedness
        Housing is becoming more affordable in Finland                                                                   Finnish households are getting more prosperous
        110                                                                                                              350
                                                                                                                                  EURbn
                    Index, 2010 = 100
                                                                                                                         300
        105
                                                                                                                         250

        100                                                                                                              200

                                                                                                                         150
          95

                                                                                                                         100
          90
                                                                                                                          50

          85                                                                                                               0
                 2000 2001 2002 2003 2004 2005 2006 2007 2008 2009 2010 2011 2012 2013 2014 2015 2016 2017 2018                2000 2001 2002 2003 2004 2005 2006 2007 2008 2009 2010 2011 2012 2013 2014 2015 2016 2017 2018
                                         House prices in relation to disposable income, 2010=100                                         Household assets           Household liabilities        Household assets net of liabilities

        Limited indebtedness of Finnish households – household debt as a percentage of net disposable income
        350
                %
        300

        250

        200

        150

        100

          50

           0
                      2000              2001   2002   2003       2004        2005       2006         2007         2008    2009           2010        2011        2012        2013        2014        2015        2016        2017
Source: Macrobond, Statistics Finland                  Finland                                 Sweden                                   Norway                                   Denmark

                                                                                                                                                                                                                                    36
Appendices
Central Bank of Savings Banks Finland rated ‘A- / A-2'
                 S&P Global Ratings Analysis dated August 09, 2018:
                 “The stable outlook on Central Bank of Savings Banks Finland (Sp Central Bank) reflects S&P Global Ratings' view
                 that the wider Savings Bank Group's strategic development as an amalgamation of deposit banks and the benign
                 economic environment in Finland will support the group's business generation and operational efficiency over the
                 next two years. Sp Central Bank is the group's central credit institution. We believe that the group's efforts in terms
                 of common franchise, strategy, and risk management, as well as its more diversified funding profile, will improve its
                 growth prospects and market position.”
A- / A-2
stable outlook   “Sp Central Bank is the central credit institution of Savings Bank Group, and the ratings therefore reflect the wider
                 group's franchise and creditworthiness. We base our ratings on the solid mutual business model and deeply rooted
                 regional franchise. This is accompanied by high and sustainable capital levels. At the same time, we factor into our
                 ratings the group's concentrated activities, by geography and business, which result in limited earnings
                 diversification and higher risks compared to larger peers.”

                 “Although concentrated outside Finland's growth centers, the regional retail franchise of the savings banks enables
                 the group to maintain a stable stream of operating profits. In turn, this supports the group's high capitalization
                 levels, despite sustained loan growth. We view the group's capital as a strength, based on risk-adjusted capital (RAC)
                 ratio forecasts of 18.0%-18.5% in the next 12-24 months. The concentration risks in the group's residential mortgage
                 loan book partially balance our assessment of the group's high capital base. The ratings take into account the sound
                 funding profile, dominated by customer deposits, and its comfortable liquidity position.”

                 “We believe that despite its ambitions to grow the franchise over the coming years, the group will maintain a
                 prudent lending strategy, which we expect will provide stability to its financial position. Although Savings Bank
                 Group still has a fairly short track record of operating as a cohesive banking group, we regard its legal set-up as a
                 mutual group as positive. This set-up will support the group's long-term financial targets, and aligns well with the
                 group's prudent approach to managing risks, in our view.”

                                                                                                                                           38
Act on Mortgage Credit Bank Operations 1/2
•   Act on Mortgage Credit Bank Operations (CBA, statute 688/2010)
•   Segregation of assets in the bond register (issued covered bonds, collateral, relevant derivative contracts)
•   Covered bonds are issued either by specialized mortgage credit bank or any licensed credit institution authorized by FIN-FSA to engage mortgage
    credit bank business
•   Cover pool can consist of mortgage collateral (both residential and commercial) and public sector loans. LTV for residential mortgage assets 70%
    and 60% for commercial mortgages.
•   Matching collateral requirements
       Total value of the cover pool must exceed the outstanding amount of issued covered bonds
       Over-collateralization requirement set as net present value of the cover pool has to exceed that of the covered bonds by 2%.
•   Liquidity requirements
         Average maturity of issued covered bonds must not exceed the average maturity of the mortgage loans in the cover pool
         For any 12 month period the accrued interest of the cover pool assets must exceed the total amount payable for covered bonds and
          derivative transactions
•   Swap counterparties to covered bond programs rank equally with bondholders if the issuer becomes insolvent. This improves the chances of
    attracting third-party counterparties to provide hedging for the programs, even after the issuer defaults.
•   Streamlined set-up if the covered bond issuer becomes insolvent. Effective ring fencing of the assets will allow the dedicated administrator to take
    charge of the cover pool to repay covered bonds when they fall due

                                                                                                                                                           39
Act on Mortgage Credit Bank Operations 2/2
•   Bankruptcy remoteness and preferential claim
     –   Covered bond shall be paid until its maturity in accordance with the terms and conditions of the covered bond
         from the funds accruing on the cover pool assets of the covered bond before other claims
     –   Holders of covered bonds together with counterparties of registered derivatives and bankruptcy liquidity loans in
         bankruptcy would rank pari passu and in respect of each Mortgage Loan included in the cover pool for a covered
         bond, the priority of payment right in accordance with Section 25 of the CBA is limited to a maximum amount
         which corresponds to 70% in respect of Housing Loans and to 60% in respect of Commercial Property Loans of
         the current value of shares or real estate which stand as collateral

•   Post-bankruptcy procedures
     –   When the issuer has entered into liquidation or bankruptcy proceedings, the FIN-FSA shall, without delay,
         appoint a supervisor in accordance with Section 29 of the Finnish Act on the Financial Supervisory Authority to
         protect the interests of creditors of covered bonds and creditor entities comparable to such and to enforce their
         right to be heard
     –   In bankruptcy proceedings the courts will by operation of law appoint a bankruptcy administrator to administer
         the bankruptcy estate. The cover pool will be run by the bankruptcy administrator, but the supervisor will
         supervise the bankruptcy administrator, acting in the interest of the holders of the covered bonds.
     –   To the extent that claims of the Covered Bondholders in respect of the Covered Bonds are not met out of the
         Cover Pool, the residual claims of the Covered Bondholders will rank pari passu with the unsecured and
         unsubordinated obligations of the Issuer.

                                                                                                                             40
Investors’ position is stronger in the Amalgamation

Joint liability
•   The Amalgamation improves investors’ position because the liability for repayment of debt does not lie with an individual entity but within
    the central institution and the member credit institutions in accordance with the Amalgamations Act.
•   The Amalgamation is based on the principle that it is a stable and permanent structure. In practise, it acts like one operator without being a
    conglomerate.
•   Under the Amalgamations Act, the central institution and the member credit institutions are jointly liable for each others’ debts and
    commitments:
     –   The central institution is liable to pay, as a support measure, to any of its member credit institutions an amount that is necessary to
         prevent that member credit institution from being placed in liquidation.
     –   Each member credit institution shall be liable to pay to the central institution, in proportion to their last adopted balance sheets, the
         amount paid by the central institution.
     –   Furthermore, upon insolvency of the central institution, a member credit institution shall have unlimited refinancing liability for the central
         institution's debts.
•   In the Amalgamation of Savings Banks the joint liability currently comprises 21 Savings Banks, CBSBF, Sp Mortgage Bank and the Union Coop
    (the central institution).

                                                                                                                                                     41
The Amalgamation of Savings Banks

•   The Amalgamation of Savings Banks is an amalgamation defined in the Act on the Amalgamation of Deposit Banks (“Amalgamations Act”, Laki
    talletuspankkien yhteenliittymästä 599/2010).

•   Under the Amalgamation Act, the Union Coop as the central institution has the obligation to supervise the operations of the member credit
    institutions and issue instructions to them on risk management, good corporate governance and internal control to secure liquidity and
    capital adequacy, as well as instructions on compliance with uniform accounting policies in the preparation of the amalgamation's
    consolidated financial statements.

•   The Union Coop may confirm general operating policies for the member credit institutions to be followed in their operations that are significant
    for the Amalgamation.

•   The minimum capital requirement and liquidity of the companies within the Amalgamation of Savings Banks is controlled on a consolidated
    basis.

                                                                                                                                                  42
Early Intervention model
Prevents a bank from going in a wrong direction at an early stage

                                        •   The Union Coop oversees the Group’s
 The Act on the Amalgamation of             liabilities and reports to the regulator,
         Deposit Banks                      Finnish FSA.

                                        •   For decision making and prevention of any
    The bylaws of the Savings               savings bank in the Group from going to a
       Banks’ Union Coop                    wrong direction, there is an additional
                                            internal framework and an early intervention
                                            model which have been agreed and adopted
     The internal operational               within the Group.
            principles
      (No legal requirement for these   •   CBSBF and Sp Mortgage Bank fully benefit
                 principles)                from the joint liability based on the Act on
                                            the Amalgamation of Deposit Banks. In
     The Early Intervention                 addition, covered bond investors benefit
                                            from the ring-fencing of the assets in its
            model                           Cover Pool.

                                                                                           43
Disclaimer

        This presentation has been prepared solely for use at this presentation. By attending the meeting where this presentation is made, or by reading the presentation slides, you agree
        to be bound by the following limitations.

        This presentation does not constitute or form part of and should not be construed as, an offer to sell or issue or the solicitation of an offer to buy or acquire securities of Sp
        Mortgage Bank Plc (the “Company”), in any jurisdiction or an inducement to enter into investment activity. No part of this presentation, nor the fact of its distribution, should
        form the basis of, or be relied on in connection with, any contract or commitment or investment decision whatsoever. If any such offer or invitation is made, it will be done so
        pursuant to separate and distinct documentation in the form of a prospectus, offering circular or other equivalent document (a "prospectus") and any decision to purchase or
        subscribe for any securities pursuant to such offer or invitation should be made solely on the basis of such prospectus and not these materials.

        This presentation has been prepared solely for use in connection with the presentation of the Company. The information contained in this document is strictly confidential and is
        being provided to you solely for your information and cannot be distributed to any other person or published, in whole or in part, for any purpose. It may not be reproduced,
        redistributed, passed on or published, in whole or in part, to any other person for any purpose. Failure to comply with this and the following restrictions may constitute a violation
        of applicable securities laws. No representation, warranty or undertaking, express or implied, is made as to, and no reliance should be placed on, the fairness, accuracy,
        completeness or correctness of the information or the opinions contained herein. None of the Company or any of their respective affiliates, advisors or representatives shall have
        any liability whatsoever (in negligence or otherwise) for any loss howsoever arising from any use of this presentation or its contents or otherwise arising in connection with the
        presentation.

        These materials are not intended for distribution to, or use by any person or entity in any jurisdiction or country where such distribution or use would be contrary to local law or
        regulation. In particular, these materials (a) are not intended for distribution and may not be distributed in the United States or to U.S. persons (as defined in Regulation S) under
        the United States Securities Act of 1933, as amended and (b) are for distribution in the United Kingdom only to (i) investment professionals falling within Article 19(5) of the
        Financial Services and Markets Act 2000 (Financial Promotion) Order 2005 (the “Order”) or (ii) persons falling within Article 49(2)(a) to (d) (“high net worth companies,
        unincorporated associations etc”) of the Order.”

        Investors may get back less than they invested. The Company gives no assurance that any favourable scenarios described are likely to happen, that it is possible to trade on the
        terms described herein or that any potential returns illustrated can be achieved.

        This document offers no investment, financial, legal, tax or any other type of advice to, and the Company has no fiduciary duties towards, any recipients and therefore any such
        determination should involve, inter alia, an assessment of the legal, tax, accounting, regulatory, financial, credit and other related aspects of the securities or such transaction.
        The Company makes no representation nor gives any warranty as to the results to be obtained from any investment, strategy or transaction, nor as to whether any strategy,
        security or transaction discussed herein may be suitable for recipients’ financial needs, circumstances or requirements. Recipients must make their own assessment of such
        strategies, securities and/or potential transactions detailed herein, using such professional advisors as they may require. No liability is accepted for any direct or consequential
        losses arising from any action taken in connection with or reliance on the information contained in this document even where advised of the possibility of such losses.

                                                                                                                                                                                                 44
Contact details

Kai Brander
Treasurer
E-mail : kai.brander@saastopankki.fi
Tel. +358 50 384 8220

 Teollisuuskatu 33
 00510 Helsinki
 Finland

 Read more at www.saastopankki.fi/debtinvestors

                                                  45
Thank you!
 www.saastopankki.fi
You can also read