Spatial and temporal distribution of cancer mortality in a Brazilian Legal Amazon State between 2000 and 2015
←
→
Page content transcription
If your browser does not render page correctly, please read the page content below
https://doi.org/10.1590/1980-549720210009.supl.1

 ORIGINAL ARTICLE / ARTIGO ORIGINAL

Spatial and temporal distribution of cancer
mortality in a Brazilian Legal Amazon State
between 2000 and 2015
Distribuição espacial e temporal da mortalidade por câncer em um estado
da Amazônia Legal Brasileira entre 2000 e 2015
Mario Ribeiro AlvesI , Noemi Dreyer GalvãoI , Rita Adriana Gomes de SouzaI                                      ,
Amanda Cristina de Souza AndradeI , Jânia Cristiane de Souza OliveiraI ,
Bárbara da Silva Nalin de SouzaI , Elicléia Filgueira Santiago de AzevedoI

    ABSTRACT: Objective: To analyze the spatial distribution of the four-year cancer mortality rates in the state
    of Mato Grosso, Brazil, from 2000 to 2015. Methodology: Ecological design study, in which mortality from
    neoplasia was analyzed, from 2000 to 2015, for the municipalities of Mato Grosso State. Mortality rates due
    to cancer were calculated by the ratio of the sum of deaths by cancer in each quadrennium, divided by the
    average of the population in the two central years of the period, multiplied by 10,000 inhabitants. Annual
    percentage change was calculated by the ratio of the linear regression coefficient to the cancer mortality rates
    in Mato Grosso State at the beginning of the analyzed period (2000 to 2003). Thematic maps were constructed
    for each quadrennium using intervals of equal classes. Results: Cancer caused 31,097 deaths in the state of
    Mato Grosso in the period, 13,058 in women and 18,039 in men, with a male to female ratio of 1.38. The top
    five causes of cancer death in the period were lung (12.2%), prostate (8.7%), stomach (7.7%), breast (6.0%),
    and liver (4.7%). There was an increase in the number of municipalities with rates greater than 23.67 deaths
    per 100,000 inhabitants in the period. Conclusion: There was an increase in cancer mortality and an increase
    in the proportion of municipalities with higher mortality rates. Higher density of cancer mortality occurred
    in the municipalities located in the West, Center-South, Southeast, and Center-North regions of the state.
    Keywords: Neoplasms. Information systems. Mortality. Spatial analysis. Temporal distribution.

I
 Collective Health Institute, Universidade Federal de Mato Grosso – Cuiabá (MT), Brazil.
Corresponding author: Mario Ribeiro Alves. Avenida Fernando Corrêa da Costa, 2367, Boa Esperança, CEP: 78060-900, Cuiabá,
MT, Brazil. E-mail: malvesgeo@gmail.com
Conflict of interests: nothing to declare – Financial support: State Health Department of Mato Grosso and Public Ministry of
Labor (Twenty-third Region).

                                                           1
                                      REV BRAS EPIDEMIOL 2021; 24: E210009.SUPL.1
ALVES, M.R. ET AL.

RESUMO: Objetivo: Analisar a distribuição espacial das taxas quadrimestrais de mortalidade por câncer no estado
de Mato Grosso, Brasil, no período de 2000 a 2015. Métodos: Estudo de desenho ecológico, no qual foi analisada a
mortalidade por neoplasia, de 2000 a 2015, para os municípios do estado de Mato Grosso. As taxas de mortalidade
por câncer foram calculadas pela razão da soma das mortes por câncer em cada quadrênio, dividida pela média da
população nos dois anos centrais do período, multiplicada por 10.000 habitantes. Uma variação percentual anual foi
calculada pela razão do coeficiente de regressão linear para as taxas de mortalidade por câncer no estado de Mato
Grosso no início do período analisado (2000 a 2003). Mapas temáticos foram construídos para cada quadriênio
usando intervalos de classes iguais. Resultados: O câncer causou 31.097 óbitos no estado de Mato Grosso no
período, 13.058 em mulheres e 18.039 em homens, com uma proporção de homens e mulheres de 1,38. As cinco
principais causas de morte por câncer no período foram pulmão (12,2%), próstata (8,7%), estômago (7,7%), mama
(6,0%) e fígado (4,7%). Houve um aumento no número de municípios com taxas superiores a 23,67 óbitos por
100.000 habitantes no período. Conclusão: Houve aumento da mortalidade por câncer e aumento na proporção
de municípios com maiores taxas de mortalidade. Maiores densidades de mortalidade por câncer ocorreram nos
municípios localizados nas regiões Oeste, Centro-Sul, Sudeste e Centro-Norte do estado.
Palavras-chave: Neoplasias. Sistemas de informação. Mortalidade. Análise espacial. Distribuição temporal.

INTRODUCTION
    Chronic noncommunicable diseases are responsible for most deaths worldwide. It is
estimated that cancer is at the top of the basic causes of death and is the most important
barrier to increasing life expectancy in the world1.
    In 2016, about 41 million deaths were due to chronic noncommunicable diseases and,
of these, 9 million (22%) had cancer as a basic cause1. Worldwide, projections for the year
2030 indicate the occurrence of 26 million new cases and 17 million deaths from the disease2.
These numbers express the importance of cancer as a leading cause of death worldwide3.
    In Brazil, between 1996 and 2010, there were 2,023,038 deaths from cancer, with 53.9%
affecting men and 46.1% women4. In 2017, the five primary locations with the highest death
rates in the male population in the country were: bronchi and lung with 15.60 per 100,000
inhabitants, followed by prostate with 14.24 per 100,000, thirdly the stomach with 8.82 per
100,000, in fourth position, the esophagus with 6.41 per 100.000, and in fifth place, liver and
biliary tract with 5.71 per 100.000 inhabitants. In the female population, for the same year,
the primary location that showed the highest rate was the breast with 13.22 per 100,000
inhabitants, secondly that of the bronchi and lung with 9.20 per 100,000, followed by cervi-
cal cancer with 5.14 per 100,000, colon in the fourth place with 4.62 per 100,000 and in the
fifth place, pancreas cancer with 4.06 per 100,000 inhabitants5.
    The estimate of new cases of cancer in Brazil for the period from 2020 to 2022 is 625
thousand and for the state of Mato Grosso, there were crude rates of 252.04 per 100,000
inhabitants for men and 217.31 per 100,000 for women6.
    Spatial analysis of data allows the analysis of cases according to the distribution in a speci-
fic geographical area. However, it is worth mentioning that the spaces are not homogeneous,
                                                            2
                                       REV BRAS EPIDEMIOL 2021; 24: E210009.SUPL.1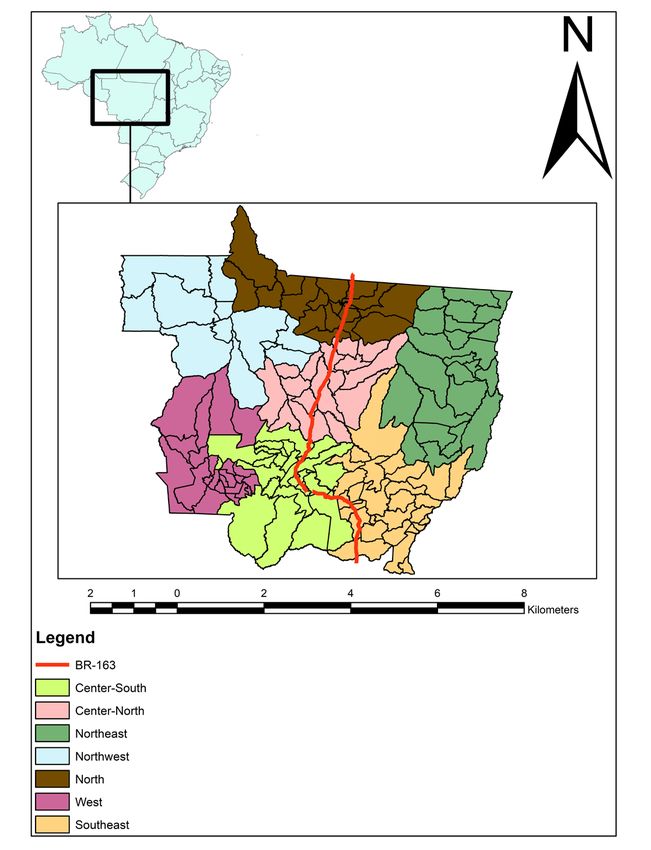
Spatial and temporal distribution of cancer mortality in a Brazilian Legal Amazon State between 2000 and 2015

since spatial differentiation implies several other singularities, such as culture, education,
income, genetic, and housing characteristics7.
    Thus, the relevance of this study is unique, since the environment has characteristics
that can act as risk factors for the occurrence of cancer. In addition, scientific production
on the theme of cancer, using geoprocessing as an analysis tool, is still little explored, which
further highlights the importance of this study, aiming to analyze the spatial distribution
of the four-year rates of mortality from neoplasia, in the period from 2000 to 2015 in the
state of Mato Grosso, Brazil.

METHODS
    Ecological design study, in which mortality from neoplasia (by municipality of residence)
was analyzed, from 2000 to 2015, for the state of Mato Grosso.
    The Brazilian Legal Amazon corresponds to the area of operation of the Superintendence
of Development of the Amazon (SUDAM), being formed by the states of Rondônia, Acre,
Amazonas, Roraima, Pará, Amapá, Tocantins, Mato Grosso, and the western part of
Maranhão. It has an area of approximately 5,015,067.749 km2, corresponding to approxi-
mately 58.9% of the Brazilian territory8.
    Data on the estimated population of the state were acquired from the Brazilian Institute
of Geography and Statistics (IBGE )8 for the year 2018 (3,441,998 inhabitants, with a popula-
tion density of 3.36 inhabitants per km2 and a territorial area of 903,206,997 km2). The state
of Mato Grosso is divided into 7 geographic regions and 141 municipalities (Figure 1).
    Mortality data were obtained from the databases of the Mortality Information System
(Sistema de Informações sobre Mortalidade – SIM)9 provided by the Mato Grosso State Department
of Health. Cancer deaths were analyzed under codes C00 to C97, according to the 10th ICD-
10 (International Classification of Diseases). These deaths refer to individuals of all ages.
Population estimates by age group were collected from the website of the Department of
Informatics of the Unified Health System, of the Brazilian public health system10.
    Mortality rates due to cancer were calculated by the ratio of the sum of deaths by cancer
in each quadrennium, divided by the average of the population in the two central years of
the period, multiplied by 10,000 inhabitants. The rates were adjusted by the direct method
by age groups, with intervals of four years, considering as a standard population the distri-
bution of the world population11. In order to reduce instability in the analysis of mortality
data by municipality, we sought to smooth out random fluctuations by grouping rates in
four-year periods: 2000 to 2003; 2004 to 2007; 2008 to 2011; and 2012 to 2015.
    An annual percentage change was calculated by the ratio of the linear regression coef-
ficient to the cancer mortality rates in Mato Grosso State at the beginning of the analyzed
period (2000 to 2003). Significance level of 5%.
    To explore the spatial distribution of cancer mortality rates, thematic maps were cons-
tructed for each quadrennium using intervals of equal classes (0.00; between 0.01 and
12.52; between 12.53 and 23.67; between 23.68 and 36.21; between 36.22 and 48.00; above
                                                            3
                                       REV BRAS EPIDEMIOL 2021; 24: E210009.SUPL.1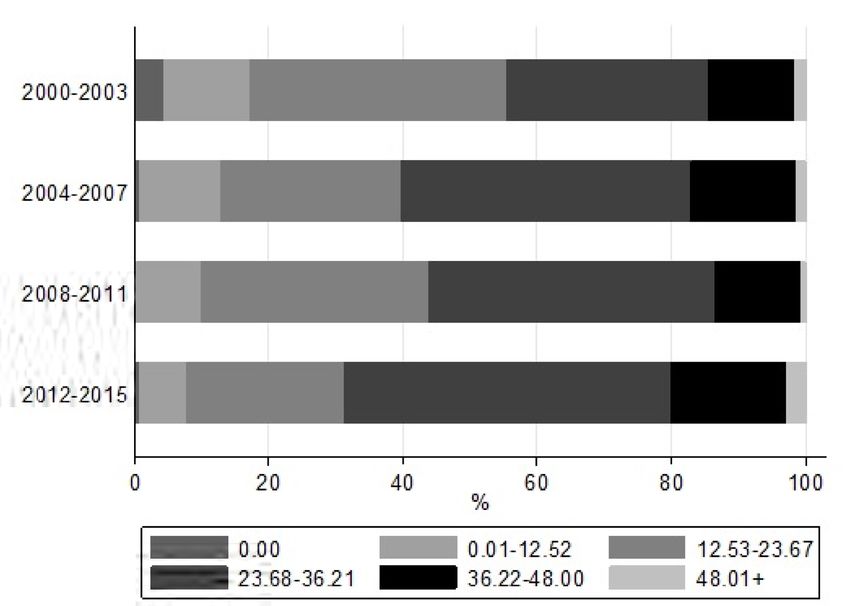
ALVES, M.R. ET AL.

48.00). The intervals were defined based on the distribution of rates in the first quadren-
nium (2000–2003). The geographical unit of analysis were the 141 municipalities of Mato
Grosso. The municipalities of Itanhangá and Ipiranga do Norte were created in 2005, which
made it impossible to calculate the mortality rate for the quadrennium from 2000 to 2003
and were declared as missing. The cartographic bases were obtained from IBGE12. Kernel
maps were built with an adaptive radius. Nine strata were used, divided into equal intervals.
   For data analysis, the software STATA version 12.0 and the ArcMap Program version
10.3 were used. The study was approved by the Ethics and Research Committee of Hospital
Universitário Júlio Muller.

RESULTS
   In the period from 2000 to 2015, cancer caused 31,097 deaths in Mato Grosso State,
13,058 in women and 18,039 in men, with a male to female ratio of 1.38. The top five causes

Figure 1. Location and regional division of Mato Grosso State, Brazil.

                                                     4
                                REV BRAS EPIDEMIOL 2021; 24: E210009.SUPL.1
Spatial and temporal distribution of cancer mortality in a Brazilian Legal Amazon State between 2000 and 2015
of cancer death in the period were lung (12.2%), prostate (8.7%), stomach (7.7%), breast
(6.0%), and liver (4.7%). The mortality rates in the state in the quadrenniums from 2000
to 2003, 2004 to 2007, 2008 to 2011, and 2012 to 2015 were 30.0, 32.4, 32.8, and 33.2 per
100,000 inhabitants, respectively, indicating an average annual increase of 8.3% (p = 0.030)
(data not shown).
Figure 2 shows the proportion of municipalities according to the intervals of equal classes
defined in the maps. There is an increase in the proportion of municipalities with mortality
rates between 23.68 to 36.21, between 36.22 to 48.00, and above 48.00. For the remaining
intervals (0.00; between 0.01 and 12.52; between 12.53 to 23.67), there was a downward trend.
Figure 3 shows the four-year trends in cancer mortality rates according to municipality.
There is an increase in the number of municipalities with rates greater than 23.67 deaths per
100,000 inhabitants in the period. The regions with the highest rate in the quadrenniums
were West, Center-South, Southeast, Center-North, and North, while the Northeast and
Northwest regions had the lowest rates.
The kernel intensity map (Figure 4) confirms that the highest density of cancer morta-
lity occurred in the West, Center-South, Southeast, and Center-North regions of the state
and the lowest in the Northeast and Northwest regions. This pattern tends to be maintained
throughout the quadrenniums. For the North and Northwest regions there is a decrease in
mortality densities over the four-year period. The Northeast region had the lowest densi-
ties in the entire period studied.
Figure 2. Proportions of cancer mortality rates in the municipalities of Mato Grosso State (2000–2015).
5
REV BRAS EPIDEMIOL 2021; 24: E210009.SUPL.1ALVES, M.R. ET AL.
Figure 3. Cancer mortality rates in the municipalities of Mato Grosso State (2000–2015).
6
REV BRAS EPIDEMIOL 2021; 24: E210009.SUPL.1Spatial and temporal distribution of cancer mortality in a Brazilian Legal Amazon State between 2000 and 2015
Figure 4. Kernel intensity of cancer mortality densities (2000 to 2015).
7
REV BRAS EPIDEMIOL 2021; 24: E210009.SUPL.1ALVES, M.R. ET AL.
DISCUSSION
There was an average annual increase of 8.3% in cancer mortality rates and an increase
in the proportion of municipalities with higher mortality rates. The municipalities loca-
ted in the West, Center-South, Southeast, and Center-North regions of the state presented
higher density of cancer mortality.
The results of this study identified space and time patterns that point to an increase in
standardized rates of cancer mortality in the state of Mato Grosso from 2000 to 2015.
According to IBGE data on the age distribution of the population, at least 80% of the
state’s population is concentrated below 50 years of age. However, according to the Mato
Grosso Oncology Care Action Plan, even though the state has a predominantly younger
population, cancer has appeared as the second cause of death in mortality statistics (exclu-
ding external causes). In addition, there was also an increase in proportional cancer morta-
lity, from 10.8% in 2001 to 14.3% in 201313.
The pattern shown in the state was different from the national pattern, where general
rates for the disease have been showing some stability4. A study that described the main
groups of causes of death from chronic non-communicable diseases between 1990 and 2015
according to estimates from the Global Burden of Disease (GBD) 2015 study, showed that, for
Brazil, the standardized mortality rates for cancer went from 142.7 per 100,000 inhabitants
(1990) to 133.5 per 100,000 inhabitants (2015), considered stable for the analyzed period14.
The five main causes of death from cancer in the period for the state, considering the
anatomical location, were lung, prostate, stomach, breast, and liver. With the exception of
liver cancer, which appears only in Mato Grosso, the others are also among the five main
types of cancer that kill the most in Brazil, although not in the same order15.
Estimates from Global Cancer Observatory show that, worldwide, lung cancer remains
the leading cause of cancer mortality, with 1.8 million deaths predicted in 2018, represen-
ting about 1 out of 5 cancer deaths. Prostate cancer is considered the fifth leading cause of
cancer death in men, and breast cancer the first in women, accounting for about 1 out of 4
cancer cases in this group. Stomach cancer remains an important cancer worldwide, accou-
nting for about 783,000 deaths, equivalent to 1 out of 12 deaths from cancer, while liver can-
cer is considered the fourth leading cause of cancer death worldwide3.
The profile of deaths presented in the state has been associated with more urbanized,
industrialized regions with an aging population, in line with developed countries in the West.
On the other hand, the state continues to live with deaths due to types of cancer associa-
ted with infections, such as stomach cancer, which have a high potential for prevention and
tend to be more prevalent in countries of low and medium development16.
Cancer is a multifactorial disease, however, according to the World Health Organization
(WHO), some risk factors are related to most deaths from chronic noncommunicable disea-
ses, including cancer, having an important contribution to the burden of diseases. Among
these factors, smoking, excessive alcohol consumption, inadequate diet, and physical inac-
tivity stand out17.
8
REV BRAS EPIDEMIOL 2021; 24: E210009.SUPL.1Spatial and temporal distribution of cancer mortality in a Brazilian Legal Amazon State between 2000 and 2015
Data from the Mato Grosso National Health Survey18 showed that only 37.0% of the
state’s population aged 18 years old or older reported complying with the recommended
consumption of fruits and vegetables, while 52.9% were classified as insufficiently active
(behind Rondônia State only), 24.3% reported weekly alcohol consumption and 12.8% as
current users of tobacco products.
There was also a higher proportion of deaths among men. This can be explained by the
fact that the three main types of cancer were more present in this group. A study that aimed
to analyze the temporal trend of cancer mortality in Brazil in the period from 1996 to 2010,
in addition to calculating the projection of mortality for the period from 2011 to 2030, sho-
wed that 53.9% of deaths affected men and 46.1%, women. In addition, there was stability
in female mortality and a significant increase in the trend for males between 1996 and 20084.
Literature data have pointed out that men and women have different life expectancies
and habits, with greater female demand for health services and, consequently, with women
adopting greater preventive health care than men19.
Spatial analysis of cancer mortality, through the use of maps, is an important tool to
evaluate health risks, especially when this type of analysis considers environmental aspects,
as the visualization of information allows a better understanding of how relationships occur,
contributing to the identification of priority territories, as well as a better understanding of
the health-disease process and health planning actions20.
The use of geoprocessing also allows for a historical analysis of the demand for care in
health services, helping to optimize care in health units and producing important changes
in epidemiological and operational indicators21.
This analysis allowed to identify that the regions of the state with the highest mortality
rates were the West, Center-South, Southeast, Center-North, and North regions. These
regions showed differences that can be expressed through socioeconomic indicators of
the municipalities that integrate them, as well as an inequality in installed capacity and in
public and private investments, especially in those with less economic dynamism22. Despite
this diversity, what can be observed is that, in general, these regions have less availability
of primary care services, and some also have low health care expenditures (West Region),
low availability of specialized assistance establishments (West and North Regions), and low
outpatient care per inhabitant in medium and high complexity (West, North and Center-
North Regions)23,24.
Specifically with regard to primary health care services, they serve as a gateway to the
health care network. The low availability of these services may impair the identification,
in the initial phase, of the first lesions suggestive of cancer and, consequently, determine
the specialized services as the predominant places for the diagnosis of the disease, since the
confirmation of the lesions requires procedures and supplies available only in medium and
high complexity services25.
Another characteristic of the state is that, with the exception of some municipalities in
the Center-South region, agriculture and services are the economic basis of practically all
regions therein23.
9
REV BRAS EPIDEMIOL 2021; 24: E210009.SUPL.1ALVES, M.R. ET AL.
Currently, Mato Grosso is the state that produces the most soy, corn, cotton, and cattle
in Brazil, having become, for several years, a strategic territory for the expansion of agri-
business26, whose model consists predominantly of large monoculture properties, inten-
sive use of chemical and pesticide fertilizers to control unwanted species and use of bio-
technology (transgenics)27. This issue was evidenced by the higher cancer mortality rates
in cities close to BR-163 (a federal highway) (Figure 3), which can probably be explained
by the relationship between soy production (with transgenics and use of pesticides, which
have highly carcinogenic potentials) and the presence of the highway to transport produc-
tion to other countries28.
The state has some municipalities that concentrate a large part of the national agricul-
tural production, such as some municipalities located in the central and southeast regions.
Consequently, due to the chemical-dependent production method, these municipalities have
high rates of pesticide consumption29.
The relationship between exposure to pesticides and cancer development has been esta-
blished in several studies30-33, being modulated by type of product used, time of exposure,
and amount absorbed by the body34. It is important to highlight that the entire population
is susceptible to multiple exposures to pesticides, through the consumption of contamina-
ted water and food, and not only farmers and workers in the pesticide production chain35.
A possible limitation of the study concerns the incorrect or incomplete filling of infor-
mation in death certificates in relation to the causes. There was no correction of rates for
deaths due to ill-defined causes. However, deaths from these causes have decreased in recent
decades in all Brazilian regions, especially in cities outside the capitals36,37. This has indica-
ted an improvement in the quality of the information recorded in the SIM, especially for
the group of malignant neoplasms, where the quality of information about the basic cause
registered in the system can be considered better than that of other groups of causes38.
In 2015, the United Nations (UN) adopted a set of 17 goals as part of a sustainable
development agenda. One of the goals is related to the reduction of premature morta-
lity due to noncommunicable diseases through prevention and treatment. It has therefore
become a global priority to monitor trends in mortality from these diseases, provided
by quality information systems, in order to verify whether national and global commit-
ments are being achieved39.
Thus, the description of cancer mortality can bring important contributions to epi-
demiological studies based on the person-space-time triad. Studies of this magnitude are
necessary, especially in Mato Grosso, since studies on this topic are scarce, and knowing this
reality can potentially contribute to the identification of priority regions for intervention
aiming to reduce mortality rates.
ACKNOWLEDGMENTS
To the Institute of Collective Health of Universidade Federal de Mato Grosso, for the oppor-
tunity to work and learn.
10
REV BRAS EPIDEMIOL 2021; 24: E210009.SUPL.1Spatial and temporal distribution of cancer mortality in a Brazilian Legal Amazon State between 2000 and 2015
REFERENCES
1. World Health Organization. Global Health Observatory 13. Mato Grosso. Governo de Mato Grosso. Secretaria de
[Internet]. Geneva: World Health Organization; 2018 Estado de Saúde (SES-MT). Plano de Ação da Atenção
[accessed on Jul. 10, 2018]. Available at: who.int/gho/ Oncológica no Estado de Mato Grosso 2017 a 2019
database/en/ [Internet]. Cuiabá: SES-MT; 2017 [accessed on Jul. 10,
2. Thun MJ, DeLancey JO, Center MM, Jemal A, Ward 2018]. Available at: www.saude.mt.gov.br/arquivo/7317
EM. The global burden of cancer: priorities for 14. Malta DC, França E, Abreu DMX, Perillo RD,
prevention. Carcinogenesis 2010; 31(1): 100-10. https:// Salmen MC, Teixeira RA, et al. Mortality due to
doi.org/10.1093/carcin/bgp263 noncommunicable diseases in Brazil, 1990 to 2015,
3. Bray F, Ferlay J, Soerjomataram I, Siegel RL, Torre LA, according to estimates from the Global Burden of
Jemal A. Global cancer statistics 2018: GLOBOCAN Disease study. Sao Paulo Med J 2017; 135(3): 213-21.
estimates of incidence and mortality worldwide for https://doi.org/10.1590/1516-3180.2016.0330050117
36 cancers in 185 countries. CA Cancer J Clin 2018; 15. Brasil. Ministério da Saúde. Instituto Nacional de Câncer.
68(6): 394-424. https://doi.org/10.3322/caac.21492 Coordenação de Prevenção e Vigilância. Divisão de
4. Barbosa IR, Souza DLB, Bernal MM, Costa ICC. Cancer Vigilância e Análise de Situação. Sistema de Informação
mortality in Brazil: Temporal Trends and Predictions sobre Mortalidade [Internet]. Brasil: Ministério da
for the Year 2030. Medicine (Baltimore) 2015; 94(16): Saúde; 2019 [accessed on Jul. 20, 2019]. Available at:
e746. https://doi.org/10.1097/md.0000000000000746 https://www.inca.gov.br/numeros-de-cancer
5. Instituto Nacional de Câncer José Alencar Gomes da 16. Balakrishnan M, George R, Sharma A, Graham DY.
Silva. Atlas da Mortalidade [Internet]. Brazil: Instituto Changing trends in stomach cancer throughout the
Nacional de Câncer José Alencar Gomes da Silva; 1996- world. Curr Gastroenterol Rep 2017; 19: 36. https://
2014 [accessed on Feb. 15, 2020]. Available at: http:// doi.org/10.1007/s11894-017-0575-8
mortalidade.inca.gov.br/Mortalidade/ 17. World Health Organization (WHO). Global status
6. Instituto Nacional de Câncer José Alencar Gomes da report on noncommunicable diseases 2010. Geneva:
Silva. Estimativa 2020: incidência de câncer no Brasil. WHO; 2011.
Rio de Janeiro: INCA; 2019. 120 p. 18. Brasil. Ministério da Saúde. Pesquisa Nacional de Saúde
7. Barcellos C, Bastos FI. Geoprocessamento, ambiente 2013. Percepção do estado de saúde, estilos de vida e
e saúde: uma união possível? Cad Saúde Pública doenças crônicas. Brasil, Grandes Regiões e Unidades
1996; 12(3): 389-97. https://doi.org/10.1590/ da Federação. Rio de Janeiro: Ministério da Saúde; 2014.
S0102-311X1996000300012 19. Vieira KLD, Gomes VLO, Borba MR, Costa CFS.
8. Instituto Brasileiro de Geografia e Estatística. Portal Atendimento da população masculina em unidade
[Internet]. Brazil: Instituto Brasileiro de Geografia básica saúde da família: motivos para a (não) procura.
e Estatística [accessed on Jul. 10, 2018]. Available at: Esc Anna Nery 2013; 17(1): 120-7. https://doi.
http://www.ibge.gov.br org/10.1590/S1414-81452013000100017
9. Brasil. Ministério da Saúde. Sistema de Informação 20. Carvalho MS, Souza-Santos R. Análise de dados espaciais
sobre Mortalidade (SIM) [Internet]. Brazil: Ministério em saúde pública: métodos, problemas, perspectivas.
da Saúde [accessed on Jul. 10, 2018]. Available at: Cad Saúde Pública 2005; 21(2): 361-78. https://doi.
http://www2.datasus.gov.br/ org/10.1590/S0102-311X2005000200003
10. Brasil. Ministério da Saúde. Estimativas populacionais. 21. Nardi SMT, Paschoal JAA, Pedro HSP, Paschoal VD, Sichieri
Brazil: Ministério da Saúde [accessed on Jul. 10, EP. Geoprocessamento em Saúde Pública: fundamentos
2018]. Available at: http://datasus.saude.gov.br/ e aplicações. Rev Inst Adolfo Lutz 2013; 72(3): 185-91.
populacao-residente https://doi.org/10.18241/0073-98552013721562
11. Doll R. Comparison between registries and age- 22. Mato Grosso. Secretaria de Estado de Saúde do Estado
standardized rates. In: Waterhouse JA, Muir CS, de Mato Grosso (SES-MT). Escola de Saúde Pública do
Correa P, Powell J, editors. Cancer incidence in five Estado de Mato Grosso. Plano Estadual de Educação
continents. Lyon: IARC; 1976. v. 3. p. 453-9. Permanente do Mato Grosso. Cuiabá: SES-MT; 2019.
12. Instituto Brasileiro de Geografia e Estatística. Encontre 23. Scatena JHG, Oliveira LR, Galvão ND, das Neves MAB.
mapas [Internet]. Brazil: Instituto Brasileiro de Geografia Caracterização das regiões de saúde de Mato Grosso. In:
e Estatística [accessed on Jul. 10, 2018]. Available Scatena JHG, Kehrig RT, Spinelli MAS, editors. Regiões
at: https://mapas.ibge.gov.br/bases-e-referencial/ de Saúde: diversidade e processo de regionalização em
bases-cartograficas/malhas-digitais Mato Grosso. São Paulo: Hucitec; 2014.
11
REV BRAS EPIDEMIOL 2021; 24: E210009.SUPL.1ALVES, M.R. ET AL.
24. Scatena JHG, Oliveira LR, Galvão ND, das Neves MAB. 33. Parada H Jr., Wolff MS, Engel LS, White AJ, Eng SM,
O uso de indicadores compostos para classificação das Cleveland RJ, et al. Organochlorine insecticides DDT
regiões de saúde de Mato Grosso. In: Scatena JHG, and chlordane in relation to survival following breast
Kehrig RT, Spinelli MAS, editors. Regiões de Saúde: cancer. Int J Cancer 2016; 138(3): 565-75. https://doi.
diversidade e processo de regionalização em Mato org/10.1002/ijc.29806
Grosso. São Paulo: Hucitec; 2014. 34. Alavanja MCR, Hoppin JA, Kamel F. Health effects of
25. Aquino RCA, Lima MLLT, Silva VL, Alencar FL, chronic pesticide exposure: cancer and neurotoxity.
Rodrigues M. Acesso e itinerário terapêutico aos Annu Rev Public Health 2004; 25: 155-97. https://doi.
serviços de saúde nos casos de óbitos por câncer de org/10.1146/annurev.publhealth.25.101802.123020
boca. Rev CEFAC 2018; 20(5): 595-603. https://doi. 35. Dutra LS, Ferreira AP. Associação entre malformações
org/10.1590/1982-0216201820515017 congênitas e a utilização de agrotóxicos em monoculturas
26. Instituto Brasileiro de Geografia e Estatística (IBGE). no Paraná, Brasil. Saúde Debate 2017; 41(2): 241-53.
Produção Agrícola Municipal 2015 [Internet]. Brasília: https://doi.org/10.1590/0103-11042017s220
IBGE; 2015 [accessed on Jul. 20, 2019]. Available at: 36. Silva GA, Gamarra CJ, Girianelli VR, Valente JG.
https://sidra.ibge.gov.br/pesquisa/pam/tabelas Tendência da mortalidade por câncer nas capitais
27. Albergoni L, Pelaez V. Da Revolução Verde à e interior do Brasil entre 1980 e 2006. Rev Saúde
agrobiotecnologia: ruptura ou continuidade de Pública 2011; 45(6): 1009-18. https://doi.org/10.1590/
paradigmas? Rev Economia 2007; 33(1): 31-5. https:// S0034-89102011005000076
doi.org/10.5380/re.v33i1.8546 37. Frias PG, Szwarcwald CL, Lira PIC. Avaliação dos
28. B r a s i l . M i n i s t é r i o d a I n f r a e s t r u t u r a . sistemas de informações sobre nascidos vivos e óbitos no
Departamento Nacional de Infraestrutura de Brasil na década de 2000. Cad Saúde Pública 2014; 30(10):
Transportes. Portal [Internet]. Brazil: Ministério 2068-280. https://doi.org/10.1590/0102-311X00196113
da Infraestrutura [accessed on Apr. 20, 2020]. 38. Mello Jorge MH, Gotlieb SLD, Laurenti R. O sistema de
Available at: http://www.dnit.gov.br/noticias/ informações sobre mortalidade: problemas e propostas
governo-federal-conclui-asfaltamento-da-br-163-pa para o seu enfrentamento I-mortes por causas naturais.
29. Beserra L. Agrotóxicos, vulnerabilidade socioambientais Rev Bras Epidemiol 2002; 5(2): 197-211. https://doi.
e saúde: uma avaliação participativa em municípios org/10.1590/S1415-790X2002000200007
da bacia do rio Juruena, Mato Grosso [dissertation]. 39. United Nations (UN). Economic and Social Council
Cuiabá: UFMT; 2017. [Internet]. New York: United Nations; 2019 [accessed
30. Barry KH, Koutros S, Lubin JH, Coble JB, Barone- on Jan. 28, 2020]. Available at: https://undocs.
Adesi F, Beane Freeman LE, et al. Methyl bromide org/E/2019/68. Accessed 28 Jan 2020.
exposure and cancer risk in the Agricultural Health
Study. Cancer Causes Control 2012; 23: 807-18. https:// Received on: 08/22/2020
doi.org/10.1007/s10552-012-9949-2 Revised on: 12/01/2020
31. VoPham T, Brooks MM, Yuan JM, Talbott EO, Ruddell Accepted on: 12/03/2020
D, Hart JE, et al. Pesticide exposure and hepatocellular Preprint version on: 12/14/2020
carcinoma risk: a case–control study using a geographic
information system (GIS) to link SEER-Medicare and Authors’ contributions: Noemi Dreyer Galvão and
California pesticide data. Environ Res 2015; 143(Part Bárbara da Silva Nalin de Souza designed the study;
A): 68-82. https://doi.org/10.1016/j.envres.2015.09.027 Mário Ribeiro Alves and Amanda Cristina de Souza
32. Koutros S, Beane Freeman LE, Lubin JH, Heltshe Andrade analyzed the data; Jânia Cristiane de Souza
SL, Andreotti G, Barry KH, et al. Risk of total and Oliveira did literature research; Elicléia Filgueira Santiago
aggressive prostate cancer and pesticide use in the de Azevedo drafted the manuscript; Rita Adriana Gomes
Agricultural Health Study. Am J Epidemiol 2013; de Souza revised the manuscript. All authors revised
177(1): 59-74. https://doi.org/10.1093/aje/kws225 and approved the submitted manuscript.
© 2021 Associação Brasileira de Saúde Coletiva
This is an open access article distributed under the terms of the Creative Commons license.
12
REV BRAS EPIDEMIOL 2021; 24: E210009.SUPL.1You can also read