Spencer Stuart Board Index - 2021 Hong Kong
←
→
Page content transcription
If your browser does not render page correctly, please read the page content below
    2021 Hong Kong
    Spencer Stuart
    Board Index
About Spencer Stuart Board Services
At Spencer Stuart, we know how much leadership matters. We are trusted by organizations around the world to help
them make the senior-level leadership decisions that have a lasting impact on their enterprises. Through our exec-
utive search, board and leadership advisory services, we help build and enhance high-performing teams for select
clients ranging from major multinationals to emerging companies to nonprofit institutions.

Privately held since 1956, we focus on delivering knowledge, insight and results through the collaborative efforts of
a team of experts — now spanning more than 70 offices, over 30 countries and more than 50 practice specialties.
Boards and leaders consistently turn to Spencer Stuart to help address their evolving leadership needs in areas
such as senior-level executive search, board recruitment, board effectiveness, succession planning, in-depth senior
management assessment, employee engagement and many other facets of organizational effectiveness.

For more than 35 years, our Board Practice has helped boards around the world identify and recruit independent direc-
tors and provided advice to board chairs, CEOs and nominating committees on important governance issues. We
serve a range of organizations across geographies and scale, from leading multinationals to smaller organizations.

Our global team of board experts works together to ensure that our clients have unrivaled access to the best exist-
ing and potential director talent, and regularly assists boards in increasing the diversity of their composition.

             1,400                                             3,000                                            1,000
We’ve conducted more than 1,400                      We’ve helped place over 3,000                    We’ve helped place more than 1,000
director searches worldwide in the                   women in corporate board roles                   directors from historically underrep-
past year alone.                                     around the world.                                resented racial and ethnic groups in
                                                                                                      corporate board roles worldwide.

In Hong Kong itself, our team has helped many clients enhance their board composition, in particular, increasing
their gender diversity. In the last five years, women have made up a growing share of our board placements, increas-
ing from 33% to 50%, and 18% of the women placed are first-time directors.

           2017                          2018                          2019                          2020                    2021
            33%                           25%                           40%                            40%                    50%

In addition to our work with clients, Spencer Stuart has long played an active role in corporate governance by
exploring the key concerns of boards and providing innovative solutions to the challenges they face. Publishing the
Hong Kong Spencer Stuart Board Index, now in its fourth edition, is just one of our many ongoing efforts. We host
regional chair and director seminars and are a strategic partner to Women Corporate Directors (WCD) Foundation.

Social Media @ Spencer Stuart
Stay up to date on the trends and topics that are relevant to your business and career.

                         @Spencer Stuart

© 2022 Spencer Stuart. All rights reserved.
For information about copying, distributing and displaying this work, contact: permissions@spencerstuart.com.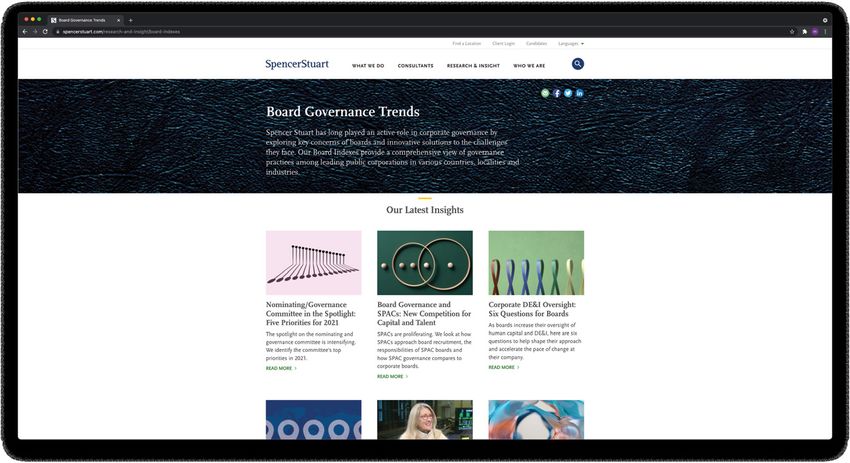
Contents

           1    Foreword
           2    Spencer Stuart Perspective for 2021
           3    Hong Kong Spencer Stuart Board Index 2021 Highlights
           8    Trends over Three and Six Years — Hang Seng Index (HSI)
           9    Methodology
           13   Board Composition
                13   Board size
                14   Chair
                15   Independent non-executive directors
                16   Director tenure

           19 Board Diversity
                19   Age
                19   Foreign directors
                20   Female directors
                23   Women in senior management
                24   Diversity policy
                25   Directors with technology experience
                26   New board directors

           28 Board Organization and Process
                28   Board meetings
                29   Board committee meetings
                30   Nomination committee and chair
                31   ESG committee
                31   Board evaluation

           33   Board Remuneration
                33   Chairs
                33   Independent non-executive directors

           35   2021 Nomination Committee Members & Independent
                Non-Executive Directors Survey
           40 Comparative Board Data
                41   Board directors, diversity and age
                44   Board tenure, meetings and remuneration
Foreword

The 2021 Hong Kong Spencer Stuart Board Index is a comprehensive
study of the governance practices of the constituent companies in
the Hang Seng Index (HSI) and Hang Seng Composite LargeCap
Index (HSLI). The board index provides a snapshot of key governance
practices, including board structure and composition, diversity, com-
mittees, meetings, remuneration and board evaluation, for HSI and
HSLI companies.

This is the fourth edition of the Hong Kong Spencer Stuart Board Index.
It analyzes data from the 58 HSI companies, which have a market
capitalization ranging from US$7–562 billion, and compares that to
data from the 119 companies in the broader-based HSLI, which have
a market capitalization ranging from US$4–562 billion.

An increasing number of mainland Chinese companies, especially in
the new economy sector, have been raising funds in the Hong Kong
market. In 2021, more than 72% of the HSLI companies are mainland
China-headquartered companies, versus 63% when we last did this
study in 2018. Many of these companies, as well as the leading Hong
Kong-headquartered companies, have become more international. For
comparison, you can visit our online international comparison table
summarizing findings from the countries where Spencer Stuart pub-
lishes board indexes.

To gain first-person perspectives on the trends and priorities of local
boards, we surveyed members of board nomination committees and
independent non-executive directors (INEDs) of HSLI companies in
early 2021, and the results are included in this Board Index.

PAGE 1                                                                    SPENCER S TUAR T

Spencer Stuart Perspective for 2021
Corporate boards around the world have been reshaping their composition in recent years, adding new skills and
perspectives. For example, in the U.S., the boards of S&P 500 companies achieved a new milestone in gender diver-
sity in 2021, with women now representing 30% of board directors. Among Hong Kong boards, by comparison,
advances in gender diversity seem to be moving very slowly, even when compared to Singapore and India, both of
which have a higher percentage of women on boards. Based on our survey of nominating committee members and
INEDs, it does seem that gender diversity is at least among the top five priorities of boards, alongside adding expe-
rience in technology and ESG. We certainly hope that our Hong Kong boards will take action on their priorities, truly
reflecting our status as a top international financial center.

Making meaningful progress on recruiting priorities — and ensuring they continually have the right perspectives
around the boardroom table in a dynamic business environment — will require many boards to embrace a new
mindset. While mandatory retirement or term limits can be effective mechanisms to encourage turnover, for-
ward-looking boards will adopt a refreshment mindset and an intentional and ongoing process for evaluating
whether they have the right expertise in the boardroom.

These boards will compare the skills and attributes of current directors with those that are critical to the company’s
long-term strategy to identify and address any gaps or overcapacity. Tools such as board and director assessments
and director skill matrices can be useful for evaluating whether the current board members are still the right ones
to address the organization’s strategy. When they are not, or director performance is lacking, these boards will
have the courage and culture to make a change. They will create the expectation that directors’ continued service
depends on their performance and the value and relevance of their skills on a forward-looking basis.

Boards that take this approach will be well-positioned to regularly inject new and needed perspectives into their
deliberations. They also will reduce reliance on the retirement-based refreshment approach that many boards take
today, in which the oldest person on the board rolls off, regardless of his or her contribution. And when boards
adopt a refreshment mindset and more frequent turnover, directors are less likely to feel the perceived stigma of
leaving a board before retirement age.

Establishing a refreshment mindset also aligns boards with investors, who expect boards to regularly refresh their
skill sets based on the forward-looking strategy. Many investors have expressed a preference for a mix of tenures
in the boardroom: roughly a third each of short-, medium- and long-tenured directors. As boards increase their
refreshment, they also should ensure that they are preparing a diverse pipeline of directors for board leadership
roles. Diversity in leadership can elevate important perspectives and increase the sense of belonging in the board-
room for all directors. Boards typically tap experienced directors for key leadership roles because they already have
institutional knowledge of the company, familiarity with the key issues, and relationships with other board members
and management. Forward-looking board succession planning anticipates the departure of board and committee
leaders and ensures that the board has someone with the right skills, capacity and commitment to serve.

To help develop directors for board leadership, committee chairs will ensure that newer members gain deeper
exposure to committee responsibilities and develop a perspective on which committee members could be strong
committee chairs. The use of “board buddies” — pairing longer-tenured directors with new directors — can help
new directors more quickly get up to speed on board culture, issues and responsibilities, while enabling established
directors to see where they might best serve in future leadership roles.

PAGE 2                                                                                                    SPENCER S TUAR T

Hong Kong Spencer
Stuart Board Index
2021 Highlights

Hong Kong Spencer S tuart B oard Inde x 2021 Highlights

                                              Trending toward smaller board size
                                              The average board size for HSI companies is 11.3 directors, a decrease from
                                              12.4 directors in 2018, consistent with a global trend towards smaller boards.
                                              The share of HSI boards with eight or fewer directors increased from 18%
                                              to 21%, while the percentage of boards with 12 or more directors decreased
                                              from 51% to 41%.

                                              The trend is similar among the broader group of HSLI companies. The aver-
                                              age board size of HSLI companies also decreased — to 10.7 directors in
                                              2021, compared with 11.7 directors in 2018. The percentage of boards with
                                              eight or fewer directors increased from 17% to 25% this year, while the share
                                              of boards with 12 or more directors decreased from 48% in 2018 to 34%
                                              in 2021. The 41 new companies included in the HSLI since 2018 have an
                                              average of 8.9 directors, consistent with the trend of smaller boards. Based
                                              on our experience globally, most boards consider around 10 directors the
                                              optimal size.

                                              More HSI boards splitting the chair
                                              and CEO roles
              vs.                             There has been a slight increase in the number of HSI boards with separate
                                              chair and CEO roles — from 69% in 2018 to 71% in 2021. Four more com-
                                              panies split the roles, but one company combined the roles since our last
                                              study. This is a positive trend as good corporate governance suggests a sep-
                                              aration of the two roles to maintain a healthy system of checks and balances.
                                              Only 9% of HSI company chairs are independent.

                                              We nonetheless see an opposite trend among the broader HSLI companies.
                                              68% of the HSLI companies have separate chair and CEO roles, a decrease
                                              from 71% in 2018. The decline is largely driven by the new companies into the
                                              index, half of which have combined roles. Only 6% of chairs are independent.

PAGE 4                                                                                                         SPENCER S TUAR T
Hong Kong Spencer S tuart B oard Inde x 2021 Highlights

Downward trend in board tenure
 HKEX recently revised the Corporate Governance Code and the Listing
 Rules: effective as of January 2023, independent non-executive direc-
 tors (INEDs) who are serving more than nine years will be regarded as
“long-serving INEDs,” and if all INEDs on the board are long-serving INEDs,
 the board will be required to appoint a new INED at the forthcoming annual
 general meeting (AGM).

INEDs at HSI companies have an average tenure of 7.5 years, compared
with 8.3 years in 2018, while INEDs at HSLI companies have an average ten-
ure of 6.9 years, compared with 7.7 years in 2018. Six HSLI boards have all
long-serving INEDs.

Only five companies in both indexes have explicit term limits for their
INEDs. With a very low rate of board evaluation, Hong Kong boards might
be missing a mechanism to trigger board refreshment. As indicated in our
survey early this year with nomination committee members and INEDs,
boards seem to rely on voluntary retirement even with non-performing
board members.

Very slow progress on gender diversity
Progress on gender diversity in Hong Kong remains embarrassingly slow, far
behind countries like the U.S. and the UK, and even behind Singapore. The
representation of female directors on HSI boards inched up from 12.9% in
2018 to 13.9% in 2021, and from 11.9% to 14% on the broader base HSLI
boards over the last three years. 28% of HSI companies and 27% of HSLI
companies have no female directors.

The picture on the representation of women among senior management,
which provides a talent pipeline for women on boards, is not much better —
only 16.6% and 17.8% of the senior executives of HSI and HSLI companies,
respectively, are women.

PAGE 5                                                                        SPENCER S TUAR T
Hong Kong Spencer S tuart B oard Inde x 2021 Highlights

                                              Gender diversity among new directors is
                                              only slightly better
                                              176 new directors were appointed by HSLI companies in the past financial
                                              year. Overall, the representation of first-time directors among new directors
                                              has increased from 34% in 2018 to 43% in 2021. The percentage of first-time
                                              INEDs has increased from 16% to 29% during the same period, indicating
                                              that boards are looking for new blood.

                                              However, female directors only account for 18% of the new class of direc-
                                              tors, with no movement at all from 2018. We note that close to 50% of the
                                              S&P 500 new director class are women, helping S&P 500 boards reach 30%
                                              female representation in 2021. HKEX has recently mandated NO single
                                              gender boards by 31 December 2024, the first major exchange that has man-
                                              dated such. If HSLI boards get more ambitious and work toward ensuring
                                              that 50% of new directors are women, they can reach 30% female represen-
                                              tation by 2026 even if 25% of the retiring directors each year are women.

                                              Boards met more often, but NOMCO
                                              activities stay low
                                              In a year of unprecedented changes, boards met more often, going from
                                              six meetings in 2018 to 7.3 and 7.1 for HSI and HSLI boards, respectively.
                                              Nomination committees, which generally are accountable for reviewing
                                              board composition, met less often, typically having two meetings a year.
                                              While HKEX has recently made it mandatory for the nomination committee
                                              to be chaired by either the board chair or an INED, it should be noted that
                                              currently only 56% and 54% of the nomination committees of HSI and HSLI
                                              companies, respectively, are chaired by INEDs.

PAGE 6                                                                                                        SPENCER S TUAR T
Hong Kong Spencer S tuart B oard Inde x 2021 Highlights

Increase in ESG committees
Expanding/enhancing environmental, social and governance (ESG) oversight
features as the 4th highest priority in our survey of nomination committee
directors and INEDs. While the trend was very nascent in 2018, currently
48% of HSI companies have an ESG committee at the board level, and 31%
have an ESG committee at the executive level. Among the HSLI, 33% have a
board-level ESG committee and 33% have an executive-level ESG committee.

A decline in board evaluations
While an annual board evaluation is often the norm in many other countries,
it is a bit disconcerting to see the prevalence of board evaluations decline
among Hong Kong boards, from 39% (both internally and externally facili-
tated) in 2018 to 28% in 2021 for HSI companies, and from 27% to 20% for
HSLI companies.

Average INED compensation has
stayed generally flat
While average INED compensation has increased 48% from 2015, it has
stayed flat from 2018 at US$96,000 for HSI companies and increased slightly
from US$85,000 to US$95,000 for the broader-based HSLI companies.

                                         •••

PAGE 7                                                                         SPENCER S TUAR T
Trends over Three and Six Years — Hang Seng Index (HSI)
3-year 6-year
2015 2018 2021 % change % change
Board composition
Average board size 12.9 12.4 11.3 -9% -12%
Split CEO and chair roles 76% 69% 71% 3% -7%
Independent chairs 6% 10% 9% -10% 50%
Independent non-executive directors (INEDs) 44% 46% 45% -2% 2%
Board tenure
Average director tenure 8.5 8.8 8.3 -6% -2%
Average INED tenure (excluding independent chairs) 6.7 8.3 7.5 -10% 12%
Age
Average age of chairs 64 61 61 0% -5%
Average age of INEDs 64 65 66 2% 3%
Foreign directors
% foreign directors: all 18% 19% 17% -11% -6%
Boards with at least one foreign director 68% 69% 57% -17% -16%
Female directors
% women directors: all 11% 12.9% 13.9% 8% 26%
% women directors: INEDs 14% 15% 16% 7% 14%
Female chairs 2% 2% 7% 250% 250%
Companies with at least one female director 74% 78% 72% -8% -3%
Remuneration
Average total INED compensation (US$) 65,000 96,000 96,000 0% 48%
Meetings and board evaluation
Average number of board meetings 6.5 6 7.3 22% 12%
% Boards with externally facilitated evaluation 8% 8% 7% -13% -13%
PAGE 8 SPENCER S TUAR TMethodology
The 2021 Hong Kong Spencer Stuart Board Index is the fourth edition of our regular report on the governance
practices of Hong Kong-listed companies. The purpose of this study is to provide a comprehensive review of the
governance practices of the largest companies listed in Hong Kong during a financial year and to identify major
trends. Information was compiled from publicly available sources, principally annual reports published by the com-
panies, and from BoardEx, a global board intelligence database.
We continue to define the scope of our study to the 119 constituent companies of the Hang Seng Composite Large-
Cap Index (HSLI) so as to have a broader base. All of the Hang Seng Index (HSI) constituent companies are also
constituent companies of the HSLI. Since we last published the index in 2018, the number of constituent compa-
nies of HSLI has increased from 105 to 119, while that of Hang Seng Index (HSI) increased from 51 to 58 companies.
For context, the market capitalization of HSLI companies ranges from US$4 billion to US$562 billion, and HSI com-
panies range from US$7 billion to US$562 billion in market capitalization.
There are 41 new entries and 27 exits in the HSLI since 2021.
Entries
Chinese Mainland headquartered companies
» Alibaba Group Holding » Evergrande Property » New Oriental Education and
» Alibaba Health Services Group Technology Group
Information Technology » GDS Holdings » Nongfu Spring
» Anhui Conch Cement » Haidilao International Holding » Ping An Healthcare
» Baidu » Hansoh Pharmaceutical Group and Technology
» Beigene » JD Health International » Pop Mart International Group
» Bilibili » JD.com » Semiconductor Manufacturing
International
» Blue Moon Group Holdings » Kuaishou Technology
» Smoore International Holdings
» BYD » Li Ning
» WuXi Biologics
» China Feihe » Logan Group
» Xiaomi
» China Resources Mixc » Meituan
Lifestyle Services » Xinyi Solar Holdings
» Ming Yuan Cloud
» China Tower Group Holdings » Yihai International Holding
» Country Garden » NetEase » Zhongsheng Group Holdings
Services Holdings » ZTO Express
Hong Kong/Macau/Overseas headquartered companies
» Budweiser Brewing » HKT » United Company RUSAL
Company APAC » Prada
» HK Electric Investments
PAGE 9 SPENCER S TUAR TMethodology
Exits
Chinese Mainland headquartered companies
» Beijing Enterprises Group » China Hongqiao Group » China Resources
» Beijing Enterprises Water Group » China Huarong Asset Power Holdings
» Brilliance China Automotive Management » China State Construction
Holdings » China Literature International Holdings
» China Cinda Asset Management » China Merchants Port Holdings » China Telecom
» China Communications » China Minsheng Bank » Fullshare Holdings
Construction » China Resources » Haier Electronic Group
» China Everbright International Pharmaceutical Group » Haitong Securities
Hong Kong/Macau/Overseas headquartered companies
» Cathay Pacific Airways » MGM China Holdings » Swire Pacific
» Hang Lung Group » NWS Holdings » Wheelock and Company
» Kerry Properties » Shangri-La Asia » Yue Yuen Industrial Holdings
Throughout our analysis, we compare practices in Hong Kong with four other countries — Japan and Singapore
within the Asia Pacific region, which have developing governance practices; and the United Kingdom (UK) and the
United States (U.S.), which are considered to have more established governance practices. Comparative data are
taken from the most recent Spencer Stuart board indexes of each country, which analyze the NIKKEI 225, STI 30,
FTSE 150, and S&P 500, respectively. For further details, one can visit spencerstuart.com/BATW for our online inter-
national comparison table summarizing findings of the countries where Spencer Stuart publishes board indexes.
We take the financial year-end of the companies as the cut-off date for data collection, with information compiled no
later than March 31st, 2021. Throughout the index, data in some charts may not total 100% due to rounding.
HSI and HSLI shareholding structure
We continue to observe four categories of shareholding structure in the companies studied: companies with con-
centrated ownership1 (family members or individuals with 15% or above of shares in the company) which also
include privately owned enterprises (POE) headquartered in the mainland; companies with diversified institutional
ownership; Hong Kong public sector companies (largely controlled by the Hong Kong government — only 2 com-
panies in our data set); and Chinese state-owned enterprises (largely controlled by the local, provincial or national
governments of China).
1
Known as family-controlled companies in our previous editions.
PAGE 10 SPENCER S TUAR TMethodology
» 55% of the HSI companies are companies with concentrated ownership (CON), up from 45% in 2018, while the
percentage of Chinese state-owned enterprises (SOE) decreased from 35% to 26%.
» Companies with diversified institutional ownership (DIV), which is the norm for listed Western companies,
account for 16% of the HSI companies.
» Hong Kong public sector companies (HKPSC), which include only MTR Corporation and HKEX, represent 3%.
The shareholding structure distribution within the broader group of HSLI companies is similar to that of HSI com-
panies: 61% of the HSLI companies have concentrated ownership (CON). Chinese state-owned enterprises (SOE)
continue to make up the second-largest category at 25%. Companies with diversified institutional ownership (DIV)
represent 13% of the companies, and the rest (2%) are Hong Kong public sector companies (HKPSC).
—
HSI SHAREHOLDING STRUCTURE
55%
45%
42% 40%
35%
26%
14% 16% 16%
4% 4% 3%
CON SOE DIV HKPSC
2015 2018 2021
—
HSLI SHAREHOLDING STRUCTURE
61%
47%
44%
37% 37%
25%
17%
14% 13%
2% 2% 2%
CON SOE DIV HKPSC
2015 2018 2021
PAGE 11 SPENCER S TUAR TMethodology
HSI and HSLI by industry
The largest constituency of the HSI companies is the property and infrastructure industry (22%). Financial services
companies make up the second-largest category at 19%, followed by consumer and utilities industries (12%), then
information technology and industrial sectors (10%). The remaining are in the healthcare (7%), conglomerates
(3%), and telecommunications sectors (3%). In the broader HSLI index, there seem to be more consumer and
information technology companies than in HSI, largely because of some of the new economy companies.
—
HSI AND HSLI COMPANIES BY INDUSTRY — 2021
HSI HSLI
Property and infrastructure 22% 18%
Financial services 19% 16%
Consumer 12% 19%
Utilities 12% 11%
Information technology 10% 13%
Industrial 10% 9%
Healthcare 7% 7%
Conglomerates 3% 3%
Telecommunications 3% 3%
HSI and HSLI by headquarters location
62% and 72%, respectively, of the HSI and HSLI companies are headquartered in mainland China. This is up from
51% of HSI companies and 63% of HSLI companies in 2018.
PAGE 12 SPENCER S TUAR TBoard Composition
Board size
The average board size of the HSI companies is 11.3 directors, while the average of the HSLI companies is 10.7
directors, a slight decrease from 2018. There are relatively more boards with eight or fewer directors. In contrast, the
percentage of HSI companies with boards comprising more than 12 directors has decreased substantially, from 51%
in 2018 to 41% in 2021, which is in line with the global trend of decreasing the size of the board.
MTR Corporation and Sun Hung Kai Properties top the list of the largest boards, with 20 members each, and both
are Hong Kong-headquartered companies. Baidu and JD.com, both mainland China-headquartered and new econ-
omy companies, have the smallest boards, with five members each.
—
BOARD SIZE
2015 2018 2021 Change from 2015 to 2021
HSI HSLI HSI HSLI HSI HSLI HSI HSLI
Average 12.9 12.6 12.4 11.7 11.3 10.7 -12% -15%
% of 8 or fewer directors 10% 10% 18% 17% 21% 25% 110% 150%
% of 9 to 11 32% 33% 33% 35% 38% 41% 19% 24%
% of 12 or more directors 54% 57% 51% 48% 41% 34% -24% -40%
Average board size, irrespective of shareholding structure, has been decreasing over the past six years. The excep-
tion is the two Hong Kong public sector companies, MTR Corporation and HKEX, both of which have a number of
government-appointed directors. Their average size remains at 16.5.
—
AVERAGE NUMBER OF BOARD DIRECTORS BY SHAREHOLDING STRUCTURE — HSLI
16 16.5 16.5
13
11.5 12 12 12 11.5
10.5 10.7 10.8
CON DIV HKPSC SOE
2015 2018 2021
PAGE 13 SPENCER S TUAR TB oard Composition
Comparing the average size of HSI boards with the regional and global averages, we note that the Hong Kong aver-
age is slightly higher at 11.3, but the difference is small. Interestingly, the percentage of companies in Hong Kong
with larger boards (12 members or more) is significantly higher than in Singapore and U.S.
—
THE BROADER VIEW: BOARD SIZE
HK — HSI HK — HSLI Japan Singapore UK U.S.
Average size 11.3 10.7 10.7 10.4 10.1 10.8
% of 8 or fewer directors 21% 25% 23% 20% 30% 13%
% of 9 to 11 38% 41% 77% *
57% 70% *
71%
% of 12 or more directors 41% 34% - 23% - 16%
*
Ratio based on 9 to 12 members.
Chair
To establish a healthy checks and balances, HKEX has encouraged the separation of the board chair and CEO
roles. It is great to see an increase in the number of HSI boards that have separated the chair and CEO roles, from
69% in 2018 to 71% in 2021. Four of the companies from our last study have since separated the two roles —
China Overseas Land and Investment, China Petroleum & Chemical, China Resources Land and Ping An Insurance
Group, all mainland China-headquartered companies. Meanwhile, CK Asset Holdings has combined these roles
since our last study.
While the number of companies separating the chair and CEO roles has increased, the percentages of HK com-
panies with independent chairs remain very low — 9% and 6%, respectively, for HSI and HSLI companies. 7% of
the chairs of HSI companies are female, and Laura Cha, the chairwoman of HKEX, is the only female independent
non-executive chair among all companies, as of the cut-off date.2
—
CHAIRS
2018 2021
HSI HSLI HSI HSLI
Separate chair and CEO 69% 71% 71% 68%
Independent chair 10% 5% 9% 6%
Female chair - - 7% 7%
All the conglomerates and financial services companies have separated the two roles, while only 38% and 29%,
respectively, of healthcare and information technology sector companies — both newer economy industries — have
separated both roles.
2
Irene Lee was appointed as the independent non-executive chair of Hang Seng Bank on 27th May 2021.
PAGE 14 SPENCER S TUAR TB oard Composition
—
COMPANIES WITH SEPARATE CHAIR AND CEO ROLES BY INDUSTRY — HSLI 2021
100% 100%
92%
75% 73%
64%
55%
38%
29%
l er y
ates rvic
es ities tion
s
ctur
e
stria um hca
re
olog
er se Util unic
a tru Ind
u
Con
s
Hea
lt
tech
n
glom cial fras
Con Fina
n om
m
and
in tion
Tele
c
rty rma
ope Info
Pr
Compared to regional and global companies, Hong Kong companies have a much lower percentage of chairs who
are independent.
—
THE BROADER VIEW: CHAIRS
HK — HSI HK — HSLI Japan Singapore UK U.S.
Separate chair and CEO roles 71% 68% - 83% 100% 59%
Independent chair 9% 6% 10% 43% 71% 37%
Independent non-executive directors
Unlike jurisdictions where non-executive directors are all independent, Hong Kong-listed companies have two
categories of non-executive directors — non-independent non-executive directors (NEDs) and independent non-ex-
ecutive directors (INEDs). The NEDs tend to be executives from a sister company within the group, representatives
of one of the major shareholders, or executives who have recently retired from the company. It can be argued that
companies can benefit from having insights into possible synergies with other group companies and from the expe-
rience of recently retired company executives. It does seem that the INEDs do have to carry the burden of mitigating
conflicts between shareholder groups and counterbalancing the influence of the major shareholders for the benefit
of the minority shareholders.
According to the independence requirement set out in the Main Board Listing Rules of HKEX, boards are required
to appoint INEDs representing at least one-third of the board. All the boards fulfilled the requirement.
INEDs, including chairs, account for 45% of all HSI board directors, a small decrease from 46% in 2018. It was the
first time that the INED percentage has declined since 2010. The percentage of companies with over two-thirds of
INEDs has also decreased from 12% to 9%. The INED percentage might have been diluted by the 16 new HSI com-
panies, which on average have 39% of INEDs on the boards — generally just enough to meet the exchange rules.
PAGE 15 SPENCER S TUAR TB oard Composition
—
PERCENTAGE OF INEDS
2010 2013 2015 2018 2021
HSI HSI HSI HSLI HSI HSLI HSI HSLI
Average 39% 42% 44% 41% 46% 42% 45% 43%
Fewer than 33% 24% 4% 2% 2% 0% 2% 0% 0%
33% to 49% 52% 72% 72% 80% 71% 77% 72% 78%
50% to 65% 22% 18% 14% 11% 18% 15% 19% 15%
66% or more 2% 6% 12% 7% 12% 6% 9% 8%
Compared to regional and global boards, Hong Kong companies generally have a lower percentage of
independent directors.
—
THE BROADER VIEW: PERCENTAGE OF INDEPENDENT DIRECTORS
HK — HSI HK — HSLI Japan Singapore UK U.S.
Percentage 45% 43% 39% 57% 70% 85%
Overboarding
According to the revised Code Provision A.5.5 of HKEX, which came into effect in January 2019, companies are
required to explain how proposed INEDs who hold seven or more directorships would be able to devote sufficient
time to the board. INEDs of HSLI companies sit on 2.5 public boards on average. 3% (12) of HSLI INEDs held
seven or more public directorships in 2021, lower than 9% (44) in 2018 — a positive trend. The most public board
directorships held by a director is 19.
Director tenure
The average tenure for directors of HSI boards is 8.3 years, a slight decrease from 8.8 years in 2018. The board of
Henderson Land Development has the highest average director tenure of 22.6 years. The Honorable Sir Michael
Kadoorie at CLP Power Hong Kong is the longest-serving director, approximately 54 years.
Chairs have an average tenure of 8.9 years for HSI boards. 21 (36%) chairs of HSI companies have been in position
for 10 years or more. The longest-tenured chair has been serving for 36 years. In contrast, 22 (38%) chairs have
been in their roles for less than three years.
The average tenure of HSI company CEOs is 7.4 years. 18 (31%) CEOs have a tenure of 10 years or more.
To ensure the INEDs retain their independence and remain capable of bringing fresh perspectives to the board,
HKEX recently revised the Corporate Governance Code and the Listing Rules: effective January 2023, independent
non-executive directors (INEDs) who are serving more than nine years will be regarded as “long-serving INEDs,”
and if all INEDs on the board are long-serving INEDs, the board will be required to appoint a new INED at the forth-
coming annual general meeting (AGM).
PAGE 16 SPENCER S TUAR TB oard Composition
Among HSI companies, the average INED tenure, excluding independent chairs, declined to 7.5 years in 2021, a
slight decrease from 8.3 in 2018.
20 (35%) companies have an average INED tenure of nine years or above. All the INEDs of Galaxy Entertainment
Group and Longfor Group Holdings have served for more than nine years. Bank of Communications and Ping An
Insurance Group have now joined HKEX, Link REIT and Lenovo Group in establishing a tenure limit for INEDs.
—
HONG KONG BOARDS WITH TERM LIMITS FOR INEDS — 2021
Companies Tenure Limit
Bank of Communications 6 years
Ping An Insurance Group 6 years
HKEX 9 years
Link REIT 9 years
Lenovo Group 12 years
—
INED TENURE (YEARS)
2021
HSI HSLI
Average INED tenure (excluding independent chairs) 7.5 6.9
Companies with an INED average tenure 9 years or above 35% 29%
Companies with all INEDs serving over 9 Years 3% 5%
—
AVERAGE TENURE OF INED (NUMBER OF COMPANIES) — HSLI 2021 *
39
37
20
15
6
0 – 3.9 years 4 – 7.9 years 8 – 11.9 years 12 – 15.9 years 16 – 20 years
*
Data of 117 companies only; two companies’ data was not for the full year as their boards were only formed in the year of our study.
PAGE 17 SPENCER S TUAR TB oard Composition
The average tenure of INEDs serving on the boards of conglomerates companies stands at 10.4 years, which is the
highest among all the industries, while the healthcare businesses, which are newcomers into the indexes, have the
lowest average tenure at 4.3 years. Financial services companies also have a relatively low average tenure of INEDs
at 4.8 years, as reflected by the guidance of the Hong Kong Monetary Authority (HKMA) that the INEDs should not
serve for over nine years to maintain the independence of the boards.
—
AVERAGE TENURE OF INED BY INDUSTRY (EXCLUDING INDEPENDENT CHAIRS) — HSLI 2021
10.4
8.8
8.2 7.7 7.6
5.7 5.7
4.8 4.3
ates ture er ities ns ial gy ces are
mer truc sum Util nicatio ustr nolo ervi lthc
l o a s Con Ind ech ls Hea
Con
g nf r mu on t ncia
nd i com
rma
ti Fina
e r ty a Tele Info
p
Pro
—
THE BROADER VIEW: AVERAGE TENURE OF INDEPENDENT DIRECTORS
HK — HSI HK — HSLI Japan Singapore UK U.S.
Tenure of independent director (years) 7.5 6.9 - 5.2 4.2 7.9
PAGE 18 SPENCER S TUAR TBoard Diversity
Age
The average ages of HSI and HSLI directors are 61 and 59 years old, respectively. The average ages for HSI and
HSLI chairs are 61 years old and 60 years old. The oldest chair is Chi Woo Lui at Galaxy Entertainment Group (92)
while the youngest is Theresa Tse at Sino Biopharmaceutical (29). The average age of INEDs is 66 years old for HSI
boards and 64 years old for HSLI boards. The oldest INED is Stanley Kwok3 (95) at CK Hutchison Holdings and the
youngest is Gary Ngan at Pop Mart International Group (38). It is also interesting to note that the average age of
Hong Kong/Macau-headquartered companies is 66 years old, which is significantly older than the Chinese main-
land-headquartered companies at 56 years old.
Across the shareholding structures, SOE chairs and CEOs are the youngest on average because of the retirement
age requirements in China. Generally, INEDs are older on average than all directors.
—
AVERAGE AGE OF BOARD DIRECTORS BY SHAREHOLDING STRUCTURE (YEARS OLD) — HSLI 2021
70.5
63.2 63.3 63.7 64.8 64.3
59.7 58.4 59.8 59.6 58.6 58.8
CON DIV HKPSC SOE
Chair Director INED (excluding independent chairs)
Foreign directors
17% of all HSI directors are foreign directors,4 a decrease from 19% in 2018. The number of HSI companies with no
foreign board director has significantly increased from 31% in 2018 to 43% in 2021, whereas the number of HSLI
companies with no foreign board director slightly decreased from 55% in 2018 to 52% in 2021.
Foreign EDs, NEDs and INEDs account for 9%, 18% and 24% of all HSI company directors, respectively.
The average number of nationalities on each board of HSI companies is 2.4, similar to 2.5 in 2018. The board of CLP
Holdings has seven different nationalities represented among its 14 directors — driven by the regional nature of the
company business across Greater China, India, Australia, etc.
3
Stanley Kwok retired from the board on 13 May 2021.
4
Foreign directors are defined as ethnic background other than mainland Chinese, Hong Kong Chinese or Taiwanese.
PAGE 19 SPENCER S TUAR TB oard Diversity
—
FOREIGN REPRESENTATION
2021
HSI HSLI
Foreign directors on the boards 17% 15%
Foreign executive directors 9% 8%
Foreign non-executive directors 18% 17%
Foreign independent non-executive directors 24% 20%
Companies with no foreign director 43% 52%
Average number of nationalities represented 2.4 2.1
—
DISTRIBUTION OF NATIONALITIES OF FOREIGN DIRECTORS BY PERCENTAGE — HSLI 2021
British
21% American
23%
Southeast Asian
Canadian
3%
4% Japanese
5% Italian
17%
5% Australian
6% Indian
16% Others
Female directors
The progress of gender diversity in Hong Kong remains very slow, increasing by only five percentage points over the
last 11 years. Women account for 13.9% of all HSI directors, up from 12.9% in 2018, 11% in 2015, 9.5% in 2013, and
9% in 2010. The representation of female INEDs on HSI companies grew at a particularly slow pace, from 14% in
2015 to 16% in 2021. There seem to be slightly more gains among the female EDs and NEDs.
HKEX is strongly encouraging companies to rid of single-gender boards to create cognitive diversity in the board-
room and break down a tendency towards “group think.” Effective January 2022, HKEX requires all single-gender
boards appoint at least one director of the absent gender in the next three years, and that no IPO applicants will
have single-gender boards after July 2022. In 2021, 16 HSI boards, 28%, have no female directors, an increase from
22% three years ago! The financial services sector is the only industry that has no single-gender boards.
40% of HSI companies, down from 43% in 2018, have two or more female directors. Among all the HSLI compa-
nies, Hang Seng Bank, HSBC Holdings and MTR Corporation have the highest number of female directors, each
with five women on their boards, while Hansoh Pharmaceutical Group, whose chair and CEO is a woman, has the
highest percentage of female directors at 57%, with four women on its board.
PAGE 20 SPENCER S TUAR TB oard Diversity
—
FEMALE REPRESENTATION ON HONG KONG BOARDS
2010 2013 2015 2018 2021
HSI HSI HSI HSLI HSI HSLI HSI HSLI
Women on boards 9% 9.5% 11% 11% 12.9% 11.9% 13.9% 14%
Boards with two or
- - 34% 36% 43% 39% 40% 41%
more female directors
Boards with no
- - 26% 27% 22% 28% 28% 27%
female directors
Female executive directors - - 8% 8% 11% 10% 11% 13%
Female non-executive
- - 9% 11% 11% 12% 14% 13%
directors
Female independent
- - 14% 14% 15% 14% 16% 15%
non-executive directors
In terms of shareholding structure, CON, DIV and HKPSC boards have registered an increase in the percentage of
female directors. SOE boards, which account for a quarter of the HSI and HSLI indexes, actually have a slight reduc-
tion of female directors from 11% in 2018 to 10.8% in 2021. Looking through the headquarters location lens, the
average female representation of the Hong Kong/Macau-headquartered companies is 17.4% in 2021, higher than
the average of the Chinese mainland-headquartered companies at 12%.
—
FEMALE DIRECTORS BY SHAREHOLDING STRUCTURE — HSLI
24.2%
20.6%
14.9% 15.2%
13.4%
11.5% 11% 10.8%
CON DIV HKPSC SOE
2018 2021
—
FEMALE DIRECTORS BY HEADQUARTERS LOCATIONS — HSLI
17.4%
12.9%
12%
10.9%
Mainland China Hong Kong SAR/ Macau SAR
2018 2021
PAGE 21 SPENCER S TUAR TB oard Diversity
Within the HSLI, there is one woman who serves as chair and chief executive, seven chairwomen and four female
CEOs. Six of the eight women serving as chairs are either founders, owners or close relatives of owners of the
companies with concentrated ownership. HSLI companies led by a female chair or CEO tend to have a higher per-
centage of female board directors than companies led by a male chairperson or CEO — 28% versus 12%.
—
COMPANIES WITH WOMEN SERVING AS CHAIR OR CEO
Total number Number of Percentage of
of directors female directors female directors
excluding chair/ excluding chair/ excluding chair/
Companies Chair CEO CEO CEO CEO
Hansoh Pharmaceutical Group Huijuan Zhong Huijuan Zhong 6 3 50%
Blue Moon Group Holdings Dong Pan - 8 3 38%
China CITIC Bank Qingping Li - 9 2 22%
Country Garden Services Holdings Huiyan Yang - 8 1 13%
Hong Kong Exchanges and Clearing Laura Cha - 12 2 17%
Longfor Group Holdings Yajun Wu - 7 0 0%
Sino Biopharmaceutical Theresa Tse - 13 3 23%
SJM Holdings Daisy Ho - 11 3 27%
Hang Seng Bank5 - Louisa Cheang 11 4 36%
HKT - Susanna Hui 10 1 10%
Ping An Insurance Group - Jessica Tan (Co-CEO) 12 1 8%
Miuccia Prade Bianchi
Prada - 8 1 13%
(Co-CEO)
Compared to boards in the region and in the developed markets like UK and U.S., Hong Kong seriously lags behind
in gender diversity on boards. If we continue at this pace without any changes, we estimate it will take HSI and HSLI
companies until 2057 to reach 30% women on boards — unacceptable for a financial center. There are many ways
to improve our situation — more board refreshment, ensuring a higher percentage of women are being considered
for new director roles — whether for companies going through refreshment or going IPO.
—
THE BROADER VIEW: WOMEN ON BOARDS
HK — HSI HK — HSLI Japan Singapore UK U.S.
Percentage 13.9% 14% 11% 16% 33.8% 30%
5
Irene Lee was appointed as the independent non-executive chair of Hang Seng Bank on 27th May 2021.
Diana Cesar was appointed as the CEO on 1st September 2021.
PAGE 22 SPENCER S TUAR TB oard Diversity
—
NUMBER OF FEMALE DIRECTORS (NUMBER OF COMPANIES) — HSLI 2021
3
11
32 0 women
10
1 woman
2 women
3 women
25 4 women
5 women
38
Women in senior management
Senior executives are often the talent pipeline for future board directors. On this score, Hong Kong companies are
also low — only 16.6% of all HSI senior management and 17.8% of all HSLI senior management are women.
—
FEMALE SENIOR MANAGEMENT
2021 senior management 2021 board of directors
HSI HSLI HSI HSLI
% female 16.6% 17.8% 13.9% 14%
% of companies with at least two women 43% 41% 40% 41%
% of companies with no women 31% 31% 28% 27%
# of companies with no women 18 37 16 32
Overall, 31% (37) of the HSLI companies have no senior female executives. Telecommunications companies have
the highest percentages of companies with no woman executives (75%) or directors (50%). It is also surprising to
see that although all financial services boards have women directors, 32% of the companies have single-gender
senior management.
PAGE 23 SPENCER S TUAR TB oard Diversity
—
PERCENTAGE OF COMPANIES WITH NO FEMALE SENIOR MANAGEMENT OR DIRECTORS BY
INDUSTRY — HSLI 2021
75%
64%
50% 50% 47%
45% 46%
40% 38%
32%
25% 25% 26% 23%
17% 14% 14%
0%
s s l gy s er
tion rate stria nolo care vic e um ities uctu
re
nica m e
Ind
u ch Hea
lth
lser
Con
s Util str
mu nglo n te ncia nfra
c om Co
rma
tio Fina nd i
Tele Info erty a
Prop
Senior management Director
What does it take for a woman to get to become senior management and/or a board director? Within the HSLI,
11% of the women executives and 14% of the women directors are either family members or founding members
of the companies, compared with 13% of men. Excluding that, not surprisingly, the most important background is
P&L operating experience, followed by finance and HR for senior management, and legal/regulatory and finance for
board directors.
—
BACKGROUNDS OF FEMALE SENIOR MANAGEMENT AND DIRECTORS — HSLI 2021
55% 57%
Family/founding members
17% 15% 19%
14%
11% 12%
9% 7%
3% 5%
1% 0%
Operating experience Audit/finance Regulatory/legal Marketing Human resources Academic professor
(CEO/GM/P&L)
Female senior management Female directors
Diversity policy
Effective since January 2019, HKEX has required listed companies to establish a diversity policy and to disclose a
summary of the policy in the corporate governance report. Not surprisingly, companies that articulated a compre-
hensive diversity policy had a higher average number of foreign directors, female directors and female executives
than those that only mentioned diversity briefly in their corporate governance report.
PAGE 24 SPENCER S TUAR TB oard Diversity
—
ADOPTION OF DIVERSITY POLICY VERSUS AVERAGE NUMBER OF FOREIGN DIRECTORS, FEMALE
DIRECTORS AND SENIOR MANAGEMENT — HSLI 2021
2.5
2.2
2
1.5 1.4
1.2 1.3
1
0.6
Average number of foreign directors Average number of female directors Average number of female
senior management
Published publicly Briefly stated None
Published publicly: Companies adopted a diversity policy and disclosed the policy on the websites.
Briefly stated: Companies mentioned the diversity policy with brief headlines in the corporate governance report.
None: Companies did not mention having a diversity policy in the corporate governance report.
Directors with technology experience
In our survey of nomination committee members and INEDs in early 2021, cybersecurity and digital disruption was
identified as the third most important board priority. Having digital, technology and social media experience was
the second-most desired background in new directors.
Nevertheless, technology directors only account for 11% of all HSI directors and 13% of all HSLI directors. Based on
our experience, there is sometimes a gap between the desire and the ability to find the right candidate with a technol-
ogy background who fits with the board. To fill the gap, some companies have set up technology advisory boards to
provide strategic advice on technology, digital and business transformations to the board and executive committees.
—
TECHNOLOGY DIRECTORS — 2021
2021
Technology/digital directors HSI HSLI
% of technology directors 11% 13%
% of companies with no technology director 53% 54%
PAGE 25 SPENCER S TUAR TB oard Diversity
New board directors
176 new board appointments were made among HSLI companies in the past financial year — 39% of these are
EDs, 24% are NEDs and 37% are INEDS. Among these new board members, similar to 2018, 18% are women and
11% are foreigners. 26% of the new directors are younger than 50 versus 17% of all HSLI directors. This represents a
decrease from 35% in 2018, but the proportion of first-time directors6 has increased from 34% to 43%.
With no increase in the representation of women in the new director class compared with 2018, it will be difficult to
make progress on gender diversity. We note that among S&P 500 boards, which finally achieved 30% representation
of women on boards in 2021, close to 50% of its most recent new director class are women. Going forward, if 50%
(instead of 18%) of the new directors are women, HSLI boards can reach 30% female representation by 2026, even
if 25% of retiring directors are women!
—
NEW DIRECTOR INDEPENDENCE — HSLI 2021
New directors New EDs New NEDs New INEDs
176 39% 24% 37%
—
NEW DIRECTOR SNAPSHOT — HSLI
2018 2021
New directors New INEDs New directors New INEDs
Total 170 56 176 66
Average age 53.8 - 53.9 57.6
% younger than 50 35% - 26% 18%
% female directors 18% 23% 18% 20%
% foreign directors 12% 23% 11% 17%
—
FIRST-TIME DIRECTOR SNAPSHOT — HSLI
2018 2021
New directors New INEDs New directors New INEDs
% of first-time directors 34% 16% 43% 29%
Average age of
- - 51.3 55.6
first-time directors
% of first-time
- - 20% 11%
female directors
6
First-time directors are defined as the new directors who have no prior public board experience before.
PAGE 26 SPENCER S TUAR TB oard Diversity
Respectively, 64% and 53% of all new directors and new INEDs are executives who have prior operating experience,
consistent with overall director profile. It is interesting to note that 18% of the new INEDs are academic professors.
—
BACKGROUNDS OF NEW DIRECTORS — HSLI 2021
64%
53%
17% 18%
14% 11% 12%
7%
1% 2%
Operating experience Audit/finance Regulatory/legal Academic professor Marketing
(CEO/GM/P&L)
New directors New INEDs
Although the percentage of female directors among new directors is higher than the overall percentage of women
directors, Hong Kong boards significantly lag the boards of the UK and the U.S. when it comes to the gender diver-
sity of the newest class of directors. The U.S. (S&P 500) has in 2021 finally reached the target of 30% of women on
boards through accelerating the recruitment of women for all new board positions.
—
THE BROADER VIEW: PERCENTAGE OF WOMEN AMONG NEW BOARD DIRECTORS
HK — HSI HK — HSLI Japan Singapore UK U.S.
Percentage 19% 18% - 21% 50% 47%
PAGE 27 SPENCER S TUAR TBoard Organization and Process
Board meetings
In a year when businesses were buffeted by a pandemic and geopolitics, HSI boards met more often, holding
7.3 meetings7 on average versus six in 2018. 44% of HSI boards met five or fewer times, while 23% met 10 or more
times. Geely Automobile Holdings met 23 times, versus two times of Anhui Conch Cement, throughout the last
financial year.
—
BOARD MEETING DISTRIBUTION
2018 2021
HSI HSLI HSI HSLI
Average board meetings 6 6 7.3 7.1
5 or fewer board meetings 51% 34% 44% 44%
6 to 9 board meetings 35% 39% 33% 35%
10 or more board meetings 14% 27% 23% 21%
As in 2018, the boards of financial services companies met the most frequently, followed by industrial and health-
care company boards.
—
AVERAGE NUMBER OF BOARD MEETINGS BY INDUSTRY — HSLI
10.6
8.2 8.7
7.6 7.8
6.7 7 6.7
6 6.2 6 6.4
5 5.3 5.7 5.3
4.3 4.5
es al re ities y
ctur
e er es s
servic ustri lthca Util nolog tru sum erat a tion
cial Ind Hea tech fras Con nglo
m
m unic
Fina
n tion and
in Co om
rma rty Tele
c
Info ope
Pr
2018 2021
7
Data of 102 companies only; nine companies’ data was not for the full year as they were only listed in the year of our study;
eight companies have no specific data.
PAGE 28 SPENCER S TUAR TB oard Organization and Process
The meeting cadence of Hong Kong company boards is on par with that of the boards of companies in
other countries.
—
THE BROADER VIEW: AVERAGE NUMBER OF BOARD MEETINGS
HK — HSI HK — HSLI Japan Singapore UK U.S.
Percentage 7.3 7.1 14 5.7 7.7 7.9
Board committee meetings
HSI boards on average convened four audit committee meetings, two to three remuneration committee meetings,
and two nomination committee8 meetings throughout the financial year. The number of committee meetings of
Hong Kong boards is on par with companies in Singapore, and much less than companies in the U.S.
—
THE BROADER VIEW: AVERAGE NUMBER OF BOARD COMMITTEE MEETINGS
HK — HSI HK — HSLI Japan Singapore UK U.S.
Audit committee 4.1 4.4 - 4.8 5.2 8.2
Remuneration committee 2.4 2.3 - 2.9 5.2 5.9
Nomination committee 2.1 2 - 2.4 4 4.5
While audit committees across all shareholding structures are busy, we notice that the remuneration committees
and nomination committees of companies with diversified institutional ownership (DIV) and Hong Kong public
service companies (HKPSC) meet just as frequently, probably reflecting a trend that institutional investors and
government stakeholders are increasingly focused on executive compensation and the composition of boards. Not
surprisingly, committees of financial service companies that are highly regulated have the most meetings.
—
AVERAGE NUMBER OF COMMITTEE MEETINGS BY SHAREHOLDING STRUCTURE — HSLI 2021
CON DIV HKPSC SOE
Audit committee 3.5 5.9 4 5.4
Remuneration committee 1.9 4.1 4.5 2.2
Nomination committee 1.4 3.1 4 2.4
8
10% (6) and 12% (14) of HSI and HSLI companies merged remuneration and nomination into one committee.
PAGE 29 SPENCER S TUAR TB oard Organization and Process
—
AVERAGE NUMBER OF COMMITTEE MEETINGS BY INDUSTRY — HSLI 2021
6.6
5
4.5 4.2
3.7 4 4
3.5
3 3.3 3.1 3.2
2.3 2 2.6 2.4
2.1 1.8 1.8 2.1 2 2
1.5 1.4 1.4 1.5 1.6
ates er es re l gy re ns ities
er sum se rvic lthca tria us nolo r uctu c atio Util
glom Con cial Hea Ind
n te
c h
nfra
s t
mu
n i
Con Fina
n
atio a nd i e com
r m t y e l
Info per T
Pro
Audit committee Remuneration committee Nomination committee
Nomination committee and chair
To emphasize the importance of oversight of board nomination and succession planning, HKEX has recently made it
mandatory for the nomination committee to be chaired by either the board chair or an INED. As of our cut-off date,
three companies do not have a nomination committee, compared to six in 2018. All of them are companies with con-
centrated ownership: Hansoh Pharmaceutical Group, Longfor Group, and Swire Properties. They have explained in
their annual reports that it would be in the best interest of the company for all members of the board to collectively
review the structure, size and composition of the board, and approve the appointment of any new directors.
56% of HSI companies and 54% of HSLI companies have an INED as their nomination committee chair. In terms
of industry, the financial services sector has the highest percentage (90%) of companies with INED as nomination
committee chairs, while healthcare companies, most of which are still founder-led, have the least at 29%.
—
PERCENTAGE OF COMPANIES WITH INED NOMINATION COMMITTEE CHAIRS BY
INDUSTRY — HSLI 2021
90%
75%
57% 55% 52% 50%
40%
31% 29%
ces ns gy ial er es re ities re
ervi nic atio nolo ustr s um erat structu Util lt hca
ls
n te
ch Ind Con nglo
m Hea
ncia mu nfra
Fina c om
rma
tio Co nd i
Tele Info erty a
P rop
PAGE 30 SPENCER S TUAR TB oard Organization and Process
ESG committee
Although it is not mandatory, establishing an environmental, social and governance (ESG) committee is suggested
by the HKEX Listing Committee as it helps a listed company ensure its ESG implementation is keeping pace with
external trends.
Among all the HSI companies, 48% have an ESG committee at the board level, and 31% have the ESG committees
at the executive level. Committees have a variety of names, including “corporate social responsibility committee,”
“health, safety and environmental committee” and “sustainable development committee.” For the HSLI boards,
33% have a board-level ESG committee and 33% have an executive-level ESG committee. Compared to Singapore,
only 20% of the STI companies have an ESG committee.
86% of property and infrastructure and 79% of financial services companies have established an ESG committee,
either at the board level or at the executive level. Meanwhile, only 13% of healthcare companies have done so.
—
PERCENTAGE OF COMPANIES WITH ESG COMMITTEES BY INDUSTRY — HSLI 2021
86% 88%
79% 77% 75% 75% 73%
45% 26% 23% 25%
53%
36% 47% 48% 52%
33%
50% 25% 25% 27% 35%
53% 21% 54% 23%
41% 14% 37% 13%
20% 13%
0% 0%
re ces ies es ns al y er re
r uctu ervi tilit erat atio u stri n olog sum lthca
nfra
s t
ncia
l s U
nglo
m
munic In d
n te
c h Con Hea
nd i Fina Co com atio
r ty a Tele Info
r m
Prope
ESG committee ( Board-level ESG committee Executive-level ESG committee ) No ESG committee
Board evaluation
28% of HSI companies reported conducting a board evaluation in 2021, a decrease from 39% in 2018, with four
companies (7%) engaging an external facilitator to conduct the board evaluation. AIA Group, CLP Holdings,
HSBC Holdings and MTR Corporation reported undertaking an externally facilitated board evaluation during the
financial year.
PAGE 31 SPENCER S TUAR TB oard Organization and Process
Only 20% of HSLI companies undertook a board evaluation in 2021, indicating that the practice is most common
among the largest companies.
—
INTERNAL VERSUS EXTERNAL EVALUATION
2018 2021
HSI HSLI HSI HSLI
Board evaluation — externally facilitated 8% 4% 7% 3%
Board evaluation — internally facilitated 31% 23% 21% 17%
Around the world, board evaluation has grown to be a critically important exercise for boards to improve the
dynamics of the board, helping to crystallize strategic focus, progress and direction of the board. Board evaluations
typically look at board process, board dynamics, the board agenda, and the board’s increasingly important role in
helping the leadership team set strategy and conduct succession planning. Despite board evaluation being a best
practice under the HKEX code, only very few companies in Hong Kong have adopted the practice, especially com-
pared to those in other countries, including Singapore.
—
THE BROADER VIEW: BOARD EVALUATION
HK — HSI HK — HSLI Japan Singapore UK U.S.
Boards conducting an evaluation 28% 20% - 86% 98% 98%
PAGE 32 SPENCER S TUAR TYou can also read