Spetterend Sanitair 2025 - Manufacturer report Developments in the sanitary sector

Page created by Carlos Kramer
 
CONTINUE READING
Spetterend Sanitair 2025 - Manufacturer report Developments in the sanitary sector
Spetterend Sanitair 2025
                                        Manufacturer report

Developments in the sanitary sector
Geert-Jan Aries – Reinier Zuydgeest – Hanane Bouazzazoui
Spetterend Sanitair 2025 - Manufacturer report Developments in the sanitary sector
INTRODUCTION

Five years ago, the sanitary sector was different than it is today. Online sales were only a
very, very small part of the total sales, the sustainability aspect hardly played a role, and the
most important design trends were concrete, gloss bathroom furniture and wood elements
in the bathroom.

In 2025 the sector will also be different from today. The only difference with 2015 is that we
do not know exactly what will happen. It is known that a number of developments will have
an effect on the sanitary sector. Think for example of changing consumer behaviour, the
energy transition, the elderly living longer in their own home, the labour shortage in the
construction industry, digitisation and prefab. They will all have an effect on either the
demand or the supply side of the market, and will therefore change the whole market.

The question that this report answers is the following: what will the sanitary sector look like
in 2025 and what does this mean for you? What do you have to do to win in the 2025
market?

“Spetterend Sanitair 2025" is a farewell gift for the sector from the Heating and Sanitary
Foundation. This foundation consists of manufacturers, wholesalers and installers who
have jointly promoted the sale of high-quality sanitary products for more than 25 years.

                                                                                                    The sanitary market is a slow market, but we do see
                                                                                                    changes. The change in recent years has made me focus
                                                                                                    more on an omnichannel approach, even for my relatively
                                                                                                    older target group ”- Director of Sanitary Specialist

                                                                                                                                                      2
Spetterend Sanitair 2025 - Manufacturer report Developments in the sanitary sector
INDEX

                              Introduction
           Market size and outlook of the future
                             Economy
                             Structure
                                  Size
                                Future
                          The customer journey
                            Motivation
            Inspiration and orientation
                             Purchase
                           Installation
                      Trends and developments
                   Luxury and comfort
                     Needs of the 50+
            Online and the showroom
        Sale of complete bathrooms by
                        manufacturers
                                                   3
                               Future scenarios
Spetterend Sanitair 2025 - Manufacturer report Developments in the sanitary sector
BACHGROUND OF THE STUDY
       GOAL OF THE STUDY                                                                    METHODOLOGY

       Providing insight into the sanitary market in all its facets, such as channels,      The results presented in this report have been gathered by using several research
       volumes, trends and their impact, wishes and needs, customer journeys, etc., in a    methods:
       way that every level of the business column can get started with the insights.       • Desk research
                                                                                            • In-depth interviews with industry experts (13)
                                                                                            • Online surveys with consumers (1,060)
                                                                                            • Online surveys with people over 50 (374)
                                                                                            • Telephone surveys with installers (201)
                                                                                            • Telephone surveys with retailers (139)

                                                                                            The purpose of each research method was different. For example, the purpose of
                                                                                            expert interviews was to substantiate the data from desk research and to formulate
                                                                                            the right questions for the quantitative part. The telephone surveys with installers
       TIMELINE
                                                                                            aimed to provide more insight into the size of the market, the installation of sanitary
                                                                                            products, prefab and the energy transition.

                                  In-depth interviews
                                   with professionals

                      Start of the study                                    Start online        Start reporting                          Finalisation report
                                                                            interviews

2019
                 April                       May                      June                  July                       August                     September                       October

                            Start desk                                    Start telephone
                            research                                        interviews
                                                                                                                                                                                      4
Spetterend Sanitair 2025 - Manufacturer report Developments in the sanitary sector
Introduction

Market size and outlook of the future
                            Economy
                            Structure
                                 Size
                               Future
                         The customer journey
                           Motivation
           Inspiration and orientation
                            Purchase
                          Installation
                    Trends and developments
                 Luxury and comfort
                    Needs of the 50+
           Online and the showroom
       Sale of complete bathrooms by
                       manufacturers
                                                  5
                              Future scenarios
Spetterend Sanitair 2025 - Manufacturer report Developments in the sanitary sector
ECONOMIC DEVELOPMENT

The Dutch economy is currently in the final phase of a boom. The CPB has
predicted a growth of 1.8% for 2019, which is lower than the 2.9% in 2017 and
2.6% in 2018. A growth of 1.4% is expected for 2020 (source: CPB). There
                                                                                               CONSUMER INDICATORS
appears to be a negative trend.                                                                Consumer confidence | Economic climate | Favourable time for large purchases

                                                                                                                 50
Consumer indicators also appear to be less positive for 2019. Consumer
confidence has been steadily declining since May 2018. This trend continued in
February and March 2019 and the indicator even turned negative, after a                                          30
slightly positive score in January. In December 2018 the consumer confidence

                                                                                    Average of subquestions
indicator stood at 9 points; and in April of that year it even went to 25.
                                                                                                                 10
Consumers also seem to find the time less favourable for making large
purchases. If this trend continues, it is quite possible that the sanitary market
has reached its peak in terms of sales, and possibly also in terms of turnover.                                  -10

In addition, there are some social developments that are more or less
independent of the state of the economy and thus lay a foundation for the                                        -30
demand for living space (and therefore also for bathrooms). Important
developments are:
                                                                                                                 -50
• family dilution (increasing number of single and double-person households,
   longer independent living of older people);
• The continuing interest in buying a house (instead of renting it);                                             -70
• The growth in the number of new build properties delivered.

                                                                                                              Source: CBS

                                                                                                                                                                              6
Spetterend Sanitair 2025 - Manufacturer report Developments in the sanitary sector
ECONOMIC DEVELOPMENT                                                                                              AVERAGE PRICE OWNER-OCCUPIED HOUSING
                                                                                                                  400000
Since 2013, the housing market has rapidly increased. The demand for housing remains high,
                                                                                                                  350000
while the supply has been at a historically low level for some time now. At the end of 2017, the
provisional high point of the number of homes sold was reached. After this, the number of                         300000

                                                                                                         Euro
home sales fell slightly again in 2018 and 2019.                                                                  250000

                                                                                                                  200000
In recent years, the construction of new homes has increased rapidly, with an average of
around 3.5% per year. However, this is accompanied by substantial growth convulsions. Many                        150000

people left the construction sector during the crisis. This means that the current numbers of                     100000
new builds have to be produced by a considerably smaller number of construction workers. In
                                                                                                                   50000
order to meet the high demand for new homes, the building capacity must approximately
                                                                                                                       0
double. According to the Economisch Instituut voor de Bouw (EIB), there are currently too few
building plans to reduce the housing market shortage in the next five years. Nonetheless,
housing production will have to increase further in the coming years in order to be able to meet
household growth (averaging by 50,000 per year (source: CBS)).
                                                                                                                  NUMBER OF HOUSES SOLD
The Dutch housing market has always been strongly linked to the economy. As house prices                          300000
rise, consumer confidence rises and we tend to spend more. If the economic outlook continues
to deteriorate, partly due to the trade war between the US and China and the Brexit, this may                     250000

have an impact on the housing market. A lower rise in house prices and lower consumer
                                                                                                                  200000
confidence can reinforce each other (in a negative sense) and thus have a negative impact on

                                                                                                         Number
the sanitary market.
                                                                                                                  150000

                                                                                                                  100000

                                                                                                                   50000

                                                                                                                       0
* The estimate of the average selling prices for existing owner-occupied homes and the number of homes
sold is based on figures from ING, Kadaster, BouwKennis, and research from Peels & Dankers, 2017.
                                                                                                                                                         7
Spetterend Sanitair 2025 - Manufacturer report Developments in the sanitary sector
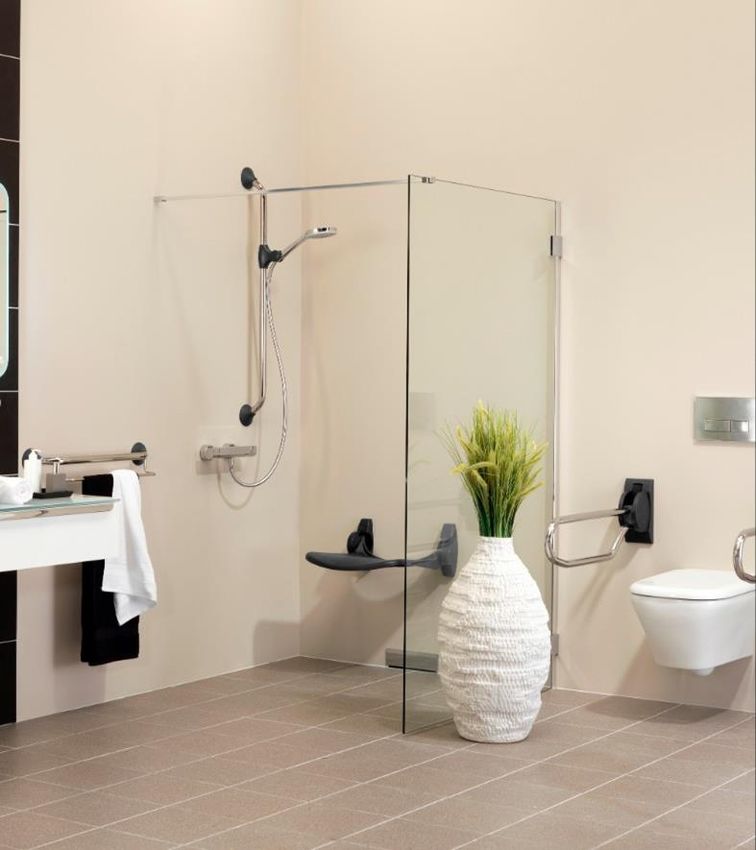
MARKET STRUCTURE AND SIZE
METHOD
The sources used to establish the market structure and market size are both quantitative
and qualitative. On the one hand, qualitative elements were used from insights that
emerged from interviews with parties from different parts of the sanitary sector, and on
the other hand, quantitative data emerged from desk research (e.g. CBS, EIB, KPMG),
online interviews and telephone interviews.

The structure and size of the sanitary sector was determined based on all these sources.
The following steps have been taken:
• Mapping the actors on the market (retail-oriented, installation-oriented and wholesale
  role). The contracting companies are kept outside the market structure and market
  size, because their primary focus is not the sanitary sector.

• Determine the market size. This was done with the help of various (online) sources:
      • USP Sanitary Monitor 2019 – Residential market
      • USP Installer research fpur Heating & Sanitary Foundation June 2019 – Non-
         residential market
      • USP Architectural Barometer – Building volumes
      • BouwKennis – New-build, non-residential revenue, etc
      • USP European Installation Monitor 2018 – Non-residential market
      • CBS – Figures on new-build, number of homes, consumer confidence, etc.
      • DBSC Consulting/ Technische Unie – Role of the showroom holder

In the remainder of this report, the terms residential and non-residential will occur more
frequently. Residential buildings are intended for housing insofar as this is not a collective
residential building with communal facilities. Non-residential buildings are buildings with a
non-residential purpose. This includes buildings with an office, school, health, sports,
trade, hospitality or meeting function or other types of energy-using buildings.

                                                                                                 8
Spetterend Sanitair 2025 - Manufacturer report Developments in the sanitary sector
MARKET STRUCTURE

Sanitary products are supplied to the residential and non-residential market through a            The table below only includes the channels that actually sell to consumers. This means that
wide range of different channels. The different channels can be divided into groups based         the wholesale function is not included in this, but that the wholesalers that deliver directly to
on the organisations' proposition:                                                                the consumer are subdivided into sanitary (and kitchen) specialty shops, tile specialist shops
• Retail-oriented companies                                                                       and installation companies with a showroom. A total of 240 of the 375 (source: CBS) existing
        • This group can again be broken down into specialised retail trade, which                wholesalers have been placed in other groups.
           includes the sanitary (and kitchen) specialty store, the tile specialist store, and
           the parallelised retail trade to which the DIY stores can be counted.
• Companies focused on installation
        • This group consists of installation companies with or without a showroom.
• Companies with a wholesale function
        • The sanitary wholesaler and the builders' merchant can be found in this group.

• On the next page you can see a schematic (simplified) overview of the distribution.                                                                                           SHARE IN THE
                                                                                                  GROUPS WITHIN THE MARKET STRUCTURE                                            MARKET (IN TERMS
                                                                                                                                                                                OF ESTABLISHMENTS)
                                                                                                                                                       Sanitary (and kitchen)
                                                                                                                                                       specialty store
                                                                                                                              Specialised retail                                       590
                                                                                                                                                       Tile specialty stores
                                                                                                  Retail-oriented
                                                                                                                                                       DIY stores                      786
                                                                                                                              Parallelised retail
                                                                                                                                                       Other retail channels           118

                                                                                                                                                       Installation companies
                                                                                                  Installation                                         with showrooms
                                                                                                                                                                                       2,437
                                                                                                                                                       Installation companies
                                                                                                                                                       without showrooms

                                                                                                 Source: USP RESEARCH FPUR HEATING & SANITARY FOUNDATION, JUNE 2019

                                                                                                                                                                                                 9
Spetterend Sanitair 2025 - Manufacturer report Developments in the sanitary sector
MARKET STRUCTURE (EXCL. FOREIGN COUNTRIES)

                                                                            MANUFACTURER/ IMPORTER

                                                                                                                                                BUILDERS’
                                                        SANITARY WHOLESALE
                                                                                                                                                MERCHANT

                           INSTALLATION
                                                    INSTALLATION                                                     PROJECT
   SANITARY                  COMPANY                                 TILE SPECIALTY
                                                   COMPANY WITH                               DIY STORE           INSTALLER (NO           PURE ONLINE               OTHER
SPECIALTY STORE              WITHOUT A                                   STORE
                                                    A SHOWROOM                                                        SALES)
                            SHOWROOM

                                           RESIDENTIAL MARKET                                                              NON-RESIDENTIAL MARKET (PROJECTS)

The sale of sanitary products takes place along a wide diversity of channels. This distribution structure is fairly complex because, in addition to the sales activity when selling sanitary
products, installation activity is often also organised by the supplier. The product itself is a semi-finished product. The diagram is a simplified representation, because there are more
horizontal and vertical relationships between the different parties than shown. Examples of this are manufacturers who sell directly to the residential market and installers who buy
sanitary products at the DIY store or online. These relationships can be seen on the following pages.

                                                                                                                                                                                               10
Source: USP RESEARCH FPUR HEATING & SANITARY FOUNDATION, JUNE 2019
MARKET SIZE 2018

          The total consumption expenditure for sanitary products, including tiles, is estimated
                                                                                                   TURNOVER OF THE SECTOR
          at around 4 billion euros (incl. VAT) for 2018/ 2019. The spending by main categories
          can be seen in the table on the right.
                                                                                                   Total                        3,984 million

          The spending per sector can also be found in the table on the right. Here it is shown
                                                                                                   Turnover sanitary products   2.788 million
          that 2.5 billion can be found in the residential sector, which is approximately one
          billion larger than the non-residential sector.                                          Turnover tiles                360 million

          The sanitary market will experience little growth in the coming years. This is evident   VAT                           836 million
          from the figures of Dutch wholesalers. This is also apparent from the USP Sanitary
          Monitor, which shows a growth of only 1% in the residential market was reported in
          the first half of 2019. This is mainly due to consumer confidence, the economic
          climate and the obstacles to new construction.                                           TURNOVER OF THE SECTOR

                                                                                                   Total                        3,984 million
                GROWTH OF THE SANITARY MARKET
                IN VOLUME                                                                          Residential                  2,482 million

                        7,4%                                                                       Non-residential              1,502 million
                                            6,3%

                                                                 4,0%

                                                                            1,9%

                        2015                2016                2017        2018
                                                                                                                                                11
Source: USP RESEARCH FPUR HEATING & SANITARY FOUNDATION, JUNE 2019
MARKET SIZE 2018

Within the residential and non-residential sector, a distinction can be made between        TURNOVER OF THE SECTOR (2018) (incl.                    PRODUCTS, EXCL
new build and renovation.                                                                   VAT)                                                    INSTALLATION

                                                                                           Residential                                                          2,482 million
Within the residential sector, the renovation market is about four times as large as the
new build market. This is mainly because more bathrooms are being installed in the         New build                                                             495 million
renovation market (267,000) than in the new build market (68,000). The same applies
to toilets. More partial replacements and accessories are also being purchased to          Renovation                                                           1.987 million
replace existing products.

Within the non-residential sector, the renovation market is also about four times as        TURNOVER OF THE SECTOR (2018) (incl.                    PRODUCTS, EXCL
large as the new build market. One of the reasons is that new build has decreased in        VAT)                                                    INSTALLATION
recent years due to, among other things, the shortage of labour. The share of new
                                                                                           Non-residential                                                      1,502 million
build in the non-residential market is likely to increase in the coming years (source:
BouwKennis).
                                                                                           New build                                                             306 million

                                                                                           Renovation                                                           1,196 million

                                                                                           Source: USP RESEARCH FPUR HEATING & SANITARY FOUNDATION, JUNE 2019

                                                                                                                                                                                12
MARKET SIZE 2018 RESIDENTIAL - BATHROOMS

                  New build                Number of bathrooms
                    42,225                       42,225
                                                                         Average value
OWN

                                                                 X                                              € 1,616 million
                                                                             € 6,070
                                           Number of renovated
            Existing housing
                                              bathrooms
                 4,387,000                      224,000
                                                                     Average maintenance
                                                                            value                                 € 268 million                   € 1,968 million
                                                                               € 35
                                           Number of renovated
            Existing housing
                                              bathrooms
                 3,276,000                       42,000
RENT

                                                                         Average value
                                                                 X                                                € 84 million
                                                                             € 1,300
                  New build                Number of bathrooms
                    22,275                       22,275

                                                                     The USP Sanitary Monitor shows that the average bathroom value of a private tenant
                                                                     is approximately € 2,500. The costs of a bathroom that is placed in corporation
                                                                     housing is lower, around € 1,000. This brings the average to € 1,300.
                                                                                                                                                              13
 Bron: USP SANITARY MONITOR, AUGUST 2019
MARKET SIZE 2018 RESIDENTIAL - TOILETS

                  New build                 Number of toilets
                    42,225                       42,225
                                                                         Average value
OWN

                                                                 X                                                  € 418 million
                                                                              € 1,675
                                           Number of renovated
            Existing housing
                                                toilets
                 4,387,000                      207,686
                                                                     Average maintenance
                                                                            value                                    € 38 million                      € 514 million
                                                                                 €5
                                           Number of renovated
            Existing housing
                                                toilets
                 3,276,000                       37,422
RENT

                                                                         Average value
                                                                 X                                                   € 58 million
                                                                               € 964
                  New build                 Number of toilets
                    22,275                       22,275

                                                                     The USP Sanitary Monitor shows that the average toilet value of a private tenant is
                                                                     approximately € 1,030. The costs of a toilet room that is placed in corporation housing
                                                                     is lower, around € 700. This brings the average to € 964.
                                                                                                                                                                  14
 Bron: USP SANITARY MONITOR, AUGUST 2019
MARKET SIZE 2018 RESIDENTIAL

   TURNOVER OF THE SECTOR (2018) (incl.                    PRODUCTS, EXCL                 TURNOVER OF THE SECTOR (2018) (incl.   PRODUCTS, EXCL
   VAT)                                                    INSTALLATION                   VAT)                                   INSTALLATION
  Total                                                              3,984 million
                                                                                          Residential                                   2,482 million

  Residential                                                        2,482 million        New build                                      495 million

  Non-residential                                                    1,502 million        Renovation                                    1,987 million

  On the right-hand side of the page, the turnover of the sanitary sector is split into   Sanitary specialty store                      1,207 million   48.7%
  different channels in a table. This is the turnover viewed from the end customer, in
  this case the consumer. This provides a clear picture of where the consumer             DIY store                                       441 million   17.8%
  spends his sanitary euro. However, it should be noted here that perception of the
                                                                                          Installer (with or without showroom)            401 million   16.2%
  consumer is not always right. For example, it is difficult for many consumers to
  see the difference between the sanitary and installation wholesale, building            Sanitary and Installation wholesale             130 million   5.3%
  materials trade, and the DIY store.
                                                                                          Online                                          108 million   4.4%
  However, this is how the consumer sees the sanitary market.
                                                                                          Other (namely IKEA)                              76 million   3.1%

                                                                                          Tile specialty store                             66 million   2.7%

                                                                                          Building merchant                                52 million   2.1%

Source: USP RESEARCH FPUR HEATING & SANITARY FOUNDATION, JUNE 2019                                                                                              15
MARKET SIZE 2018 NON-RESIDENTIAL

   TURNOVER OF THE SECTOR (2018) (incl.                    PRODUCTS, EXCL             TURNOVER OF THE SECTOR (2018) (incl.   PRODUCTS, EXCL
   VAT)                                                    INSTALLATION               VAT)                                   INSTALLATION

  Total                                                              3,984 million   Non-residentieel                               1,502 million

  Residential                                                        2,482 million   New build                                       306 million

  Non-residential                                                    1,502 million   Renovation                                     1,196 million

   Just as with the residential market, the turnover of the non-residential          Sanitary and Installation wholesale            1,262 million   84%
   market is also divided into the purchasing channels. Again, this is
   reasoned from the end customer, in this case the installer. The                   Building merchant                                 90 million   6%
   assumption is that in the non-residential market (utility) there is
   always an installer present to install the sanitary products.                     Other                                             60 million   4%

                                                                                     Manufacturer                                      45 million   3%
   The turnover distribution has been determined based on the
   installation research carried out on behalf of the Heating & Sanitary             Online                                            45 million   3%
   Foundation. Questions were asked about where the installers work,
   what the turnover is from the projects and whether this is new build or
   renovation.

   The various parties that supply the end customer is determined by
   means of the USP Installation Monitor 2018, in which the purchase
   channels of the installers are queried.

Source: USP RESEARCH FPUR HEATING & SANITARY FOUNDATION, JUNE 2019                                                                                        16
MARKET SIZE 2018 NON-RESIDENTIAL

        TURNOVER OF THE SECTOR                    PRODUCTS, EXCL                     The turnover from the non-residential sector is also split into the subsector. This
        (2018; INCL VAT)                          INSTALLATION                       distribution is based on the installer survey, data from Statistics Netherlands (number
       Non-residential                                        1,502 million          of locations) and data from BouwKennis (turnover per sector).

       New build                                                306 million
                                                                                     This shows that most sanitary facilities can be found in healthcare institutions,
       Renovation                                             1,196 million          business services and hotels / motels. Per subsector there are other reasons for the
                                                                                     relatively high turnover in plumbing. For example, care institutions replace their
                                                                                     sanitary facilities from a hygienic point of view every 5 to 10 years, which means that a
       Healthcare institutions                                  436 million   29%
                                                                                     great deal of sanitary equipment is purchased every year. The turnover within the
       Business services                                        361 million   24%    business services (offices) is mainly because there are simply many offices.
       Hotels/ motels                                           330 million   22%
       Educational institutions                                  90 million    6%
       Retail                                                    90 million    6%
       Government institutions                                   83 million   5,5%
       Leisure (conference rooms, sport,
                                                                 68 million   4,5%
       etc.)
       Restaurants/ cafés                                        45 million    3%

Source: USP RESEARCH FPUR HEATING & SANITARY FOUNDATION, JUNE 2019                                                                                                               17
OUTLOOK 2025
As stated in this chapter, the sanitary market has strong ties with the Dutch economy,       The indicators for the future for the sanitary sector therefore do not look very positive.
consumer confidence and the housing market. To start with the economy, the expectation       This is also reflected in the forecast of revenue growth for the coming years. This
is that growth will decline until 2025. However, the economy will continue to grow at        prediction is based on economic indicators, the housing market, the USP Sanitary
around 1 to 2 percent (source: CPB). Major uncertainties in this prediction are political    Monitor and research among installers. Although this picture may not be very rosy, the
stability (fragmentation of Dutch politics), the rate of growth that is increasingly         net profit is likely to increase faster because the costs decrease. The total costs will
determined by the world economy and the diversity of labour relations. This means that,      fall by 16% (source: Retailinsiders). The transition from offline to online sales means
among other things, temporary employment, payrolling, contracting and self-employed          less demand for retail space. This results in a substantial decrease in accommodation
workers are new types of employment relationships that have been popular in recent           costs due to the increasing pressure on the real estate market to lower the rental
years and fall outside the usual employment contract (source: SER).                          prices. In addition, the other costs have fallen because retailers operate a lot more
                                                                                             efficiently and effectively as a result of extensive automation and optimal use of the
The housing market appears to be the least optimistic, partly driven by the shortage of      available (customer) data. This trend is the result of high price transparency and
labour. The investments in, among other things, new build and renovation are expected to     competition.
stagnate in the coming year and will even slightly decrease in 2020. This year and next
year, a fall to 225,000 and 210,000 homes sold is expected, which is expected to result in       GROWTH (TURNOVER) OF THE SANITARY MARKET
fewer new bathrooms in addition to a lower return tax. The shortage of construction              IN VOLUME
professionals is also throwing a spanner in the works: the number of building permits            7,4%
issued for new houses will remain at or below 70,000 this year - well below the intended
                                                                                                          6,3%
87,000 homes that the government wants to add every year. The shortage also causes
an increase in labour costs in the renovation market, which also has a negative impact.

                                                                                                                  4,0%
Household consumption will continue to be a major driver of the Dutch economy in the
coming years. After years of tax increases and high unemployment, these should become
the years in which Dutch people spend their money: unemployment is set at a record low
                                                                                                                          1,9%                                     1,5% 1,6%
and the government has promised a tax reduction for most households. Consumer
                                                                                                                                  1,0%          0,8% 0,9%
                                                                                                                                                            1,0%      1,2% 1,3%
confidence is therefore relatively high when compared to 2012. But the top has now been                                              0,7%               0,7%   0,8%
                                                                                                                                         0,2%      0,5%
reached. This consumer confidence is a leading indicator of consumer spending. The                                                          0,0%
declining optimism may therefore indicate that Dutch people will spend money less
                                                                                                  2015     2016    2017    2018    2019   2020     2021   2022    2023   2024    2025
enthusiastically in the future.
                                                                                                        Without Nitrogen-emission decision       With the Nitrogen-emission decision

                                                                                                   Source: USP RESEARCH FPUR HEATING & SANITARY FOUNDATION, JUNE 2019
                                                                                                                                                                                        18
OUTLOOK 2025

GROWTH (TURNOVER) OF THE SANITARY MARKET                                                        Assuming that the price of the sanitary products increases by an average of 2% per year,
IN EUROS                                                                                        the growth of the sanitary sector in euros for the coming years can be calculated. This
                                                                                                calculation shows that the market for sanitary products will grow between 2% and 4% in
                                                                                                the coming years. However, in all likelihood the costs for the products will also increase
                                                                                                (due to, among other things, inflation).

                                                                                                The figure also shows the revenue growth including the nitrogen-emission decision. This is
                                                                  3,5% 3,2%         3,6% 3,3%
                  2,8% 2,5%       2,9% 2,7%      3,0% 2,8%                                      based on what is now known (October 2019). You can find more about this on the
  2,2% 2,0%
                                                                                                following pages.

     2020            2021            2022           2023              2024            2025

                  Zonder de stikstofuitspraak      Inclusief de stikstofuitspraak

 Source: USP RESEARCH FPUR HEATING & SANITARY FOUNDATION, JUNE 2019

                                                                                                                                                                                             19
OUTLOOK 2025
          THE NITROGEN-EMISSION DECISION AND THE EFFECT ON THE SANITARY SECTOR

          In the past two months, a rather heated discussion about nitrogen emissions has been going on in Dutch media, politics and society at large. At the end of May, the Dutch Council of
          State ruled that the policy to reduce the emission of nitrogen that had been in effect since 2015, was failing and was not matching European regulations. These regulations
          determine the allowed levels of nitrogen emission near protected natural areas, the so called Natura 2000 areas. Because the policy did not help to reduce nitrogen emissions to the
          allowed levels, it was abruptly cancelled. This development has major consequences for the Dutch construction industry, since many permits for construction projects that were
          based on this policy were withdrawn. A large number of construction projects, with estimations up to 18.000 construction projects are now at risk of being delayed and possibly
          cancelled altogether, depending on new policy and legislation. The problem is so serious that politicians and media are even speaking of a lockdown of the construction industry.

          In the Architectural Barometer Q3 2019 research of USP a number of questions have been added regarding the nitrogen-emission decision. The results show that the impact of the
          focus on nitrogen emissions on the construction market is mainly felt in the Netherlands, making it a Dutch problem for now.

          EFFECT DECISION ON THE BUILDING PROJECTS                                                 EFFECT DECISION ON THE BUILDING PROJECTS
          Do you expect that current focus on nitrogen emissions will have a                        For which type of projects do you expect this influence to be strongest?
          strong effect on the number of postponed and cancelled projects?                          [% of architects]
          [% of architects]

                                                           EU average      Netherlands                                                            Netherlands

           (Very) large effect                                       6%           30%               Residential                                           38%

           Some effect                                               12%          11%               Non-residential                                       31%

           Little to no effect                                       82%          59%               Infrastructural                                       12%
          Source: USP ARCHITECTURAL BAROMETER, SEPTEMBER 2019
                                                                                                    Don’t know                                            19%
                                                                                                    Source: USP ARCHITECTURAL BAROMETER, SEPTEMBER 2019

          It is quite clear that Dutch architects are substantially more worried than their European colleagues about the effect the current focus on nitrogen emissions will have on the
          construction market. As to why this is such an apparent problem in the Netherlands and not so much in other European countries, several reasons can be found. These can be found
          on the next page.

                                                                                                                                                                                                 20
Source: USP RESEARCH FPUR HEATING & SANITARY FOUNDATION, JUNE 2019
OUTLOOK 2025
          THE NITROGEN-EMISSION DECISION AND THE EFFECT ON THE
          SANITARY SECTOR
          First of all, the Netherlands has one of the highest relative nitrogen emission levels of   THE EFFECT ON THE SANITARY SECTOR WILL BE SMALL
          all European countries. Additionally, the Netherlands is a very small country that
          counts 160 Natura 2000 areas of which 117 are endangered by nitrogen levels.                Based on the previous page and the left-hand column on this page, the idea may
          Furthermore the Netherlands uses a very strict approach of EU legislation. EU               arise that the nitrogen decision leads to a nitrogen crisis in Dutch construction.
          legislation determines that projects can not have a significant effect on nature, but it    However, it can also be said that the construction sector, and with it the sanitary
          leaves the definition of significant open. Dutch legislation interprets these EU            sector, are talking themselves into a crisis.
          regulations very strict, and more strict than for example Germany.
                                                                                                      One of the reasons why the nitrogen decision has less influence on the construction
          This leads to the chance that a construction project is near one of the endangered          sector than currently is being claimed is that the renovation is highly license-free.
          Natura 2000 areas and that a project has a significant effect on nature is relatively       These renovation projects therefore have nothing to do with the nitrogen statement.
          high in the Netherlands, which has led to the situation of many construction projects       This is good news for the sanitary market, because the renovation market is one of
          being at risk of postponement or even cancellation. Meanwhile, the shortage of              the main markets for sanitary products.
          residences in the Netherlands adds to the problem. Most of the Dutch architects who
          expect the focus on nitrogen emissions to strongly affect construction projects, mainly     Corporations also have little or no trouble with the nitrogen decision, mainly because
          expect problems in the new build residential sector.                                        they build within the cities. As a result, their construction projects are not in the
                                                                                                      vicinity of the Natura 2000 areas and are therefore not affected by the nitrogen
          It is clear that problems regarding nitrogen emissions are mainly a Dutch problem           decision. This also applies to other building projects that are build within cities.
          due to strict regulations and a dense population. The number of Natura 2000 areas in
          other countries might as well lead up to a slowdown in construction in other countries      The permits for small contractors and freelancers are also exempted from the
          if legislation will be interpreted as strict as in the Netherlands.                         nitrogen ruling. They can therefore continue to build.

                                                                                                      In addition, the government is introducing a new calculation method that should make
                                                                                                      it possible to grant permits for small projects. Projects that can prove using the new
                                                                                                      method that they do not affect nature are eligible for a permit. Starting September 16,
                                                                                                      people can use the new calculation tool, says agriculture minister Carola Schouten.

                                                                                                      In short, the sanitary sector should thus not talk itself into the crisis.

                                                                                                                                                                                                21
Source: USP RESEARCH FPUR HEATING & SANITARY FOUNDATION, JUNE 2019
OUTLOOK 2025
          OTHER FACTORS
          The sanitary market is moving. These are no revolutionary shifts, but nevertheless clear
          shifts that have been visible since 2000 for consumers, retailers, wholesalers and
          installers.

          For all parts of the sanitary column it is essential to orientate for the future and to make
          clear choices. It is of strategic importance to choose a position and then fill it in optimally.
          Consumers are increasingly asking for a transparent and professional partner to do
          business with. Companies that clearly present themselves to the consumer are
          recognisable for that consumer and can assure themselves of a commercially interesting
          future. There are plenty of opportunities in the market, for example active processing of
          the market for rental properties (with a customised product) or by responding to the trend
          towards beautification. These opportunities must be optimally utilised through clear
          choices in business operations.

          Sustainability also offers market opportunities for the sanitary market. The high quality
          and environmental requirements of the Netherlands and Europe were previously seen as
          a disadvantage. Now it is an advantage: consumers have more confidence in European,
          and therefore Dutch, products. A circular economy also seems to fit well with the
          Netherlands. The Netherlands is at the forefront of recycling: 79% of waste is recycled.

                                                                                                             22
Source: USP RESEARCH FPUR HEATING & SANITARY FOUNDATION, JUNE 2019
Introduction
   Market size and outlook of the future
                     Economy
                     Structure
                          Size
                        Future

         The customer journey
                    Motivation
    Inspiration and orientation
                     Purchase
                   Installation
              Trends and developments
           Luxury and comfort
             Needs of the 50+
    Online and the showroom
Sale of complete bathrooms by
                manufacturers
                                           23
                       Future scenarios
THE CUSTOMER JOURNEY IN THE RESIDENTIAL MARKET
                                                                                               THE FUNNEL MODEL
The customer journey is globally the "journey" that a customer makes when he or she
goes to buy a product. This starts with the orientation but also continues until (far) after                        Familiarity
the purchase. It is important to map out the customer journey, because if you know which
phases your customers go through, what they feel and what they need at different times,
                                                                                                                        Trust
you can respond to that.

The traditional description of the buying process has traditionally been in the form of a
                                                                                                                   Consideration
funnel, from fame to loyalty: consumers start with a set of eligible brands and reduce this
number to eventually make a purchase. However, this approach no longer works fully in
the present time. Particularly due to an increase in the number of digital contact
                                                                                                                     Purchase
moments, the number of brands does not decrease, but often increases. In addition,
there are also more and more private label products for sale. The communication during
contact moments is also much less one-way traffic from provider to consumer, but is
                                                                                                                       Loyalty                     Source: USP
initiated or controlled by the consumer.

The customer journey also differs per product type. For products with a low level of           THE ACCELERATED CUSTOMER JOURNEY MODEL
customer involvement, the customer journey is very fast. These are products you do not
usually think about, such as various accessories in the bathroom. For products with a                 START        Familiarity
high involvement, such as a complete bathroom, other phases of the customer journey                    HERE                          Trust
are important. With this type of product, consumers usually spend more time in the
orientation and assessment phases.
                                                                                                                       Evaluation       Consideration
In other words: for each product the customer journey and the length of the phases are
different. In this chapter we focus primarily on the customer journey of the complete
bathroom. For more information about this you can go to the additional reports.                        Usage &
                                                                                                                                        Purchase
                                                                                                      Experience

                                                                                                                      Installation                 Source: MCKINSEY

                                                                                                                                                                      24
For more information about the customer journey, see the "Customer journey" report
THE MOTIVATION
          MOTIVATION NEWLY PLACED BATHROOM                                                            CHANGE IN LIVING CONDITIONS - TOP 5
          What are the main reasons that a new bathroom has been installed?                           Has the bathroom been purchased in response to a certain change in your living
          [% consumers who have purchased and installed a bathroom]                                   conditions? [% consumers who have purchased and installed a bathroom]
           MOTIVATION                                                                  TOTAL          Verhuizing naarinto
                                                                                                             Moving   eenanieuw huis
                                                                                                                           new home                        32%
           Aesthetics                                                                   93%
                                                                                                        Aanpassing voor veroudering
                                                                                                                Adaptations to aging              16%
           Comfort                                                                      54%
                                                                                                                            EenAbaby
                                                                                                                                 baby       5%
           Maintenance                                                                  57%
           Changing or creating a new room                                              28%                 Lichamelijke beperkingen
                                                                                                                  Physical limitations     4%
           Sustainability                                                               16%
                                                                                                                             Pension
                                                                                                                            Pensioen      2%
                            Om het mooier
                            To make it moretebeautiful
                                              maken                                            45%              No specific
                                                                                                         Geen specifieke     changes
                                                                                                                         verandering                        34%
                           Verhogen van het comfort
                                    Improve  comfort                                          41%
                            (Noodzakelijk) onderhoud
                             (Necessary) maintenance                                    32%
                                                                                                     The motivation phase in the customer journey is the phase in which (potential)
         Verbetering van het uiterlijk
                      Improve the look van
                                         of mijn huis
                                            my home                               25%
                                                                                                     buyers realise that they have a problem or challenge, or that they would like
                   Wijzigen
         Change existing    de to
                         space bestaande
                                  be more ruimte
                                          flexible                               23%                 something.
             Verhogen van dethe
                   Increase  waarde
                                valuevan  hethome
                                      of the  huis                               22%
                                                                                                     The majority of bathrooms are purchased in response to a certain change in
        Problemen oplossen
                Solve issuesmet schimmel
                             around      / vocht
                                    mould/  damp                           14%
                                                                                                     living conditions, such as a relocation. These changes often lead to investments
                                    Schade herstellen
                                       Repair damage                   11%
                                                                                                     in a house such as a bathroom.
                Om de sustainability
           To increase duurzaamheid  ofte verhogen
                                        the property                  8%                             However, in about a third of cases, the bathroom is purchased without a specific
                        Besparen van energiekosten
                                  Save energy costs                   8%                             change in living conditions.

                    Additional Om  mijzelfintemy
                               bathroom       wassen
                                                 home                 7%
                                                                                                     Reasons to buy a new bathroom and to install it (mainly) have to do with
                         Extra badkamer
                           To create     in mijnspace
                                     additional  huis             5%
                                                                                                     aesthetics and comfort. It must look beautiful especially.
             Verhogen van de natuurlijke
                      Increase           lichtinval
                               natural light  levels              4%
                                                  Anders
                                                    Other             9%
                                          Don’t
                              Weet niet/geen    know
                                             mening            1%
                                                                                                                                                                                        25
Source: USP CONSUMER RESEARCH FPUR HEATING & SANITARY FOUNDATION, JUNE 2019
THE INSPIRATION AND ORIENTATION

  INSPIRATION                                                                                 ORIENTATION
  How did you find inspiration for your bathroom?                                             How did you collect further information about the bathroom?
  [% consumers who have purchased and installed a bathroom]                                   [% consumers who have purchased and installed a bathroom]

  % ONLINE                    % BOTH                                                           % ONLINE                   % BOTH                                           % OFFLINE
                                                                              % OFFLINE

    29%                        55%                                             16%              30%                         56%                                             13%

   ONLINE INSPIRATION AND INFORMATION - TYPE OF PAGES                                         OFFLINE INSPIRATION AND INFORMATION
   What type of pages have you visited?                                                       How did you do this?
   [% consumers who have purchased and installed a bathroom]                                  [% consumers who have purchased and installed a bathroom]

        Sanitary
         Sanitairspecialty store
                  speciaalzaak                                                53%                            Winkelbezoek
                                                                                                                 Store visit                              66%

                        DIY store
                      Bouwmarkt                                37%                                  Verkoper ininde
                                                                                          Sales representative      winkel
                                                                                                                  the store                           60%

                          Product
                          Product                              35%                                      Brochures/ folders
                                                                                                                Brochures                       41%

                            Brand
                            Merk                         24%                                                   Professional
                                                                                                               Professional              21%

                    Manufacturer
                      Fabrikant                    16%
                                                                                                               Tijdschriften
                                                                                                                 Magazines              16%
                    Professional
                    Professional                12%
                                                                                                            Tv-programma
                                                                                                                  TV-show               16%
                           Anders
                            Other             8%
                                                                                                                     Anders
                                                                                                                       Other       4%
                    Don’t
        Weet niet/geen    know
                       mening               7%
                                                                                                            Weet niet/geen
                                                                                                               Don’t know
                                                                                                              mening
                                                                                                                                   2%
Source: USP CONSUMER RESEARCH FPUR HEATING & SANITARY FOUNDATION, JUNE 2019                  Source: USP CONSUMER RESEARCH FPUR HEATING & SANITARY FOUNDATION, JUNE 2019

                                                                                                                                                                                       26
THE PURCHASE

          PURCHASE OF BATHROOM                                                                                               The actual money is earned in the purchase phase when the potential customer
          In what type of store was the bathroom purchased?                                                                  becomes a real customer. But to get a potential customer to spend his money
          [% consumers who have purchased and installed a bathroom]
                                                                                                                             on your products, he must know the product and the product must meet certain
                                 58%                                  59%                                                    requirements.
                                                                                             59%   Only one store
            57%                                    55%
                                                                                                                             Currently, almost 60 percent of the complete bathrooms are purchased at one
                                                                                                                             point of sale, which in most cases is the bathroom (and kitchen) specialty store.
                                                   45%                                                                       15 percent of the bathrooms are purchased at the DIY store. This picture is
            43%                 42%                                    41%                                                   different when a bathroom is purchased at several points of purchase. In that
                                                                                             41%   Multiple stores
                                                                                                                             case, the DIY store has a much larger share.

                                                                                                                             Only a small part of the bathrooms are currently being purchased abroad (4%;
                                                                                                                             not shown in the table).
                2015             2016              2017               2018              2019

                                                                                                                             The main reasons for buying a bathroom at a certain point of purchase are the
        PURCHASED AT ONE STORES                                             PURCHASED AT MULTIPLE STORES                     price, the quality of the products and the service. However, there are
        [% bathroombuyers]                                                  [% bathroombuyers]
                                                                                                                             differences per purchasing channel. For example, the price is mainly important
                                                              2018-                                                  2018-
         PURCHASE PLACE                                                      PURCHASE PLACE                                  at the DIY store, wholesaler and online, and the service (different options/
                                                               2019                                                   2019
                                                                                                                             layout/ design) is more often decisive at the sanitary specialty stores and the
         Bathroom (and kitchen) specialty store                 63%         Bathroom (and kitchen) specialty store    54%    installers with showroom. The installation is also a decisive reason for
         DIY store                                              15%         DIY store                                 48%    consumers to buy a bathroom from the installer.
         Installer with a showroom                               8%         Tile specialty store                      32%
         Wholesale                                               4%         Online                                    22%    These reasons are also endorsed by the retailers who participated in the study.
         Ikea                                                    3%         Ikea                                      16%    However, they still add warranty as an important aspect of the purchase. They
                                                                                                                             also indicate that especially the quality of the products has become more
         Installer without a showroom                            3%         Builders’ merchant                        15%
                                                                                                                             important in recent years. Comfort/ luxury items and maintenance have also
         Builders’ merchant                                      3%         Installer with a showroom                  8%
                                                                                                                             become more important, while the brand and origin of the products have
         Online                                                  1%         Installer without a showroom               6%    become less important.
                                                                            Wholesale                                  6%
                                                                                                                                                                                                           27
Source: USP SANITARY MONITOR, AUGUST 2019
THE PURCHASE

          REASON FOR PURCHASE POINT                                                                 A number of different stores are usually visited before a definitive choice is made.
          You indicate that you have purchased the bathroom at your point of purchase. What         Expert estimates indicate that on average 3 - 5 showrooms are visited before a point
          is the reason for this?                                                                   of purchase is chosen.
          [% consumers who have purchased and installed a bathroom / toilet room]

                                    De price
                                   The prijs                                                  53%   The main reason to buy a bathroom at a certain point of purchase is the price.
                                                                                                    Because of the internet and the resulting price transparency, the price becomes a
         De kwaliteit vanofde
            The quality       producten
                            the products                                                38%
                                                                                                    more important part of the sales conversations. Comparable products can often be
                                De service
                                The service                                            36%          obtained for a cheaper price. For specialists, this means that they must be well aware
                                                                                                    of their added value and must also ‘sell’ it to the consumer.
                            De showroom
                            The showroom                                         27%
                                                                                                    Other important aspects are the quality of the products and the service. However,
                            The
                              Deguarantee
                                 garantie                                  22%
                                                                                                    there are differences per purchasing channel. For example, the price is mainly
                            The
                              Deinstallation
                                 plaatsing                            18%                           important at the DIY store, wholesaler and online, and the service (different options/
                                                                                                    layout/ design) is more often decisive at the bathroom specialist shops and the
              The sales representatives
                          De verkopers                             15%                              installer with showroom. The installation is also a decisive reason for consumers

                         The after-service
                              De nazorg                       10%

                                Themerken
                                De  brands                 8%

                                                                                                                                                                                         28
Source: USP CONSUMER RESEARCH FPUR HEATING & SANITARY FOUNDATION, JUNE 2019
THE PURCHASE – PURCHASE CHANNELS
SPECIALTY STORES WITH A SHOWROOM                                                                  INSTALLERS WITHOUT SHOWROOM
The specialist shops with a showroom (sanitary specialist shops, installation                     After a number of relatively calm years during the crisis, the order portfolios of installation
companies with a showroom and tile specialist shops) are in 63%, 8%, and 0% of                    companies clearly increased in 2018. Although the order portfolio decreased again in the
the cases respectively the purchase points for a complete bathroom if it is                       first half of 2019, many (smaller, medium-sized) installation companies still focus on
purchased at one store. When a bathroom is purchased at multiple purchase                         installation and sale of (sanitary) products to others (e.g. the showroom of the wholesaler).
points, the tile trade is involved in 32% of purchases. All these types are, in the
eyes of the consumer, specialist shops where high-quality sanitary products are                   Sales by installers without a showroom will also come under further pressure in the coming
purchased and installed.                                                                          years. The number of installers will decrease in the coming years (aging, insufficient inflow
                                                                                                  of skilled personnel), which will put pressure on the prices of the installers. The influx of
Consumers buy at specialty shops with a showroom because the showroom is                          foreign (Polish) employees will not be sufficient to compensate for the loss of capacity.
known in the consumer's environment. They are often distinguished by a high-
quality showroom, a high-quality range (top brands), good advice and knowledge                    In response, manufacturers will innovate with new products in the coming years, which will
and a good installation service.                                                                  greatly shorten the installation time of a bathroom. The consequence of this is that fewer
                                                                                                  structural problems arise with the processing of sold bathrooms.
It is becoming ever more necessary for companies of this kind to professionalise
and thus better arm themselves against developments in consumer behaviour                         The number of freelancers will most likely continue to grow, partly due to the shortage of
(increasing online orientation) and competition. Among other things, this leads to a              professionals. One of the reasons is that there is plenty of work for them to do. The
showroom of sufficient scale to serve the consumer in an inspiring environment.                   freelancers primarily focus on installing or building products/ bathrooms and will have little
Furthermore, these companies must profile themselves more actively in the                         influence on the sales of products.
environment, so that consumers can continue to find their way to the showroom.
Given the large investments that such changes entail, there will be fewer
specialists in the coming years. The companies that remain will generally become                      ORDER PORTFOLIO
larger and work in a larger region                                                                    How large is your current order portfolio? [% of installers]
                                                                                                  9
                                                                                                  8
                                                                                                  7

                                                                                       (MONTHS)
                                                                                                  6                                                                                     5,8
                                                                                                  5                                                                                     5,1
                                                                                                  4
                                                                                                  3
                                                                                                  2
                                                                                                  1
                                                                                                  0
                                                                                                       Q2 Q3 Q4 Q1 Q2 Q3 Q4 Q1 Q2 Q3 Q4 Q1 Q2 Q3 Q4' Q1 Q2 Q3 Q4 Q1 Q2                              29
                                                                                                       '14 '14 '14 '15 '15 '15 '15 '16 '16 '16 '16 '17 '17 '17 17 '18 '18 '18 '18 '19 '19
THE PURCHASE – PURCHASE CHANNELS
DIY STORES                                                                                         SANITARY WHOLESALE

Sanitary is an important product group for the DIY stores. In 2018, approximately 11% of           Wholesalers operate in a very competitive market. The boundaries within the sector, and
the total turnover in DIY stores was realised by the sanitary product group. In 2019 (up to        between wholesalers and other sectors are becoming increasingly blurred, possibly due to
and including July) the share is 10.6%. This share is mainly achieved through smaller              technological developments including the internet. Competition comes from many sides
sanitary products, such as shower heads and accessories. Larger, and often more                    including:
expensive, sanitary products are purchased more often at the specialised stores.
                                                                                                   • Existing wholesalers in the same product category
In general, it is expected that the sanitary range of the DIY stores will become more              • Wholesalers in other product categories that expand their range, for example an
luxurious in the coming years. Products with an extra (design) value are added and a                 electrical wholesaler that will also sell sanitary products
limited number of brands are used. It is clear that there is a price ceiling for the consumer of   • Producers who start selling directly to companies and thereby circumvent the wholesale
the DIY stores. Above this ceiling, people no longer take the risk of installing the products        trade
themselves. The sanitary products sold in the construction market currently mainly concern         • Business customers who purchase directly from producers/ brand owners
individual items replacing existing parts.
                                                                                                   In order to respond to competition and pressure on margins, wholesalers must work on two
In addition, the construction market is increasingly used by freelancers as the purchasing         things. First, they must provide more added value, for example by:
channel for sanitary products. A number of DIY store chains (e.g. Hornbach) have already           • Offering knowledge about products, suppliers and application possibilities
opened a special counter for self-employed professionals.                                          • Helping customers and suppliers to reduce costs, for example by ensuring more efficient
                                                             NUMBER OF STORES                         purchasing or lower inventories
                                 NUMBER OF DIY STORES                                              • Relieving customers and suppliers by taking over tasks
                                                                   2018
                                 Praxis (Maxeda)                       176
                                 Hubo (DGN)                            169                         Secondly, they must strengthen their position in the value chain, for example by:
Source: DAHNE VERLAG GMBH 2019

                                 Gamma (Intergamma)                    165                         • Scale increase
                                 Karwei (Intergamma)                   130                         • Broadening of assortment
                                 Independent members (DGN)             68                          • Adding services to products
                                 Multimate (DGN)                       48                          • Forward and/ or backward integration
                                 Formido (Maxeda)                      42
                                 Kluswijs                              32
                                 Hornbach                              14
                                 IBW                                    5                                                                                                              30

                                 Bauhaus                                3
THE PURCHASE
                                                                                                       ADDED VALUE SHOWROOM ACCORDING TO CONSUMERS
ROLE OF THE SHOWROOM                                                                                   What are the most important added values of a showroom of, for example, a
                                                                                                       sanitary specialty store?
The showroom is under pressure due to the increased competition from web shops that sell               [% consumers who have purchased and installed a bathroom / toilet room]
sanitary products, such as soak.nl and badkamerwinkel.nl. Nevertheless, the number of
                                                                                                                  Be able tokunnen
                                                                                                                 Inspiratie  gain inspiration
                                                                                                                                    opdoen                                                    66%
‘retailers’ is also increasing. This refers to retail chains that are fully focused on the sale of
bathrooms and present themselves as the point of sale for sanitary products with a large                     Verschillende producten
                                                                                                                     See different    zien
                                                                                                                                   products                                                  61%
number of sales-promoting activities. There are various formulas such as Sanidump (with a
                                                                                                                Expertise van de verkoper
                                                                                                                          Seller's expertise                                     38%
price-aggressive image) and Brugman (strong brand recognition, partly due to a
combination with kitchens).                                                                                     Kwaliteit vanof
                                                                                                                    Quality   dethe
                                                                                                                                  producten
                                                                                                                                    products                                     36%

                                                                                                                Prijzen Can
                                                                                                                        kunnen vergelijken
                                                                                                                            compare prices                                       36%
The reason that the number of showrooms is increasing is on the one hand because online
sellers will also open showrooms (Maxaro, Badkamerwinkel.nl), and on the other hand                    Verschillende
                                                                                                             Differentmerken
                                                                                                                       brandsonder
                                                                                                                              under11dak
                                                                                                                                      roof                                  33%
because entrepreneurs know that consumers see the added value of a showroom. This                                                Een dagje
                                                                                                                                     A day uit
                                                                                                                                           out              10%
added value ensures customers visiting and buying from the showroom, even when online
                                                                                                     Showroom heeft has
                                                                                                         Showroom   geennomeerwaarde
                                                                                                                           added value                1%
buying might be easier. The added value of a showroom is mainly the possibility of gaining
                                                                                                     Source: USP CONSUMER RESEARCH FPUR HEATING & SANITARY FOUNDATION, JUNE 2019
inspiration and seeing different products. Based on this, a showroom should be an
‘inspiration center’.
                                                                                                     FUTURE OF THE SHOWROOM ACCORDING TO THE DETAILS
The retailers also indicated that a showroom will continue to exist because it meets the             In 5 to 10 years, will the importance of a sanitary showroom increase or
                                                                                                     decrease? [% of retailers]
needs of customers, helps customers in making decisions, and gives them the opportunity
                                                                                                                                      Increase
                                                                                                                                    Toenemen                                           41%
to see the sanitary products.

                                                                                                                               Gelijk
                                                                                                                            Remain theblijven
                                                                                                                                        same                                       35%

                                                                                                                                      Afnemen
                                                                                                                                      Decrease                           24%

                                                                                                     Source: USP RETAILER RESEARCH FPUR HEATING & SANITARY FOUNDATION, JUNE 2019

                                                                                                                                                                                                    31
THE INSTALLATION
          33% OF CONSUMERS HAVE INSTALLED THE BATHROOM
          THEMSELVES AND THIS SHARE WILL DECREASE IN THE                                                   Consumers often want to be helped from start to finish and would prefer to
                                                                                                           leave the renovation of a bathroom to another party. However, the higher
          NEXT YEARS
                                                                                                           price tag attached to this service is an obstacle. An average renovation of
          INSTALLATION OF THE BATHROOM                                                                     the bathroom easily takes 100 hours of installation work (2 to 3 weeks).
          Who installed the bathroom?                                                                      This means € 4.000 to € 6.000. However, this will increase in the future.
          [% consumers who have purchased and installed a bathroom / toilet room]
                                                                                                           Professionals are already scarce and in the near future they will only
                                                                                                           become harder to find.
                                                                                    63%       66%   DIFM
        62%                         59%                                                                    By installing the bathroom yourself you can save on installation. However,
                                                           57%
                                                                                                           there are also disadvantages to installing it yourself:
                                                                                                           • Waste that needs to be cleaned up
                                                           43%                                             • Uncertainties: what do you encounter?
                                     41%
                                                                                    37%                    • Little support from others
        38%                                                                                                • Knowledge level of the do-it-yourselfer
                                                                                              34%   DIY

                                                                                                           The shift from Do-It-Yourself (DIY) to Do-It-For-Me (DIFM) is a trend that
                                                                                                           was expected due to the expected impact of Europe's aging population.
                                                                                                           Although older generations have more DIY experience, age influences
                                                                                                           their ability to do work themselves, leading to more outsourcing. In the
                                                                                                           meantime, the younger generation is less experienced and therefore tends
                                                                                                           more towards DIFM. They prefer to spend their time on other activities,
             2015                   2016                    2017                    2018   2019            although they have less income to outsource DIY jobs. More DIFM means
                                                                                                           more involved professionals, which causes problems for DIY matters. That
                                                                                                           is why DIY retailers try to attract professionals as customers or offer
                                                                                                           installation services to consumers.

                                                                                                                                                                                    32
Source: USP SANITARY MONITOR, AUGUST 2019
THE INSTALLATION
           PROFESSIONAL
           Who arranged the professional for the bathroom placement?
                                                                                            In approximately one third of the bathroom placements, the professional is arranged by
           [% consumers who have purchased and installed a bathroom / toilet room]          the point of sale. However, this share differs considerably per purchasing channel. For
                                                                                            example, in the specialised retail trade (sanitary specialty store/ installers with
           % ME/ PARTNER                                                 % POINT OF SALES
                                                                                            showroom), about three-quarters of the bathrooms sold are also installed under the
                                                                                            direction of the company itself (own installers or installers hired by the company).
             62%                                                          38%

                                                                                            For retailers who offer installation as a separate, extra product (installation here is
                                                                                            primarily a service and not a main activity), this percentage is significantly lower,
                                                                                            because installation is not offered directly in the price.
                            PROFESSIONAL
                            Which professionals did you hire?
                                                                                            For products purchased in the DIY store, the consumer usually arranges the
            Contractor
            Aannemer                                                                 40%    installation themselves. This is because it often concerns a replacement of existing
                                                                                            products.
              Plumber
            Loodgieter                                                     35%

                  Tiler
           Tegelzetter                                                   33%                The demand for installation and assembly will increase in the future. Many installers
                                                                                            have also realised this and the number of self-employed persons without employees in
            Handyman
            Klusbedrijf                                              30%
                                                                                            the Netherlands has grown considerably (scarcity offers opportunities). Currently,
            Stukadoor
             Plasterer                                19%                                   around 60-65 percent of the HVAC-installers are self-employed (source: CBS).
                                                                                            Sanitary retailers and installation companies will increasingly engage self-employed
            Elektricien
            Electrician                              18%                                    professionals to meet consumer demand. In addition, this group will certainly also
                                                                                            install its own bathrooms, for which the products are usually purchased at builders'
          Timmerman
            Carpenter                      10%
                                                                                            stores (including Bouwmaat). DIY stores are actively promoting the sale of building
                Anders
                 Other                6%                                                    materials (including sanitary products) to self-employed workers. Hornbach, for
                                                                                            example, has opened a special collection counter for freelancers and contractors.

                                                                                                                                                                                      33
Source: USP SANITARY MONITOR, 2019
Introduction
   Market size and outlook of the future
                     Economy
                     Structure
                          Size
                        Future
                  The customer journey
                    Motivation
    Inspiration and orientation
                     Purchase
                   Installation

    Trends and developments
           Luxury and comfort
             Needs of the 50+
                                           In this report four trends are discussed that are relevant to the
    Online and the showroom                wholesaler. Of course other trends also influence the work of the
                                           wholesaler. These trends can be found in the trend report and
Sale of complete bathrooms by              on the website.
                manufacturers
                                                                                                               34
                       Future scenarios
LUXURY AND COMFORT

  Luxury and comfort are becoming increasingly important in the bathrooms of
  consumers. For example, they increasingly opt for rain showers and floor heating.
  Walk-in showers are also purchased more often. The advantage here is that
  these showers are also suitable for the time when people are less mobile. Some
  describe a comfort bathroom as a bathroom that is suitable for the future. In
  summary, luxury bathrooms with more comfort are increasingly being bought.

                                                                                                      35
For more information about luxury and comfort, see the report "Developments in the sanitary sector"
LUXURY AND COMFORT

                                                                                             Wellness is a popular trend among consumers. Wellness means the following:
     REASONS FOR A NEW BATHROOM                                                              feeling good through optimal care, enjoying beneficial moments, relaxing indoors
     What are the main reasons that a new bathroom has been installed?
                                                                                             or outdoors.
                       Om het mooier
                       To make it moretebeautiful
                                         maken                                         45%   There have also been trends in the sanitary market in recent years, which are
                     Verhogen van het comfort
                              Improve  comfort                                        41%    related to the strong desire for wellness. This is mainly reflected in the range and
                      (Noodzakelijk) onderhoud
                       (Necessary) maintenance                                  32%          the enormous sale of whirlpools and showers in all sorts and variants. This
                                                                                             includes steam showers, rain showers, massage showers or combinations of
    Verbetering van het uiterlijk
                 Improve the look van
                                    of mijn huis
                                       my home                            25%
                                                                                             these functions.
              Wijzigen
    Change existing    de to
                    space bestaande
                             be more ruimte
                                     flexible                           23%
                                                                                             In addition, sustainability also plays a role in the comfort level of the bathroom. If
        Verhogen van dethe
              Increase  waarde
                           valuevan  hethome
                                 of the  huis                           22%
                                                                                             the house, and therefore the bathroom, is provided with extra insulation, this
   Problemen oplossen
           Solve issuesmet schimmel
                        around      / vocht
                               mould/  damp                       14%                        naturally results in energy savings and a lower energy bill. But they also get
                              Schade herstellen
                                 Repair damage                 11%                           much more comfort and the house is worth more.
           Om de sustainability
      To increase duurzaamheid  ofte verhogen
                                   the property              8%
                  Besparen van energiekosten
                            Save energy costs                8%                              CONSIDERABILITY SUSTAINABILITY
               Additional Om  mijzelfintemy
                          bathroom       wassen
                                            home            7%                               When buying a bathroom or products for this, what is more crucial when
                                                                                             purchasing?
                   Extra badkamer
                     To create     in mijnspace
                               additional  huis           5%
                                                                                             % SUSTAINABILITY                    % COMFORT
        Verhogen van de natuurlijke
                 Increase           lichtinval
                          natural light  levels           4%
                                                                                              43%                                  57%
                                           Anders
                                             Other           9%
                                                                                             Source: USP SANITARY MONITOR, AUGUST 2019
                                    Don’t
                        Weet niet/geen    know
                                       mening          1%

Source: USP CONSUMER RESEARCH FPUR HEATING & SANITARY FOUNDATION, JUNE 2019                                                                                                           36
BATH TYPE
 LUXURY AND COMFORT – THE CONSUMER                                                                                What type of bath have you purchased?
                                                                                                                  [% of consumers]
 THE CONSUMER IS LOOKING FOR LUXURY
                                                                                                                        74%
 Consumers are looking for beautiful, functional products that transform the bathroom from a functional                                                                72% Standard bath
 space into a space where it is pleasant to be. This translates into:
 •   The emergence of large walk-in showers, where consumers can shower, massage, and enjoy
     extensive and unhindered;
 •   The emergence of large shower heads, with which an optimal shower feeling is created;
 •   The emergence of multifunctional shower panels in which various functions (shower, massage,
     rapid rinsing, etc.) are combined;
 •   Growing sales of design products. Consumers are looking for a unique design with which the
                                                                                                                        16%                                            14% Freestanding bath
     bathroom can be decorated entirely to their own taste;                                                                                                            13% Corner bath
                                                                                                                        9%
 •   The use of home automation (automation of technical installations in the home) will certainly
     increase in the bathroom in the coming years. Think of for example digital shower buttons.
                                                                                                                           2015           2016               2017   2018
                                                                      Source: USP SANITARY MONITOR, AUGUST 2019

SHOWER TYPE                                                                                                       HEATING TYPE
What type of shower have you purchased?                                                                           What type of heating have you purchased?
[% of consumers]                                                                                                  [% of consumers]

                                                                                                                       57%

                                                                                                                                                                       48% Towel radiator

                                                                48% Walk-in
      44%
       39%                                                      39% Cabine

                                                                                                                                                                           Floor heating
                                                                                                                                                                       20%
                                                                                                                                                                       18% Panel radiator
                                                                                                                        15%
                                                                                                                        15%
                                                                                                                        12%                                            11% Designer radiator
                                                                   With curtain
         6%                                                     5%
         6%                                                     5  Steamcabine
         6%                                                     4% Shower/ bath combination
                                                                                                                                                                                     37
         2015             2016             2017             2018                                                           2015           2016               2017   2018
You can also read