SREI EQUIPMENT FINANCE LIMITED SREI EQUIPMENT FINANCE LIMITED - Corporate Presentation - May 2016 - Srei Bonds
←
→
Page content transcription
If your browser does not render page correctly, please read the page content below

SREI EQUIPMENT FINANCE LIMITED
SREI EQUIPMENT FINANCE LIMITED
Corporate Presentation – May 2016

                                    Page 1
Disclaimer
THIS PRESENTATION IS NOT AN OFFER OR SOLICITATION TO BUY OR SELL NOTES OR OTHER SECURITIES. IT IS PREPARED EXCLUSIVELY FOR THE PARTIES BEING INVITED FOR THE PURPOSES OF
DISCUSSION AND IS SOLELY FOR USE AT AN INVESTOR PRESENTATION AND PROVIDED FOR INFORMATION ONLY. THIS PRESENTATION IS STRICTLY CONFIDENTIAL AND IS SOLELY FOR YOUR
INFORMATION AND MAY NOT BE REPRODUCED, RETRANSMITTED, FURTHER DISTRIBUTED TO ANY OTHER PERSON OR PUBLISHED, IN WHOLE OR IN PA RT, FOR ANY PURPOSE. THIS PRESENTATION DOES
NOT CONTAIN ALL OF THE INFORMATION THAT IS MATERIAL TO AN INVESTOR. BY ATTENDING THE PRESENTATION OR BY READING THE PRESENTATION SLIDES YOU AGREE AS FOLLOWS:

This presentation has been prepared by SREI Equipment Finance Limited (“SEFL” or the “Company”) is furnished on a confidential basis only for the use of the intended recipient and only for discussion
purposes, may be amended and supplemented and may not be relied upon for the purposes of entering into any transaction. This presentation has not been independently verified by Standard Chartered
Bank (“SCB”). No representations or warranties, express or implied, are made by SCB or any of its respective members, directors, officers, employees, agents, affiliates, advisers
or representatives as to, and no reliance should be placed on, the fairness, accuracy, completeness or correctness of the information or opinions presented or contained in this presentation. None of
SCB or any of their respective members, directors, officers, employees, agents, affiliates, advisers or representatives accept any liability whatsoever in negligence or otherwise for any loss howsoever arising
from any information or opinions presented or contained in this presentation or otherwise arising in connection with this presentation.

The information contained herein has been obtained from sources believed to be reliable but the Company does not represent or warrant that it is accurate and complete. The views reflected herein are
those of the Company and are subject to change without notice. All projections, valuations and statistical analyses are provided to assist the recipient in the evaluation of the matters described herein. They
may be based on subjective assessments and assumptions and may use one among alternative methodologies that produce different results and to the extent that they are based on historical information,
they should not be relied upon as an accurate prediction of future performance. This presentation may include forward-looking statements that reflect the Company's intentions, beliefs or current
expectations. Forward-looking statements involve all matters that are not historical by using the words "may", "will", "would", "should", "expect", "intend", "estimate", "anticipate", "believe" and similar
expressions or their negatives. Such statements are made on the basis of assumptions and expectations that the Company currently believes are reasonable, but could prove to be wrong.

This presentation does not constitute a prospectus, offering circular or offering memorandum or an offer, or a solicitation of any offer, to purchase or sell, any securities and should not be considered as a
recommendation that any investor should subscribe for or purchase any of the Company's securities in any jurisdiction. Investors should not subscribe for or purchase any securities referred to in this
presentation except on the basis of the information in the final offer document issued in respect of such securities. The Company, as such, makes no representation or warranty, express or implied, as to,
and does not accept any responsibility or liability with respect to, the fairness, accuracy, completeness or correctness of any information or opinions contained herein. The information contained in this
presentation, unless otherwise specified, is current only as of the date of this presentation, and the Company assumes no responsibility to amend, modify or revise any forward looking statements, on the
basis of any subsequent development, information or events, or otherwise. Unless otherwise stated in this document, the information contained herein is based on management information and estimates.
The information contained herein is subject to change without notice and past performance is not indicative of future results. The Company may alter, modify or otherwise change in any manner the
content of this presentation, without obligation to notify any person of such revision or changes.

Neither this presentation nor any copy hereof may be sent or taken or distributed in the United States, (or India, Australia, Canada or Japan or any other jurisdiction where doing so may result in a violation
of applicable law) or to any “U.S. Person” as that term is defined in the Securities Act. No offering of securities by SEFL are or will be registered under the U.S. Securities Act of 1933, as amended (the
"Securities Act"), or the securities laws of any state of the U.S. or any other jurisdiction, and any such securities may not be offered, sold, resold, delivered or distributed, directly or indirectly, in the United
States except pursuant to an exemption from, or transaction not subject to, the registration requirements of the Securities Act.
This presentation has not been and will not be registered as a prospectus with the Monetary Authority of Singapore. Accordingly, this presentation is only addressed to and directed at persons in Singapore
who are (i) institutional investors under Section 274 of the Securities and Futures Act (Chapter 289 of Singapore) ("SFA"), or (ii) relevant persons pursuant to Section 275(1), or any persons pursuant to
Section 275(1A), and in accordance with the conditions specified in Section 275, of the SFA or (iii) otherwise pursuant to, and in accordance with the conditions of, any other applicable provision of the SFA.

By attending the presentation to which this document relates or by accepting this document you will be taken to have represented, warranted and undertaken that (i) you and any customers you represent
are an institutional investor or a relevant person under the SFA (as defined above); (ii) you have read and agree to comply with the contents of this notice; and (iii) you will treat and safeguard as strictly
private and confidential all such information and take all reasonable steps to preserve such confidentiality. The distribution of this presentation in certain jurisdictions may be restricted by law and persons
into whose possession this presentation comes should inform themselves about, and observe, any such restrictions.
Previous Year figure has been regrouped / rearranged wherever considered necessary to correspond with the current year classification/disclosure
Certain numbers in this presentation have been rounded off for ease of representation.

                                                                                                                                                                                                            Page 2
Table of Contents

Company Overview & History

Key Strengths

Financial Highlight

                             Page 3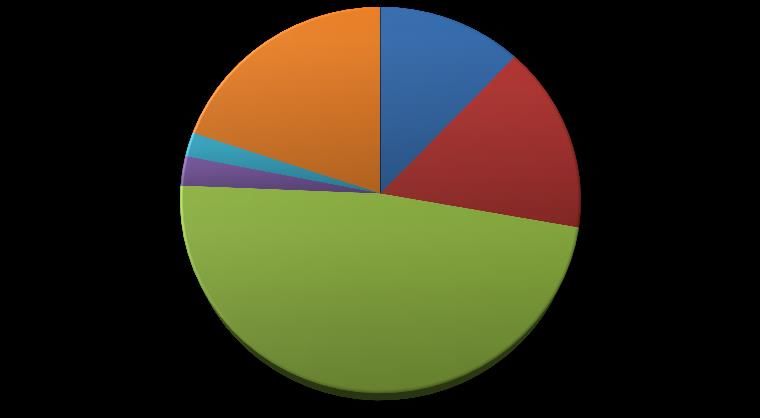
Company Overview
Current Shareholding Pattern Company Highlights
Srei Equipment Finance Ltd (SEFL) is among India’s
leading construction & mining equipment financier with
over ~30 % market share, with a customer base of over
50% 50% 60,000 built and nurtured over last 25 years
As at March 2016, its total Assets Under Management
stands at Rs. 185,980 million (US$ 2.8 billion)
SREI Equipment Finance Ltd
SEFL has entered in new sectors like information
technology, healthcare, rural, logistics etc. to tap the
Note: In order to take the advantage of the emerging attractive growth opportunity in these untapped sectors
opportunities in the infrastructure sector in India, BPLG desires
to become a shareholder in SIFL. BPLG, therefore, proposes to SEFL has a pan India distribution network of 88 branches
acquire 5% of equity shares of Srei Infrastructure Finance with full time employee base of around 1,650 people as
Limited (SIFL) in lieu thereof, transfer/sell its entire shareholding on 31st March 2016
of equity shares in Srei Equipment Finance Ltd. (SEFL)
representing 50% of the total paid-up equity share capital to It has established partnerships with almost all leading
SIFL. The transaction is awaiting regulatory approval. domestic & international equipment OEMs
Proposed Shareholding Pattern SEFL– Key Financials & Ratios as at March 2016
Total income (USD mn) 395
5%
Profit After Tax (USD mn) 17
Assets Under Management (USD mn) 2,807
100%
Shareholders Fund (USD mn) 357
Net NPA * 1.99%
SREI
Equipment Total Capital Adequacy Ratio 19.62%
Finance Ltd
All INR value has been converted in USD @ 66.25
* NPA is calculated as a percentage of on books earning assets Page 4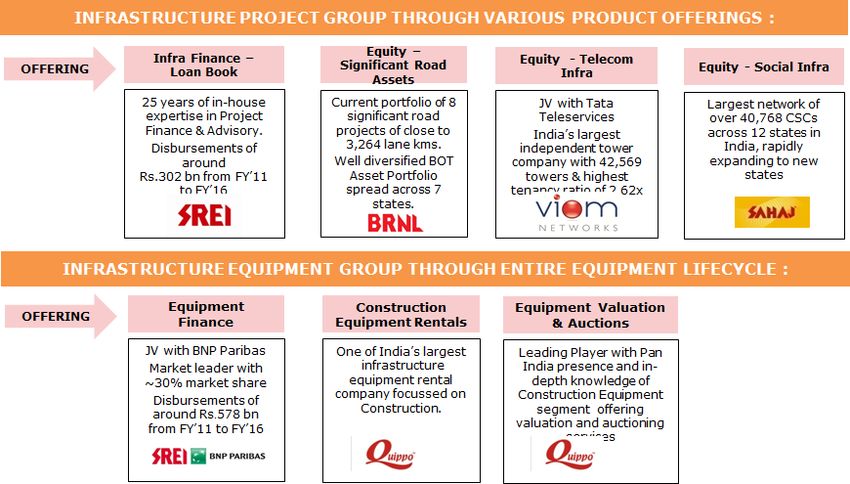
Key Milestones
1 1989: Srei started operations & 3 2002: Conceived India’s first 5 2008-09: SEFL enters into a strategic
identified infrastructure sector organized equipment rental company alliance with BNP Paribas Lease Group
as its core area of business 2004: Developed first ever “On tap” 2009-10: Ventured into the business of
Tied up with L&T to support securitization product with ICICI financing Technology Solution, Medical &
financing of their products bank Health care equipment’s
1992: Initial Public Offering 2005: Raised funds through USD 35 2010-11: Crossed AUM of Rs. 11967 Crs.
mn issue
1995: Raised funds from DEG 2011-12: Rights issue of USD 18.62mn (INR
Entered infrastructure • First Indian NBFC to be listed on 998.20mn)
financing the London Stock Exchange
1 2 3 4 5 6
1989 -1995 1996 - 2000 2001 - 2005 2006 - 2008 2009 - 2011 2011 - 2015
2
1996: Further public issue of ~ 4 2006:-07 Incorporated as SREI 6 2012-13: Entered Rural equipment financing
USD 19 mn (INR 1,000 mn) Infrastructure Development Limited space
1997: Equity Investments by (SIDL) in June 2006 as a 100% Exclusive alliance with Atlas Copco India
International Development subsidiary of SIFL
Equity infusion of USD 37.25 mn by the JV
Institutions – IFC, DEG and 2007-08: SIDL de-merged from SIFL
Partners
FMO to form SREI Equipment Finance
Pvt. Ltd 2013-14:Converted into a limited company.
• Incorporated international
risk management practices Virtual Joint Venture with CNH Industrial.
• Raised funds from – US 2014-15: Entered into an agreement with
Exim bank, Finfund etc. Hitachi Corporation to form a business
alliance.
SREI Infrastructure Finance Limited SEFL (Joint Venture)
Page 5Business Strategy
Risk Adjusted Alliances & Asset
Growth Partnerships Management
• Shift from Strategic to Retail • Develop used equipment
• Invest in Partnership with financing
to reduce risk per Customer OEMs & Dealers to create
compelling customer
• Strengthen new business solutions • Remote asset management
verticals through GPS installed in
equipment
• Deepen relationship across
• Tap the cash flows and infrastructure value chain
acquire security beyond asset • Tap Digital Marketing to
manage asset better
Diversified Talent
Digitization
Treasury Management
• Continue the strong • Promote intrapreneurship
• In-house technology team to
focus on continuous process association with financial
optimization institutions to have long term • Stimulate culture of
strategic funding innovation amongst
employees
• End to end process
automation leading to • Broad base funding profile by
seamless transaction tapping retail funding, bond • Focused leadership
processing market, etc. development programs to
create next generation
business leaders
Page 6Table of Contents
Company Overview & History
Key Strengths
Financial Highlight
Page 7Key Strengths
1. Holistic “Asset Solution Provider” with Strong market position
2. Strong promoter relationship and brand
3. Widespread distribution network & Innovative Marketing Strategy
SEFL -Key
4. Favourable Industry Dynamics
Strengths
5. Diversified funding sources
6. Strong Financial Performance
7. Effective risk management framework
8. Experienced Management
Page 81. Holistic “Asset Solution Provider” with Strong Market Position
SEFL has the unique ability to provide holistic ‘Asset Solution’ by enabling clients across the life-cycle of an asset, namely procurement, deployment, maintenance
and disposal.
SEFL key strength essentially revolves around a “relationship-cum-partnership” model with its manufacturers and its customers and has entered into tie-ups and
partnership programs with large OEMs. These innovative and personalised partnership programs are the key to their strong market position
Business Segments
Total portfolio of USD 2,434 mn
Construction & Mining Customer Segment: Retail, Medium and large customers, project owners, large fleet owners, first time owners & buyers
Market leader in the CME segment with partnerships with leading global domestic and international equipment
Equipment (CME)
manufacturers
Selected Manufacturer :
Total portfolio of USD 107 mn
IT Customer Segment: Institutional and Corporate Segment customers being rated as AA and AAA by rating agencies
Products & Services - IT infra, Telecom, Office automation etc. Provides operating lease, finance lease, receivables discounting,
Infrastructure loans and deferred payment agreements
Selected Manufacturers:
Total portfolio of USD 42 mn
Healthcare Customer Segment: Variation of large hospitals to standalone diagnostic centres in Tier 1 and Tier 2 cities
Products & Services - Medical equipment , Medical devices, Hospital infrastructure
Infrastructure
Selected Manufacturers:
Total portfolio of USD 56 mn
Customer Segment: Contract farmers, Tractor owners
Products & Services - Finance of – tractors, combine harvesters, chilling plant, cold storage & warehouses, etc.
Rural Infrastructure Company plans to focus on corporate farming and develop a model to optimize fixed cost & business risk
Selected Manufacturers:
Total portfolio of USD 103 mn
Aims to be the leader in used construction equipment market through its Holistic Asset solution approach
Pre-Owned Customer Segment: Used equipment from various sectors including construction, mining equipment and technology solutions
Products & Services - Refinancing of standard construction equipments such as backhoe loader, excavator, cranes etc.
Equipment
Selected Manufacturers:
As at 31 March 2016 Page 92. Strong Promoter Relationship with Brand - Srei Group
SREI Group is the leading infrastructure finance company in India with total Asset Under Management of INR 36,702 crore
(US$5.54 billion) as at 31st Mar-2016
SREI diversified into larger infrastructure financing space in 1995 and was awarded “Public Finance Institution” (“PFI”) and
Infrastructure Finance Company (“IFC”) status by the RBI in FY 2011-12.
SREI formed strategic alliances with leading global companies such as BNP Paribas and TATA Teleservices in the construction
equipment finance and telecom towers businesses, respectively. Stakeholders include several international development finance
institutions such as KfW and DEG Germany (owned by the Government of Germany), FMO (owned by the Government of
Netherlands), Nordic Investment Bank, PROPARCO, OeEB (Development Bank of Austria)
SEFL also benefits from the support that it receives from its promoter in the form of equity infusions to assist with its expansion
strategy
Page 103. Widespread Distribution Network and Innovative Marketing Strategy
Portfolio Split as at 31 March Distribution Model
Entrepreneurial driven business
25% 20% Srei approach
Entrepreneur Originates business
Partners Facilitates in collection
24% 31% Maintains customer relationships
Customers
North South East West Relationship based business approach
Responsible for profitability of the portfolio
Relationship Involved through the value chain of the customer
Managers Responsible for business generation, monitoring and
Zone No of Branches Portfolio USD mln
recovery
East 23 663
West 18 675
Helps in maintaining long term relationships and garnering greater share of customers’
North 18 551
spend
South 29 853
Total 88 2,742 Innovative Marketing Strategies
Well spread branch network of 88 branches Purchase of equipment by using pre approved closed
Paison Ki Nilami - 17 Events in 5 yrs.
across India that helps to tap growing demand Unique Dutch auction of interest loop card
& develop customer insights rates Pre-documented & Speed & Convenience
Focused distribution network to cater to
different segments of infrastructure and SREI Partnership Week -Business at
other emerging sector’s equipment Doorstep, new business, dispute
requirement resolution, relationship building
Branches and regional offices are
connected centrally to enable the Khul ja Sim Sim - Unique event which
transmission of real time information with offers subsidised interest rates, free
respect to loan disbursements, financing spare parts, free first year insurance to
arrangements, loan administration and customers.
monitoring and collection and recovery.
Page 114. Favourable Industry Dynamics
Overview Construction & Mining Equipment Way Forward
With unit sales of ~48,400 in FY-15, the Indian earthmoving and construction Vol in units Realistic
USD 5 Bn
equipment (“ECE” or “CE”) industry was valued approximately at USD 2.8 bn
and is expected to grow to around 82,750 units by 2020. 82,750
USD 3.1 Bn 71,850
Between 2005 – 2015, Indian ECE industry grew at a CAGR of 9% and its 63,850
57,400
share as a percentage of GDP has increased from ~5% in 2002 to ~8% by 52,900
2015
Industry Structure
2015-16 2016-17 2017-18 2018-19 2019-20
The industry is fragmented with top 6 manufacturers contributing ~ 70 -75%
of the total sales Pessimistic
USD 4.3 Bn
Backhoe Loaders and Excavators constitute 65 % of the total sales
USD 3.1 Bn
Demand Driver 70,600
52,900
Improving Financing Environment E-auctioning of de-allocated
coal blocks
Premium Rescheduling for road and Fast tracking of coal evacuation
highway projects & awarding of corridors 2015-16 2019-20
Projects on ECP Basis Optimistic
USD 6 Bn
Development of 100 smart cities Expediting Dedicated Freight
Corridors (DFCs) 98,900
Delinking forest clearance from Allowing 100% FDI in certain USD 3.1 Bn
environment clearance rail infrastructure 52,900
Allowing 100% FDI in certain rail Boost for Low cost Affordable
infrastructure projects Housing
Easing of exit norms 2015-16 2019-20
Source: Overview of Indian Construction Equipment Industry by Feedback Consultancy
Page 125. Diversified Funding Sources
Borrowing Portfolio Breakdown (including Securitization)
US$ 2.23 billion US$ 2.28 billion
12% 13% 16%
20%
2%
16%
2%
2% 18%
2016 2015
21%
48% 30%
CP, Bonds & Debentures Secured Term Loan LC/ Buyers' Credit/ WCDL CP, Bonds & Debentures Secured Term Loan LC/ Buyers' Credit/ WCDL
Working Capital Facility Others Securitisation Working Capital Facility Others Securitisation
Being a “Asset Finance Company” as per RBI, SEFL has greater resource raising flexibility across domestic and international capital
markets.
Our Banking partner comprises of 53 Banks and Financial Institutions – both Domestic and International
The group has been supported by international financial institutions and banks like FMO, UPS Capital, DEG, Austrian Development Bank,
SCB, HSBC etc. and has successfully raised financing through syndicated loans that have witnessed strong participation from banks
across jurisdictions
The Issuer has consciously expanded its source of funds in order to optimize its funding costs, protect interest margins and maintain a
diversified funding portfolio to achieve funding stability and liquidity.
Proactive ALM management policy
Page 136. Strong Financial Performance
Shareholder Funds - USD mn Asset Quality
400 6.00%
357
339 4.97%
350 316
5.00% 4.98%
300 282
250 4.00% 3.83%
2.96% 4.07%
200 3.00% 2.95%
150
2.25%
2.00% 1.99%
100
50 1.00%
0
0.00%
FY 2013 FY 2014 FY 2015 FY 2016
FY-13 FY-14 FY-15 FY-16
Net Worth
Gross NPA Net NPA
Note: NPA is calculated as a percentage of on books earning assets
Interest Earning Asset - USD mn Capital Adequacy Ratio
2,850 21%
2,813
2,800 2,772 19.62%
2,750 18%
2,715
17.05%
2,700 17.13%
2,667 16.19%
15%
2,650
2,600
12%
2,550 FY-13 FY-14 FY-15 FY-16
FY-13 FY-14 FY-15 FY-16
CAR
Interest Earning Asset Page 147. Effective Risk Management Framework
• Evaluates the financial & market • Periodic review of defined credit
position of client as well as the policies in order to adapt them to
project, IRR & cash flows and the market related issues
original sponsor • Accountability encouraged in sales
• Give due consideration to process as responsibility of managing
company’s liability structure in asset quality lies with the originator
terms of maturity and liquidity
of loan
• SEFL has developed an • Proactively analysing and building
understanding of the value, life Robust Credit Strong Risk controls in the credit appraisal
utilization of assets funded by it process
Appraisals Management
• Accounts monitored on a
regular basis and classified into
early stage, mid-stage and late
Effective Efficient
stage collectors. Collection Treasury • Diversified borrowing sources
Mechanism Management across domestic & foreign
• Lending backed by PDC or ECS in financial institutions
order to create stronger legal
recourse • Top management review of fund
mobilization and ALM to reduce
• Effective use of technology in the funding cost and manage liquidity
process of collection through hand
held devices • Financial arrangement allows for
future capital requirements to be
• In case of delinquencies, SEFL has funded equally by both the JV
the expertise to repossess and partners
redeploy/remarket the equipment
Page 158. Experienced Management
Master of Science and Master in Economics, Statistics and Finance. Having more than 24 ears of varied experience in the field of
Pascale Charlotte Finance, Development, Strategy, Asset Management and leasing solutions.
Dufourcq Dennery She also holds Board membership of various BNP Paribas Group companies. She was nominated among the Top 5 most influential
Chairman women in European Finance in 2011.
Mr. Hemant Kanoria
Mr. Hemant Kanoria has over 34 years of experience in industry, trade and financial services
He has held the position of Chairman of National Committee on Infrastructure of Federation of Indian Chambers of
Vice Chairman & MD Commerce and Industry and is also a Council Member of Indo-German Chamber of Commerce.
Mr. Sunil Kanoria
Mr. Sunil Kanoria is a Chartered Accountant with more than 26 years of experience in the financial service industry.
Presently the Director of The Associated Chambers of Commerce & Industry of India, a Member of the Central Direct
Joint MD Taxes Advisory Committee and a governing body member of the Construction Industry Development Council.
He is a Polytechnique graduate with vast experience in the financial services industry. He is presently the CEO of BNP Paribas Lease A
Mr. Philippe Denis Francis Civil Engineer with vast experience in the financial services industry. Regional Supervisor - Supervisor of India within the International
Desgeans Director Division of BNP Paribas Leasing Solutions, (Paris, France).
Having extensive knowledge in leasing business and solutions. Served in distinguished capacities in different organisations of different
nations
Mr. Kora Ipe Mr. Puthenpurockal a masters degree from Indian Institute of Technology, Mumbai and has 36 years of experience in the
Puthenpurockal field of corporate banking.
Independent Director He was senior advisor to the CEO and country manager of BNP Paribas India.
Mr. Shyamalendu
Mr. Chatterjee has over 46 years of experience in commercial and investment banking. He was the Executive Director of
Chatterjee
Axis Bank Limited, Mumbai.
He has extensive exposure in the area of international banking having worked with the State Bank of India, London for
Independent Director three years and in Washington D.C. for five years.
Mr. Devendra Kr. Mr. Vyas is a Chartered Accountant by education.
Vyas Overall more than 21 years of industry experience with expertise in financial accounting, structuring, sales & marketing,
CEO operations and IT.
Statutory Auditor • Deloitte Haskins & Sells
Page 16Table of Contents
Company Overview & History
Key Strengths
Financial Highlight
Page 17Financial Highlights
In USD million FY2010 FY2011 FY2012 FY2013 FY2014 FY2015 FY2016
Interest earning asset (*) 1,336 1,758 2,546 2,813 2,667 2,715 2,772
Disbursement 761 1,145 1,735 1,632 1,167 1,165 1,382
Total Income 140 187 274 358 395 394 395
Profit before Tax 20 32 46 61 54 34 24
Profit After Tax 13 20 30 41 34 23 17
PAT Margin 9.36% 10.55% 10.85% 11.37% 8.60% 5.86% 4.41%
Cost to Income Ratio 29% 28% 33% 29% 27% 35% 36%
Cost of Risk Ratio 1.20% 1.39% 0.73% 0.82% 1.43% 1.89% 2.18%
Share Holders Fund 147 167 212 282 316 339 357
CRAR 17.90% 15.82% 16.92% 16.19% 17.13% 17.05% 19.62%
(1) USD INR conversion rate = 66.25 as at 31st March 2016
(*) Interest Earning Asset includes Securitized Portfolio
Page 18Financial Highlights
Total Income & Net Interest income – USD mn Margin Analysis
600
5.10%
500
127 131 131 4.87%
116 4.80% 4.77%
400
4.63%
300
4.50%
200 395 394 395 4.35%
358
4.20%
100
0 3.90%
FY 2013 FY 2014 FY 2015 FY 2016 FY-13 FY-14 FY-15 FY-16
Total Income Net Interest Income Net Interest Margin
Disbursements – USD mn Shareholders Fund has increased from USD 147 mn
as at 31 March 2010 to USD 357 mn as at 31 March
1800 1632 2016, at a CAGR of approximately 16%
1600
1382
1400
1167 1165 Interest Earning Asset has increased from USD
1200
1,336 mn as at 31 March 2010 to USD 2,772 mn as
1000
800
at 31 March 2016, at a CAGR of approximately 13%
600
400 Total income increased from USD 140 mn as at 31
200 March 2010 to USD 395 mn as at 31 March 2016,
0 at a CAGR of approximately 19%
FY 2013 FY 2014 FY 2015 FY 2016
Disbursement
(*) Margin Analysis is calculated on total Portfolio (including securitization) Page 19Thank You
Page 20You can also read