STATE OF CLIMATE CHANGE ADAPTATION ACROSS DIFFERENT CASE STUDIES
←
→
Page content transcription
If your browser does not render page correctly, please read the page content below
1

     STATE OF CLIMATE CHANGE ADAPTATION
    ACROSS DIFFERENT CASE STUDIES AND THE
              ROLE OF LEADERSHIP (Manuscript)

Ting-Ting Zhang1, Martin Lehmann2, Ken Doust3

1Department   of Planning, Aalborg University, Aalborg, Denmark

2Department of Planning, Aalborg University, Aalborg, Denmark

3School of Engineering, Southern Cross University, Lismore, Australia

Keywords:                   Abstract

climate change              Large cities are usually the recipients of change as resources are
adaptation                  concentrated in these areas. As a result, national policies on climate
                            change action often do not translate to action at the local scale. This
coast                       paper takes an exploratory approach to determine the state of
cities                      climate change adaptation in three case studies (Ballina, Australia;
                            Knysna, South Africa and Lemvig, Denmark) and investigate how
leadership                  leadership plays a role in adaptation plans of these cities. Data was
                            collected through document analysis, questionnaires and interviews
climate change
                            focusing on perceptions of the risks of climate change in the
                            community, response plans in place, barriers to adaptation, and
                            leaders in implementation. Findings suggest that funding is the
8 June 2018                 biggest barrier to adaptation in these small cities followed by
                            differences in vision between various levels of government. The
                            progress of adaptation is different across the case studies regardless
                            of socio-economics. For success, top-down approaches should be
                            switched out for more holistic, interdisciplinary bottom-up methods.
                            This will also result in the emergence of leaders in unlikely places.
                            The results of this work will contribute to the increase in variety and
                            quantity of research of climate change in urban areas with a focus
                            on coastal cities.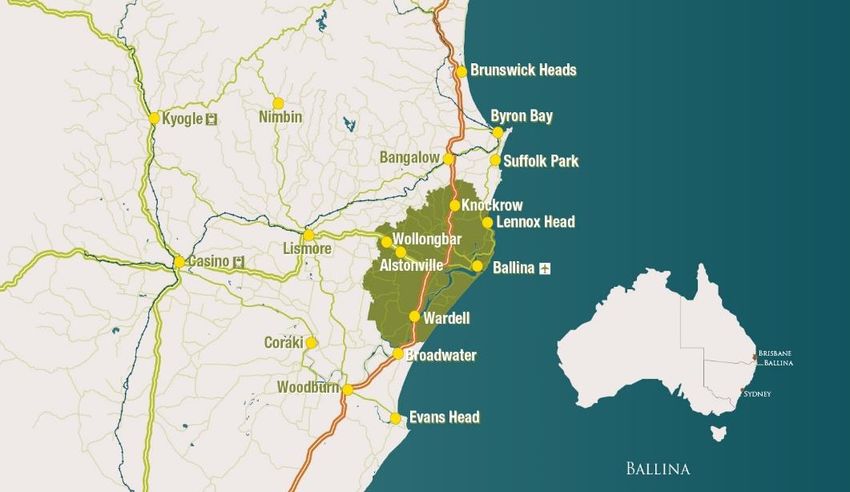
2

   1. Introduction

Climate change is one of the greatest threats to the planet with the magnitude of these impacts
varying depending on different factors. Over 50% of the world’s population lives in urban areas
but attention is usually given to big cities with regards to funding, resources and planning. Policies
are issued at the national level and it is usually bigger cities that have access to more resources
for implementation and successful change. However, nearly half of those who live in urban areas
don’t live in large cities (United Nations Department of Economic and Social Affairs, 2014), these
smaller cities and towns do not see the realisation of policies and plans issued at the national
level (Major and Juhola, 2016). These overlooked smaller cities are numerous and account for a
large proportion of the world’s population and are as important to study as big cities. Data about
these smaller cities adds to the variety and quantity of data available about urban areas,
contributing to research and improving the coverage of data around the world. The coverage of
these previously under studied areas is listed as a priority (to increase quantity and diversity of
knowledge) for climate change and cities research by Bai et al. (2018).

Coastal areas are attractive places for settlements as they provide food, recreational, tourism,
economic, and navigational benefits. A large proportion of the world’s population lives in coastal
areas and many of these areas attract seasonal visitors. These areas are usually exposed to
hazards such as storm surges and erosion. The threats that coastal areas face will be exacerbated
by the effects of climate change (Rosenzweig et al., 2018). Although many of the world’s large
cities are on the coast, there are even more smaller coastal cities and not much attention has
been paid to research of climate change in them (Major and Juhola, 2016);.

As planning and policy in climate change adaptation moves from scientific research into
implementation, the key players shift from researchers to stakeholders in the communities
(government, non-governmental organisations (NGOs), businesses, and individuals amongst
others). Therefore stakeholders from all sectors in all urban settlements should be involved in
climate change adaptation (Pasquini et al., 2015). Cities are considered hubs of innovation and
solutions – local governments are more involved, businesses are invested due to higher stakes
and the concentration of NGOs/environmental agencies is higher. Most experimental projects
3

are implemented in larger cities. These solutions are specific to big cities, but it is unclear whether
results are transferable to smaller cities. Projects that are implemented in small cities are often
not given much attention and the effects are not often studied. This has led to a knowledge gap
of information on small cities and towns, especially in the field of climate change adaptation.

The Urban Climate Change Research Network (UCCRN) has launched a 2-year project in the study
of climate change adaptation in small coastal cities and towns as a way to quantify and provide
knowledge to address the needs of these small coastal cities for climate change adaptation. An
exploratory approach is taken in this paper to obtain a state-of-the-art of chosen case studies as
a way to contribute to the initial stages of this project – providing background information and
studies of selected coastal cities.

Kotter (1990) differentiates the difference between leadership and management: management
produces orderly results while leadership is for useful change to occur. Adaptation requires
change in current practices and this requires someone to take the initiative and spearhead the
change therefore leadership is a crucial factor in climate change adaptation. In smaller cities and
towns, a leader who can influence the community into change may be crucial for increasing the
community’s resilience against climate change impacts.

There is not much literature currently available on leadership in climate change adaptation. The
most appropriate work in this field has been done by Meijerink and Stiller. In their 2013 work,
the kind of leadership required for climate change adaptation was explored. They suggest that
the role of leadership in climate change adaptation is to:

   i.      Influence policy - making processes to include adaptation
   ii.     Form connections between different sectors and policy-making levels for
           collaboration
   iii.    Increase capacity of society to respond to feedback effects from the environment and
           prepare for climate change in the long-term (deal with complexity)
   iv.     Increase adaptive capacity of climate change adaptation in governance networks
4 There are different leadership theories that have been found to serve climate change adaptation within the four areas listed above. The different theories relating to leadership suggest that key individuals may play a crucial role in preparing systems for upcoming change (Meijerink and Stiller, 2013). These leaders should not only be those who are already in a position of power to lead change (political / ideational leaders) but may be individuals who do not hold official leadership positions. From these theories, a framework was developed combining aspects of different theories with the tasks needed in climate change adaptation (Meijerink et al., 2015). As this paper is a state-of-the-art look at climate change adaptation of different case studies, the framework has not been applied completely at this stage of the research. It has been included in ANNEX 1 together with the theories used to form the framework, for reference and possible use at a later stage for analysing the leadership roles of different adaptation projects in the municipalities. To fully understand how different coastal cities are faring in terms of climate change and how leadership plays a role in the climate change actions of local municipalities, this paper aims to answer the question: “How is the state of climate change adaptation in different small coastal cities and what role does leadership play in its current adaptation practices?” This will be done through the different methods listed in the following section. 2. Methodology and Case Studies To answer the research question, the question was broken down into sections. The different steps are listed below in Figure 1:
5

  1. Choose Case Studies with UCCRN Oceania, Nordic Hub directors and supervisors

      a. Ballina                       b. Knysna                        c. Lemvig

     2. Literature review and document analysis for understanding of case studies

Government websites            Existing studies/papers         Government publications

    3. Identify key players in city's climate change adaptation actions and reach out

 Municipal workers              Regional government                       NGOs

  4. Identify leaders/ change agents who are crucial for city's climate change actions

    existing adaptation projects                                Interviews

                          5. Compare and analyse case studies

               Barriers                            Factors for successful adaptation

                           FIGURE 1 FIGURE DEPICTING THE METHODS USED

1. Case studies from countries of differing situations were needed. It was decided that these
   cities/ towns should differ in climate, location and socio-economic situations. These are
   the three cities chosen:
a) Ballina is chosen by the co-directors of the Oceania UCCRN hub based in Lismore,
   Australia. Ballina is situated to the east of Lismore and was chosen because the co-
   directors have established contacts within the local council, the council is typical of many
   small coastal cities on the coast of Australia in that it attracts many retirees in a
   phenomenon known as “sea change” – early retirees moving (lifestyle choice) to small
   cities along the coast to escape the fast-paced larger metropolitan areas (Department of
   Climate change, 2009).
6
b) Knysna was chosen for its location on a tourist route, attracting many visitors. It is also of
different socio-economic standing and in a different climatic zone. Knysna is in the middle
of a drought and the town is recovering from a major fire that destroyed a large part of
the town last year.
c) Lemvig was chosen by the director of the UCCRN Nordic hub as Lemvig is part of the Coast
to Coast project and has several projects coming up.
2. Gain an understanding of the case studies in terms of factors such as: climate,
geography, socio-economics and population. This is done through document analysis of
reports, census and municipal papers.
3. Identify relevant stakeholders who may be part of the city’s climate change adaptation
actions. These stakeholders, usually municipal workers, are then contacted and they can
choose to answer a set of questions via a questionnaire or through a telephonic
interview. The correspondences explored the following topics:
• Climate change impacts perceived as the most important
• Looking back: what the cities have already done to prepare for the impacts
• Looking forward: what the cities are preparing to do in the next decade
• Stakeholders involved in implementing actions and plans
• Leaders in climate change adaptation projects and plans
• Barriers of climate change adaptation in the city
• Types and access to data used for planning for climate change
4. Identify leaders or change agents in the municipality and from literature on leadership,
determine the type of leaders they are. Although the whole framework was not applied
as no implemented projects were studied in detail from inception to after
implementation.7
5. Compare the results from the three case studies to determine similarities and differences.
Looking at the points of success and determining if they could be transferred.
This research is carried out as part of a larger research project with the Urban Climate Change
Research Network (UCCRN) and some results from interviews are obtained from ongoing
research happening at the Oceania Hub hosted in Australia and the Nordic Node hosted in
Aalborg, Denmark.
3. Results
The following section contains results on the background of the three case studies, the results
from the interviews and the climate change actions the cities have planned. In the case of Ballina,
the local government is referred to as the council; in Knysna it is referred to as the municipality;
and in Lemvig it is referred to as the Kommune.
3.1. Ballina
Ballina is in the north coast of New South Wales, Australia (Figure 2). It is a municipality home to
approximately 42 600 people over an area of 48 471.6 hectares (ha). The population pyramid is
skewed to the aged – the median age is 40 and over 30% is over the age of 55 (Australia Bureau
of Statistics, 2017). Ballina also has a 3% aboriginal population. The population is growing at a
rate of about 1% a year. It is a popular location for retirement and retreats because of its seaside
location, proximity to Queensland and the Gold Coast area and access to its own airport.8
FIGURE 2 LOCATION OF BALLINA COUNCIL (SOURCE: WWW.PACIFICCOAST.COM.AU)
The area is characterized by fertile soils along the Richmond River, deltaic floodplains and
beaches on the coast, and mountains of the Great Dividing Range in the hinterlands. The town
experiences mild winters and hot summers with annual rainfall averaging over 1600mm as it is
located humid subtropical climatic zone.
Ballina’s temperatures have been consistently rising over the past 5 decades. The rainfall is
projected to increase while sea level is expected to increase by 0.4m by 2050. For a full list of
expected impacts in the three case studies, refer to ANNEX 2. The increase of hot days (with
maximum temperature above 35°C) will increase the vulnerability of the population, especially
the older age groups as heat has been proven to increase mortality and illness amongst the aged
(Black et al., 2013).
The council has implemented sea walls as physical measures against floods. Ballina experiences
some flooding from excess rainfall, storm surges and during king tides. However, it has not been
severely impacted and has thus not warranted for extra measures. Looking forward, the council
listed flooding, shoreline erosion, saltwater inundation and the change in rainfall pattern as the
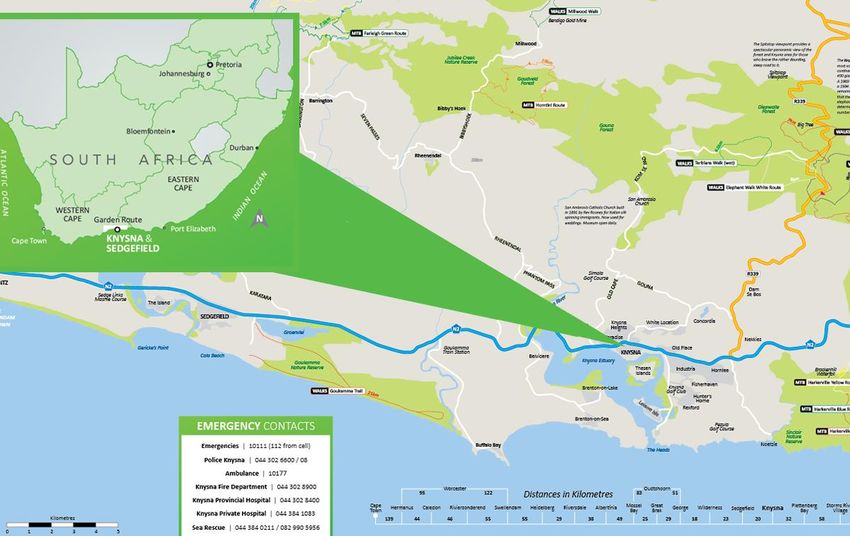
most important impacts for Ballina to work with.9 The Ballina council has a Climate Action Strategy (2012) in place. Two stakeholder engagement activities contributed to the drawing up of the strategy. In addition, there are separate plans for coastal and floodplain management (2016 and 2015 respectively). In terms of implementation of projects and plans, responsibility is usually shared between strategic planning and engineering departments of the council. This is then in conjunction with neighbouring councils when plans are for transboundary issues (i.e. Rous Water projects). The leadership for actions in Ballina is from the local government. Community apathy was one of the adaptation barriers brought up in the regional vulnerability assessment. There does not seem to be active leadership from the local community for change. The citizens are reliant on the local government to take the actions necessary for adaptation, they may agree with the changes but only if they do not have to fund it themselves. In the stakeholder engagement meetings held to draw up the adaptation plan, there were participants who attended but did not believe in climate change. These are challenges that impede adaptation. The council could take action by assigning different roles to different sectors and communicating climate information in a more relatable way. 3.2. Knysna Knysna is a small city with a bay located in the Western Cape of South Africa (Figure 3), along the scenic Garden Route. It is surrounded by the Outeniqua Mountains, the Indian Ocean, dunes, rivers and estuaries (Knysna Municipality, 2015). It has an area of 110 900 ha. In 2015, the population of Knysna was 72 169 living in 24 295 households. Knysna has 19.6% of people living in poverty (Western Cape Government Provincial Treasury, 2015).
10

                     FIGURE 3 LOCATION OF KNYSNA (SOURCE: WWW.VISITKNYSNA.CO.ZA)

The municipality experiences hot and humid summers while winters are cool and rainy (although
rainfall occurs throughout the year). The annual average rainfall for the region is about 770mm.
Knysna forms part of the greater Eden District and the region has regularly experienced climate
change related extreme events such as: flooding, fires, coastal inundation and drought (Eden
District Municipality, 2014).

The impacts of climate change in Knysna point to hotter days and more intense storm events.
Models predict different projections for rainfall, so it is unclear whether it will increase or
decrease overall. Sea level rise is one of the most pressing issues for the municipality as many
properties on the coast are experiencing damages during storm surges. Overall climate is
expected to shift to a warmer and more subtropical climate with warmer conditions. This will
allow alien vegetation, which are causing problems in biodiversity, water and fires, to thrive and
create more problems. Water supply is a particularly important concern now too because it is a
limit to growth in the municipality. This is because of inappropriate land use, droughts, and
insufficient storage as population increases. The town is currently on level 3 water restrictions
although some in the environmental sector believe that restrictions should have remained at
level 4. The restrictions were relaxed at the request of the tourism sector.
11 Tourism is an important industry in the town as it generates a large portion of the income. Results from Knysna showed that all sectors realize that there is a need for adaptation to climate change, especially after the fire disaster in 2017. Individuals and businesses are now all onboard with climate change adaptation – they would like to see change and would like to participate in the changes. In environmental protection plans such as the wetlands protection plan for 2017-2022 (Robinson, 2017), the key actions for focus areas needed included actions against climate change (mitigation and adaptation) but there are no clarifications on what these actions will entail. The Eden District has a climate change adaptation plan published in 2014 but Knysna itself does not currently have a plan or policy targeting climate change. However, they are working on one that is expected to be released in the next financial year. The municipality has built sea walls in some areas and some residents have built gabions on properties despite being advised against it by the municipality. The national environmental minister had given approvals for individuals to build gabions. This is a result of differing opinions between the national government and the municipality which can create tension and impede reform. Knysna municipality intends on moving towards a greener economy and greener infrastructures. The fire of 2017 destroyed many buildings after which would have been a good opportunity to implement new building codes. These building standards were given as guidelines, the municipality is unable to enforce it considering how much the citizens had lost in the fire. The municipality has implemented adaptation projects despite not having a plan. They are currently implementing two sustainable urban drainage systems (SUDS) projects to redirect Stormwater with NGO BioWise. BioWise is leading in many adaptation projects in Knysna: zero waste, eco-bricks, nature-based solutions education, workshops and the establishment of a discovery park. The organization works collaboratively with the municipality, other organizations and independently to develop, fund and implement projects.
12
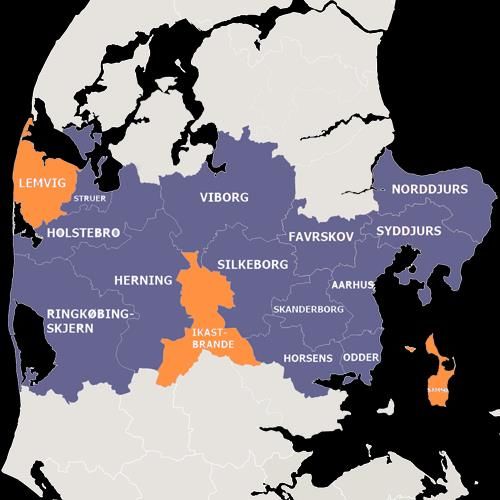
3.3. Lemvig
Lemvig is a small municipality on the west coast, in the Midtjylland region of Denmark (Figure 4)
with a total population of 20 293 people in 2017. The kommune shows negative population
growth (one of the highest in the country) and more than 50% of the residents are aged over 40.
While the overall population growth is negative, the predictions for population growth amongst
those age 65 and above are increasing (Lemvig Kommune, 2017). The population in Lemvig
centre is 7 000. The municipality occupies 50 817 ha of land. The biggest concern for the Lemvig
is flooding: overflow of sewers in cloud burst events, flooding from increased storm intensity,
groundwater levels rising and causing flooding, flooding along streams (Lemvig Kommune, 2014).
FIGURE 4 THE LOCATION OF LEMVIG IN THE CENTRAL DENMARK REGION (SOURCE: WWW.MTIC.DK )
The Limfjord next to which Lemvig is situated experiences flooding regularly, the water levels can
rise up to 2.25m as experienced in a flood from storm surges in December 2015. Water levels in
the fjord are projected to rise up to 60cm by 2060 during storm surges (from 2005 levels). In
addition, there are threats from the groundwater levels rising because of sea level rise and
increased rainfall (Sorensen, 2018). There are no concerns with shortage of water supply, in fact,
fresh water supply is expected to increase in some areas (European Commission, 2009)13 Lemvig had developed a climate change adaptation plan for the years 2014 – 2017. However, only the issues relating to water are discussed – the focus was on reducing floods. Flood risk mapping and modelling was used to determine areas that need attention. The main types of flooding considered to be of significant threat were flooding from cloudbursts and due to storms. Flooding from the watercourses and groundwater were left out as these are not expected to cause enough damage at present and will be targeted in later plans or in other sectors of planning (Lemvig Kommune, 2014). The aim of the climate adaptation plan was to 1) establish co-operation between different stakeholders, 2) communicate and inform the citizens about the risks of climate change and advise them on how they can respond, 3) include climate change management into other functions of the Kommune, and 4) manage the city’s water drainage so that it does not increase the severity of existing problems. As the plan was done as an agreement with national and regional government for the period of 2014-2017. There was no further agreement to draw up a plan for after 2017. However, climate change adaptation actions are now done with the Coast to Coast Climate Challenge(C2C) project that started in 2017 with funding from the European Union (EU). Lemvig and Lemvig Van dog Spildevands (utilities company) are both part of the Coast to Coast Climate Challenge (C2C) where they have several actions related to climate change actions in coastal towns. Lemvig is part of 3 projects: C9 – Thyborøn channel and western Limfjord, C17 – Thyborøn city and harbour, and C21 – the klimatorium focusing on innovation in fjords, rivers and sea (C2C Climate Challenge, 2018). An overview of these actions can be found in ANNEX 3. An example of a successfully implemented climate change adaptation action is the harbour at Lemvig. When presented with two options on dealing with rising sea levels and annual floods in the town, the kommune chose one that could manage flood waters and serve the citizens of the town. The project is a rejuvenation to the commercial harbour. The promenade on the harbour now connects the sea, the harbour and the town by incorporating recreational spaces and implementing ideas by residents (Environmental Protection Agency, 2014). In addition to the
14

flood protection wall already implemented at the harbour, there are pumps and water storage
areas in progress to handle the increased amount of water the kommune will receive.

This project was proven to be a success as the Kommune have had no issues with flooding since
implementation. It is also a popular place for the residents to gather when the weather is warmer
and is a place of many public events.

Individual leadership is needed when wanting to climate proof private buildings against climate
change in Lemvig. The Kommune does not provide subsidies for those wanting to protect their
houses against floods. Homeowners can obtain data and approval for improvements from
kommune and if the location of the property is eligible, they can then implement the changes.
The leadership that drove the funding for the C2C projects came mainly from the Central
Denmark Regional government and kommune staff. An individual who works for the kommune
has been instrumental for determining the type of work done on this project and driving the
change.

In the table below, the responses from the different case studies is summarised for comparison:

TABLE 1 SUMMARY OF RESPONSES FROM CASE STUDIES

                            Ballina                         Knysna                Lemvig
     Climate       •   Flood                     •   Drought              •   Flooding from
     Change        •   Change in rainfall        •   Fire                     storms
     impacts           pattern                   •   Flood                •   Cloudbursts
                   •   Shoreline erosion         •   Sea level rise       •   Sea level rise
                   •   Saltwater
                       inundation
  Implemented      Climate change                Eden District Climate    Lemvig Climate Change
      plans        adaptation risk               Change Adaptation Plan   Adaptation Plan (2014-
                   assessment (2009)             (2014)                   2017)
                   Climate Action Strategy No plan specifically for       Central Denmark
                   (2012)                        Knysna                   Climate Change
15
Cities for Climate Adaptation template
Protection Local Action (2013)
Plan (2006)
Future actions Review current plans Climate Change Action C2C Projects
to improve, continuous Plan for Knysna planned
implementation of for next year
current plans
Leaders in Local government
adaptation
Biggest Funding Funding Funding
barriers
Consistency in policy at National governing People who may not
higher levels of party and provincial be 100% behind
government – lack of governing party physical solutions (i.e.
policy direction or different losing view of sea)
benchmarks
Effort of municipality Access to data at a
Communicating of prioritises the provision local level prior to
climate change of basic services funding from C2C
information (housing, water,
sanitation)
Access to specialist
knowledge at the local
scale
3.4. Adaptation barriers
The barriers to climate change adaptation in Ballina is mostly due to lack of funding. Some other
factors include: information not downscaled to local context (lack of access to specialists and16 knowledge at this scale), format in which information communicated is not relatable for the public. Furthermore, the information is always changing due to changes in science, politics and policy, making it more difficult to communicate as information may be out of date by the time it has gone through the process and published. Another point brought up from the questionnaires is that there is a lack of consistent policy from government at higher levels. It would be useful to have benchmarks for planning to address the lack of policy direction at both state and federal levels of government. The issue of funding was also the biggest one in the other two case studies. Knysna’s environmental management department is small and short on staff. The budget is only for implementation which makes it difficult to make as many changes as desired. Much of the municipality’s budget is used towards basic services and housing. Lemvig also had the issue of funding until they obtained the external funding from the EU life program for the C2C projects. Actions that are not related to these projects may prove to be challenging to start if the municipality does not secure extra funding. The second biggest barrier would be the access to data that is specific to the city/town at a local scale. Many of the assessments and projected impacts are for a bigger scale (either regional or provincial), there are only a few variables that may be available to the individual cities if models are available. In addition, the situation is always changing (with regards to climate, policy and politics) making it difficult to plan and keep up with the changes. Lemvig no longer has that problem as the first phase for all three C2C projects are to obtain the relevant data. For Ballina and Knysna, it is challenging to plan for the impacts when planners do not have the projections for the town specifically. Another main barrier mentioned in Ballina and Knysna is the lack of clear direction from national government. The differing priorities at various levels of government make it difficult to fully understand what needs to be done. This will also create confusion among the public. In Knysna, the municipality is run by a different political party than the national one. This can create further planning and adaptation barriers due to the differing views of the different political parties.
17

There are other barriers relating to climate change adaptation in these towns. Ballina took part
in a vulnerability assessment of the settlements sector of the North Coast Region and the barriers
to adaptation (Office of Environment and Heritage, 2014), but the barriers can be relevant to
other sectors. A study done by Pasquini, Cowling and Ziervogel (2013) on the barriers to
mainstreaming climate change adaptation at the local government level in Western Cape, South
Africa also point out barriers to adaptation that may be applicable to other cases. The most
applicable barriers mentioned besides those already mentioned are listed below in Figure 5

       Individual
• Coomunity apathy
• People not believing or understanding the science of climate change
• People dont believe that they, as individuals, can change anything
          Local
• local governments not having enough power to manage many of the actions happening in and
  around town as it is under the jurisdiction of government at a higher level
• Information of climate change not communicated well (unrelatable) to the public
          Other
• government positions from term-to-term, there is no long term sight or goals
• historical planning decisions not taking climate change into consideration creating problems now

                     FIGURE 5 CLIMATE CHANGE BARRIERS FROM PREVIOUS ASSESSMENTS

   4. Discussion

While there are many statutes relevant to environmental management of Knysna (relating to
agriculture, planning, chemicals, governance, sustainable development of mineral resources,
water, fires and more), none target climate change specifically. Although this is not a measure of
how successful a municipality’s adaptation is, as Ballina has a climate action strategy but
experiences barriers in terms of funding and lack of benchmark targets to work towards. The
issues of funding and access to relevant data for specific municipalities are expected in majority
of small coastal cities or towns.
18 The high proportion of people above 50 staying in Ballina are more vulnerable to the effects of climate change. Many of these are migrants who move to the coast with all their accumulated assets and invests it in a property. They move to small seaside towns for a more relaxed lifestyle. When these properties are destroyed by flooding or erosion events, they often lose everything. The issue of insurability is complicated in Australia and most the houses bought by these retirees are not covered by insurance, so damages often create huge financial losses for the owners and they often cannot afford to invest as much money to repair. Together with the aboriginal minority, the council should consider the vulnerability of different groups when planning, they should be included in the process of reform. Knysna faces an array of challenges with regards to climate change adaptation. In addition to those mentioned above, Knysna struggles with balancing all its priorities. In a country where there is a large proportion of people still living in poverty. Government services will tend to be biased towards basic service delivery. People who do not have the means to live a comfortable life are unlikely to have time and effort to care about climate change (Pasquini, Cowling and Ziervogel, 2013). Their energy is focused on basic needs but they are the group that is most vulnerable to climate change. Houses in the informal settlements are usually built in the most undesirable areas of municipality: on steep hills and low-lying flood prone areas. The municipality’s priorities are providing formal housing and basic services. In these cases, it is extremely vital to have leadership from the non-governmental sector (Meijerink and Stiller, 2013), in the local community. BioWise in Knysna started the initiative of “Naturally Knysna” in 2010 but the town was not yet ready for it and there were challenges that prevented the implementation of the project. The project has now been changed to “Waste Nothing”. The uptake of it has been much better because the terminology has been simplified and better communicated to the public. It aims to use the concepts of biomimicry to help Knysna function as a forest and producing no waste. BioWise has also received funding for the creation of a Discovery Park. The Discovery Park will be composed of various education and tourism nature parks in the Garden Route area. These parks will be developed under the principles of biomimicry. The changes proposed by BioWise are not slow gradual changes but evolutionary leaps. Even though most changes take place through minor changes over longer periods of time, perhaps
19

planned transformational changes could catalyse the process of adaptation and shift
development pathways. One of the research priorities for cities and climate change as mentioned
by (Bai et al., 2018) is to support bold strategies and transformation. This local innovation project
could be supported, implemented and if successful, could be scaled up for transformation at the
larger scale.

   4.1.         Leadership

Ideational leaders and policy entrepreneurs are important for pushing the agenda of climate
change adaptation into policy making. These leaders discover the need for new solutions, are
catalysts for policy innovation and are usually politicians, expert groups or representatives from
specific interest groups (Meijerink and Stiller, 2013). Change agents, champions of new causes
often start with politicians or people with influence in their communities. For example, in the
“Waste Nothing” project, the change agents will be firstly, the environmental department of the
municipality and secondly, every municipal worker including the mayor. One of the reasons why
the project was able to be successfully implemented was because the mayor was a champion for
the cause. Those in higher positions will have a further reach into the community. Change agents
could also be individuals in the community who actively participate and to whom the community
is exposed.

Leadership could also come from unlikely places rather than from the traditional top-down
approaches. Knysna is home to many retired professionals and academics whose industry
knowledge is an under-utilised resource. There are plans to form community groups with these
individuals to meet regularly, discuss about environmental issues in Knysna, exchange ideas and
find solutions together. The substantial proportion of older aged people in both Lemvig and
Ballina provides a similar opportunity for finding unlikely leadership within the community,
especially within this more vulnerable age group. This may be especially important in Lemvig as
the population of those above 65 are expected to increase 14% by 2026 while the proportion of
working group aged people are projected to decrease (Lemvig Kommune, 2017). Although the
new C2C projects may draw younger residents to settle in the town, it is not clear yet if it will
20

stop the negative growth in population numbers. In addition, the projects are done with existing
organisations and companies who have worked in the area previously, so it is likely that the
permanent population will not increase drastically. Therefore, it is especially important to involve
the citizens that are already living there in the projects and increase their capacity to deal with
climate change.

With the realization that the traditional hierarchical leadership layout is not effective anymore
(Meijerink and Stiller, 2013). The use of more holistic, interdisciplinary and connected thinking is
being used more. The stakeholders in climate change adaptation are from different government
levels, different sectors and different backgrounds. There is a need for leaders to connect these
different stakeholders, encourage collaboration and implement solutions. The case of the Coast
to Coast project in Denmark is a good example of connectivity leaders driving the change and
bringing together stakeholders from academia, governments, businesses and communities to
create a nation-wide project working towards a better adapted Denmark.

The leadership in the case of the “Waste Nothing” project is from a variety of stakeholders. Firstly,
the director of BioWise fulfilled the leadership function of connectivity of promoting the problem
of waste, mobilising and bringing together stakeholders to search for solutions. The
dissemination function was fulfilled when the information was presented to the mayor and other
politicians in the town. The political-administrative function involves the securing and allocation
of resources (fulfilled by the National Lottery Fund by granting funding to BioWise). The other
functions may have been fulfilled but it is unclear by which leaders as it is not completely
implemented yet and as not all the details of the project are known.

   4.2.        Smaller cities as the new hubs of knowledge and innovation

Ballina does not yet have large climate change projects that it forms part of. This may be because
the town has not yet been severely impacted by climate change. The most effective driver of
change may be a severe event. Another reason could be the power dynamics between different
levels of government. The local governments in Australia do not have a lot of autonomy and
power in terms of what they implement. Many of those decisions sit with the New South Wales
21

government. The council, however, has smaller local projects targeting six different key functions
of the council as described in the Climate Action Strategy (Ballina Shire County, 2012). These are
all managed by the council. It may be helpful for Ballina to identify champions of the cause in the
state government to secure new projects, and to engage the citizens to encourage the emergence
of individuals who are critical for success stories. It is also useful to turn these threats into new
opportunities, presenting climate change projects as business cases and incorporating climate
change into the council’s core business could attract more funding and ensure that climate
change is planned for in all sectors of the council’s functions.

Big cities were considered to have been the centres of innovation and change because there is a
wealth of resources. On the other hand, small cities have smaller departments with less resources.
However, because the departments are smaller, collaboration within and between smaller cities
and between different departments may happen at a higher and faster rate. Decisions could be
reached faster and if there is available funding, these smaller cities could be the new hubs of
innovation and home of successful adaptation projects.

There is still some data lacking with regards to the effectiveness of these implemented actions.
In the example of Lemvig, the harbour was built in 2014 and although there have been no flood
incidents since then, the time lapsed has not been long enough to see the bigger events (1-in-10
year to 1-in-100-year events) occur and determine how well the harbour is faring in the longer
term. Therefore, it is important to start monitoring the results now to understand the full effect
of the intervention and to understand its mitigated effectiveness to know how successful it is.

   5. Reflections

The ideal plan was to get a cross section of responses from each city – to have several people in
the municipality fill out the questionnaire and then having in-depth interviews with those who
had unusual answers. However, some cities preferred to answer one questionnaire collectively.
The collection of one response instead of a variety of responses could create a bias as responses
will be of the respondent’s experiences.
22

The interviewing of mostly municipal workers also creates a slight bias as they tend not to point
out many of the faults of the municipality. The failures of projects implemented by the
municipality are also not likely to be brought up. With the interviewing of other stakeholders
such as environmental NGOs or consultancies, a more well-rounded response could possibly have
emerged.

The research is still ongoing at UCCRN. The questionnaire to determine the state of climate
change adaptation has been sent out to more coastal cities in Australia. The Office of
Environment and Heritage (OEH) in New South Wales has conducted research into climate
change adaptation previously with similar questions. Collaboration with the OEH will assist in
getting a wider spread of data and contacts of more councils.

Possible next steps for the research could include the following:

                                   Apply leadership
    Contact OEH to
                                    framework to                    Assess and monitor
  receive their results
                                    implemented                      existing projects
     or collaborate
                                       projects

     Increase the                Study implemented                   Develop guidance
     diversity and                projects in greater                   strategies for
    quantity of data                    detail                      adaptation in cities
                                                                        as per goal of
                                                                     UCCRN project of
                                                                     climate change in
 Identify more viable                                                   small coastal
                                     Reach out to                        cities/towns
    case studies in
                                   stakeholders in a
 Denmark and South
                                   variety of sectors
        Africa

This research contributes to the project on climate change adaptation in small coastal cities and
towns by providing insight into the state of the art of different coastal cities. Data on the towns
are provided in ANNEX 4, filled in with data that was able to be found. The typology variables can
be used for modelling small coastal cities around the world.
23 6. Conclusion All the data and research of big cities have created siloes, isolating the research from smaller cities and towns. Smaller cities are important to research to increase the diversity of climate change data in urban areas. Small cities are interesting to study because their size makes the policy makers more connected to the communities. This intimacy allows for more holistic, bottom-up approaches when it comes to planning. When top-down approaches are removed, it creates a space for collaboration for a wider range of people, and through these interactions, for leaders to emerge. These leaders who are not in political positions have been proven to be important for driving change, both in planning and implementation. There is still limited research on leadership and climate change adaptation, individual projects should be assessed to get an in- depth perspective on the leadership involved through the various stages. However, the study of the different case studies and related projects have proven that small cities can also be hubs of innovation and change. These small cities are also able to lead in research and climate change adaptation if there are individuals who are willing to break the adaptation barriers and through collaboration with different stakeholders. Acknowledgements Thank you to the directors of the UCCRN Oceania, Nordic and African hubs for aiding with finding and making contact with case study stakeholders. Thank you to the staff at Ballina, Knysna and Lemvig municipalities as well as the director from BioWise for offering up your time for the interviews. References Australia Bureau of Statistics (2017) Ballina (A) (LGA)(10250). Available at: http://stat.abs.gov.au/itt/r.jsp?RegionSummary®ion=10250&dataset=ABS_REGIONAL_LG A&geoconcept=REGION&datasetASGS=ABS_REGIONAL_ASGS&datasetLGA=ABS_NRP9
24 _LGA®ionLGA=REGION®ionASGS=REGION. Bai, X. et al. (2018) ‘Six research priorities for cities and climate change’, Nature, 555(7694), pp. 23–25. doi: 10.1038/d41586-018-02409-z. Ballina Shire County (2012) Ballina Shire Council Climate Action Strategy. Ballina. Black, D. et al. (2013) Heat-Ready: Heatwave awareness, preparedness and adaptive capacity in aged care facilities in three Australian states: New South Wales, Queensland and South Australia Final Report. Gold Coast. Available at: https://www.terranova.org.au/repository/nccarf/heat-ready-heatwave-awareness-preparedness- and-adaptive-capacity-in-aged-care-facilities/black_2013_heat-ready_heatwave_awareness.pdf (Accessed: 22 May 2018). C2C Climate Challenge (2018) Action C21: Climatorium. Available at: http://www.c2ccc.eu/english/sub-projects/action-c21-klimatorium/ (Accessed: 7 June 2018). Department of Climate change (2009) Climate Change Risks to Australia’s Coast: A first pass national assessment. Eden District Municipality (2014) Eden District Municipality Climate Change Adaptation Plan. Environmental Protection Agency (2014) Innovative climate change adaptation at Lemvig Harbour. Available at: http://en.klimatilpasning.dk/cases/items/innovative-climate-change- adaptation-at-lemvig-harbour.aspx (Accessed: 18 April 2018). European Commission (2009) Denmark: Country Overview and assessment. Available at: https://ec.europa.eu/maritimeaffairs/sites/maritimeaffairs/files/docs/body/denmark_climate_chan ge_en.pdf (Accessed: 25 April 2018). Knysna Municipality (2015) Integrated Strategic Development Framework Knysna STRATEGIC ENVIRONMENTAL ASSESSMENT: NATURAL ENVIRONMENTAL CONTEXT (DRAFT) 8 DECEMBER 2015 Integrated Strategic Development Framework Knysna PREFACE THE KNYSNA STRATEGIC ENVIRONMENTAL ASSESSMENT (SEA) AND THE KNYSNA ISDF Background to SEA in South Africa. Available at: http://www.knysna.gov.za/downloads/isdf/ISDF_DraftStrategicEnvironmentalAssessment- 0416.pdf (Accessed: 23 May 2018). Kotter, J. . (1990) ‘What leaders really do’, Harvard Business Review, pp. 156–167.
25

Lemvig Kommune (2014) Klimatilpasningsplan 2014-2017. Lemvig.

Lemvig Kommune (2017) Datakatalog 2017. Available at:
https://www.lemvig.dk/Files/Files/Om Kommunen/datakatalog/Datakatalog 2017 - v2.pdf
(Accessed: 18 May 2018).

Major, D. C. and Juhola, S. (2016) ‘Guidance for Climate Change Adaptation in Small Coastal
Towns and Cities: A New Challenge’, Journal of Urban Planning and Development, 142(4). doi:
10.1061/(ASCE)UP.1943-5444.0000356.

Meijerink, S. et al. (2015) ‘The role of leadership in regional climate change adaptation: a
comparison of adaptation practices initiated by governmental and non-governmental actors’,
Journal of Water and Climate Change, 6(1), pp. 25–37. doi: 10.2166/wcc.2014.137.

Meijerink, S. and Stiller, S. (2013) ‘What kind of leadership do we need for climate adaptation?
A framework for analyzing leadership objectives, functions, and tasks in climate change
adaptation’, Environment and Planning C: Government and Policy. SAGE PublicationsSage
UK: London, England, 31(2), pp. 240–256. doi: 10.1068/c11129.

Office of Environment and Heritage (2014) Integrated Regional Vulnerability Assessment: North
Coast New South Wales. Sydney.

Pasquini, L. et al. (2015) ‘What enables local governments to mainstream climate change
adaptation? Lessons learned from two municipal case studies in the Western Cape, South
Africa’, Climate and Development. Taylor & Francis, 7(1), pp. 60–70. doi:
10.1080/17565529.2014.886994.

Pasquini, L., Cowling, R. M. and Ziervogel, G. (2013) ‘Facing the heat: Barriers to
mainstreaming climate change adaptation in local government in the Western Cape Province,
South Africa’, Habitat International. Elsevier Ltd, 40, pp. 225–232. doi:
10.1016/j.habitatint.2013.05.003.

Robinson, K. (2017) Eden District Municipality WETLAND REPORT | 2017 LOCAL ACTION
FOR BIODIVERSITY ( LAB ):

Rosenzweig, C. et al. (2018) ‘Commissioned Paper 6: urban Climate Change Science, Impacts
and Vulnerabilities: State-of-the-Art Findings and Key Research Gaps’, pp. 1–15.

Sorensen, L. R. (2018) C2C CC – Coast to Coast Climate Challenge.
26

United Nations Department of Economic and Social Affairs (2014) World’s population
increasingly urban with more than half living in urban areas. Available at:
http://www.un.org/en/development/desa/news/population/world-urbanization-prospects-
2014.html (Accessed: 5 June 2018).

Western Cape Government Provincial Treasury (2015) Socio-economic Profile Knysna
Municipality Working Paper. Cape Town.
27

SUPPLEMENTARY INFORMATION

      ANNEXE 1 – ANNEX 4
28
ANNEX 1: LEADERSHIP THEORIES & FRAMEWORK
(adapted from (Meijerink and Stiller, 2013; Meijerink et al., 2015)
The table below show the different roles of leadership needed in climate change
adaptation, the theories the authors used to address the roles needed and the objectives
of each type.
Leadership in Leadership in Leadership in Leadership in
policy-making connectivity complexity sustainability
Theories • Ideational • Catalytic; • Complexity • Eco-
used leaders • collaborative; leadership leadership;
• policy • integrative theory • socio-
entrepreneur leadership ecological
systems
theories
Who leads • politicians; • Positional • Positional • Positional
• key leaders, leaders, leaders,
individuals, • key • key • key
individuals individuals, individuals
(champions,
sponsors)
Objective Initiate and Collaboration, Enhance Adaptive
implement new establishing adaptive management
policies for the connections capacity of of social-
cause across different society to react ecological
sectors and to feedback systems and
levels cycles and increase
complexity adaptability of
governance
netoworks29
This leadership framework developed by (Meijerink and Stiller, 2013) based on the
different leadership functions shown above. The framework is divided into several key
functions with the objectives and tasks of those serving in each function. Projects can be
examined by applying this framework and identifying leadership in its various functions.
Leadership functions in climate
adaptation of interorganisational
networks
Political-
Connective Enabling Adaptive administrative
Dissemination
Promote Simulate development make introduce
problems, variety of new decisions, new,
mobilize adaptation practices/ communicate developed
stakeholders strategies ideas and monitor ideas to
in search for positional
solutions leaders
create a generate and
Bring people sense of allocate
of different urgency/ set resources for
levels deadlines adaptation obtain
together to accepted new
collaborate developed
ideas
Move to action,
implementation,
forge agreements30
ANNEX 2: PROJECTED CLIMATE CHANGE IMPACTS ON THE THREE CASE STUDIES (WHERE
AVAILABLE)
variables Ballina Knysna Lemvig
Temperature Daily averages to rise in Increase of an average of Warmer summers and
all seasons by 0.4°C – 1°C – 2.5°C. Longer milder winters
2°C by 2070 summer months
Rainfall Expected to decrease in Uncertain whether it will Increase by 1.6% - 6.9%
winter. Decrease increase or decrease for Denmark, higher
projected for summers (annual rainfall). increases in winter.
in the near future (2030) Projected that peak
but increase for the far winter rainfall may
future. Projected overall decrease but increase in
increases in the other autumn and spring.
seasons.
Sea Level 0.4m rise by 2050; 0.9m Best case scenario is a 0.3 m – 0.6m rise by the
rise by 2100 (based on 0.35m increase by 2050. end of the century
1990 levels)
Run-off Increase is likely in the Increase in seasons
summer where higher rainfall is
expected due to
inadequate Stormwater
management
Floods Frequency of floods to Increase in frequency and Increase from an
increase due to sea level severity increase in sea level,
rise and catchment- groundwater level and
driven flooding more frequent storms
Hot days Hot days (max. above Days above 32 will
35°C) per year will increase31
increase while cold Warmer days
nights (min. below 2°C)
per year will decrease
Fire Fire weather and severe Hotter summers and -
fire weather days are droughts will increase
both projected to frequency of fires
increase in summer and
spring
Drought More severe short-term In a severe drought now, -
droughts but less severe
medium to long-term
droughts
Coastline Erosion likely to increase Storm surges more Erosion ongoing but
on steeper slopes in the severe and frequent – there are protection
upper catchments higher erosion interventions installed
by the Danish Coastal
Authorities
Settlements Severe impacts on Informal settlements and Thyboron at high risk
settlements, properties on the because it is built on
infrastructure, shoreline will be at higher reclaimed land
properties and public risk
spaces such as beaches
Ecosystems Most vulnerable: low- Knysna estuary at threat -
lying coastal from pollution and
ecosystems, fragmented changes to ecosystem as
forests in the hinterland salinity increases
and saline wetlands in
the area32
ANNEX 3: C2C PROJECTS THAT LEMVIG IS PART OF
C9: The Thyborøn C17: Thyborøn City C21: Climatorium
Channel and the and Harbour
Western Limfjord
Project manager Lemvig Municipality Lemvig Mun Lemvig Vand og
Spildevand
Problem Rising water levels in Heavy, prolonged rain Need for innovation and
Limfjord events in Thyborøn business development in
Climate Change
Adaptation
Proposed Actions Develop projects that Develop solutions for Development of an
address climate challenges climate challenges in innovative showroom
in the Western part of Thyborøn and Haroøre, for climate development
Limfjord including innovative and tourism
pipelines with longer
lifetimes
Sub-project 1 Mapping of secondary Provide data of the Analysis of company
effects on project area project area and build a types suitable for
dynamic model climatorium and set up
interviews
Sub-project 2 Form ew cooperation with Dialogue with citizens Do feasibility study for
emergency management and other stakeholders tourism
Sub-project 3 Financial Planning Development of Prepare zoning plan
innovative pipelines
Sub-project 4 Develop conceptual Providing the basis for
designs and their decision-making
requirement specifications
Budget €1 158 598 €651 545 €376 107
Expected finish 30 June 2021 30 April 2022 21 August 2018
date
Municipal Lemvig, Holstebro, Morsø, Lemvig Lemvig
stakeholders Skive, Struer, Thisted,
Vesthimmerland
Utilities Lemvig Vand og Lemvig Vand og
stakeholders Spildevand , Spildevand
Morsø Forsyning
Skive Vand
Struer Forsyning
Thisted Spildevand
Vestforsyning A/S
Vesthimmerland Vand
Other Central Denmark Geopark West Jutland
stakeholders Government Danish Coastal Authority
Plastix of TripleNine33
ANNEX 4 TYPOLOGY TABLES FOR CASE STUDIES
Elements have been filled in with as much as could be found. The Danish case study proved to
be more difficult as most of the documents are in Danish. Some information could not be found
without extensive search through literature.
Ballina
Typology Elements Indicator Description
Ballina
A. Hazard and Susceptibility
Settlement location 28.86°S 153.56°E Centre of Ballina
Coastal erosion 20 – 45m inland shift Coastal Zone
of coastline by 2100 Management Plan
Located in tropical No, but have been
storm zone hit by cyclones in the
past. Also flooding
due to cyclones out
at sea
Slopes and angles
on or near the shore
Inland Rainfall 1842.8 mm Annual mean from
1992 - 2017
Base Rock Lismore Basalts
Alluvial plain soils
Coastal & dune
systems
Köppen–Geiger Cfa
climate classification
system
Inland rivers Richmond River
North Creek
Emigrant Creek
Isostatic rebound
Subsidence
Local/regional mass
density changes
Extent and likelihood Last major flood
of coastal and/or event in 1980s
fluvial flooding Regular flood threats
from king tides34
Groundwater
salination
B. Exposure and Vulnerability
Population 42 600
Future Population Increase, projected
Change 51 238 by 2036
Infrastructure Large portion of
buildings on low
elevation, on alluvial
sands and on
floodplain
Historical coastal
and/or fluvial
flooding
Available 17 995 dwellings in Ballina 2035
geographic/GIS data 2011; 27 251 Housing Needs &
projected by 2016 Opportunities
Analysis
HDI index (national) 0.939 Rank: 2
GNP (probably Gross regional (0.36% of NSW
national) product: A$ 1.895 Gross State product)
Billion
GNP: 45 970 US
PPP per capita
Proportion of 85% living within
national population 50km of the coast
that is coastal
Governance democratic
Historical areas
Environmental areas 1311 ha Nature Reserves
Cultural areas 861 ha indigenous protected
area
Tourism areas
Relationships to In NSW State
larger governmental
entities
Relationships to ICLEI: Climate
international entities Protection Program
Minority status Bundjalung 2016
Aboriginal people
and Torres Strait
Islander population
1372 (3.3%)35
KNYSNA
Typology Elements Indicators or Sources Note
metrics
KNYSNA
A. Hazard and Susceptibility
Settlement location 34.03 S 23.04 E Records, Link to CC
satellite, local forecasts,
data, GCMs assistance
agencies’ programs
Coastal erosion Satellite, To determine if the
records, settlement is
literature, local located on/near
knowledge erodible coasts
Located in tropical Extratropical cyclones From records Nature and
storm zone in the winter months and forecasts frequency of
impacts
Slopes and angles Steep mountain Satellite, Suggest/determine
on or near the shore slopes to the north, records, adaptation methods
slopes up to 10% on literature
inland plains, coastal
dune areas around
built-up area have
steep slopes
Inland Rainfall Storms will become Records or Need for interior
more intense, local protection
uncertain if average knowledge,
rainfall will increase GCMs
or decrease
Base Rock Fluvial sands, Records Determine physical
unconsolidated sands impacts through
and aeolianite as salination
cover sands but lies
on rocks dating back
to Gondwana
Köppen–Geiger Cfb System, Guide choice of
climate classification literature adaptation methods
system
Inland rivers Knysna River, Gouna Hydrologic Determine whether
River, Karatara River, data, literature there is a threat
Goukamma River from simultaneous
coastal and fluvial
floodingYou can also read