Steps on How to Calculate Noise Levels
←
→
Page content transcription
If your browser does not render page correctly, please read the page content below
Steps on How to Calculate Noise Levels
Go to the HUD’s Day/Night Noise Levels (DNL) Calculator here. Enter in the Project
Name, the date, and your name as requested.
What needs to be considered:
1. Major roadways within 1,000 feet of the project location (Road Source)
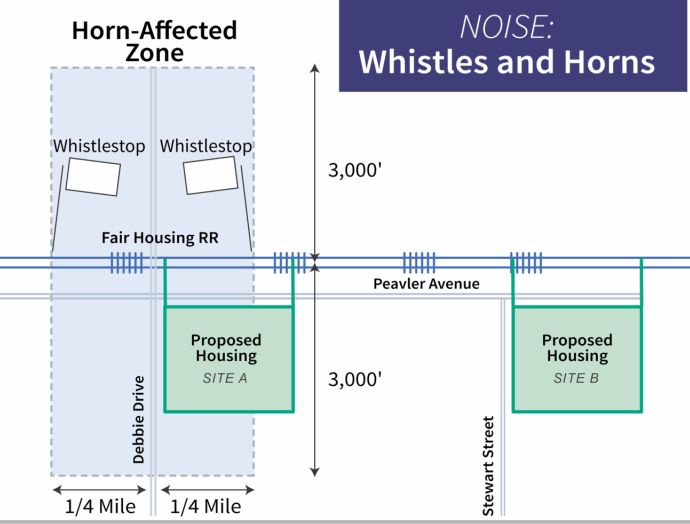
2. Railways within 3,000 feet of the project location (Rail Source)
3. Civilian or Military Airports within 15 miles of the project location (Airport
Source)
Road Source
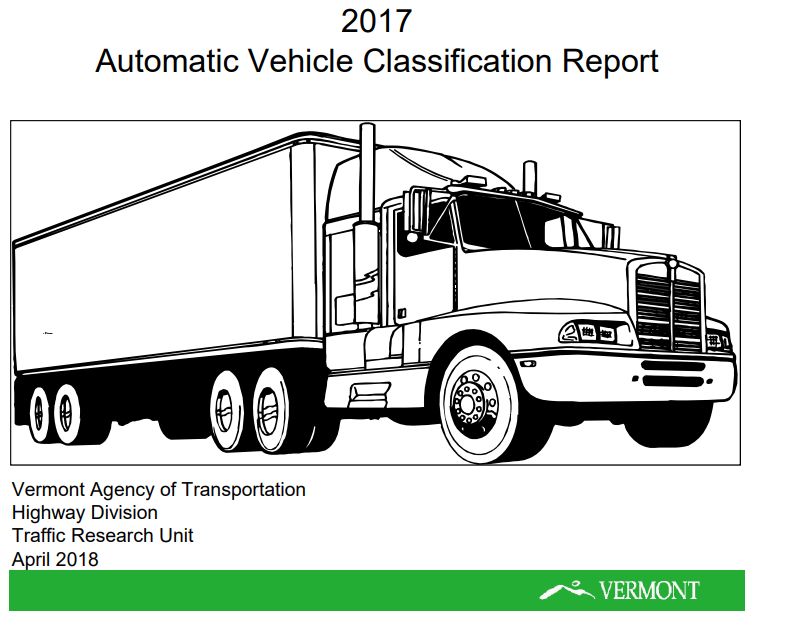
Step 1. Go to the most recent Automatic Vehicle Classification Report, currently 2017
and can be found here.
August 2018 1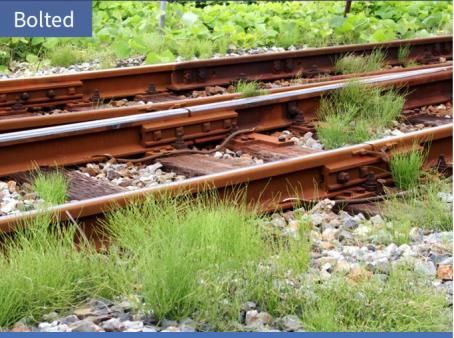
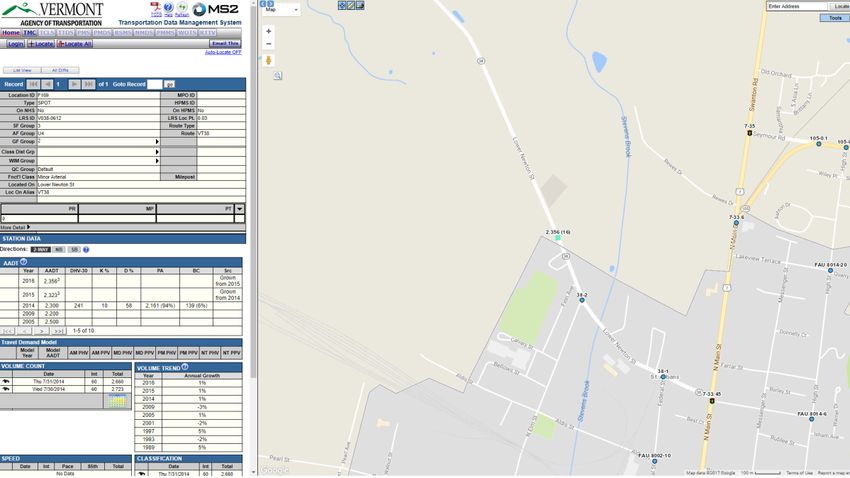
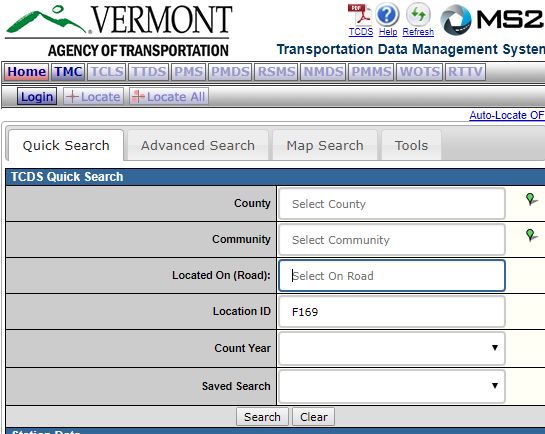
Step 2. Use the Find feature and search for the major road(s) that is/are closest to the
project location. If there are too many hits, search for the Town/City instead. If there is
no major roadway within 1,000 feet of the project location, a road source does not
need to be considered in the DNL Calculation.

Step 3. Scroll through all hits for the major street you are searching for until you find the
one in the correct Town/City that represents a similar location as the project.

Step 4. To verify the location of the traffic counts, search for the location ID (circled
above) in the VTrans Data Management System.

August 2018                                                                                   2
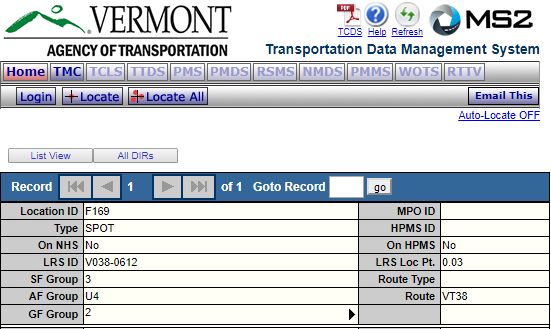
Step 5. The following screen will load in the sidebar, select locate to see the geographic
location of the traffic count.

Step 6. Repeat steps 3-5 for all Location ID’s that are for the applicable road in the
correct Town to determine which traffic count point is closest to the project location.

Step 7. Once the closest Location ID has been identified, take a screen shot of the
VTrans Data Management System location map to include as a supporting document for
the DNL Calculation.

August 2018                                                                                  3
Step 8. Go back to the Automatic Vehicle Classification Report and take a screen shot of
the full row of the location being used in the DNL calculation to include as a supporting
documentation for the DNL Calculation. It helps to highlight the entire row so that you
can accurately collect the correct data.

Step 9. Identify the Annual Average Daily Traffic (AADT). In this example, it is 2,300.

Step 10. Identify the percentage of passenger cars (PC) or Class 2 Car, in this example it
is 73.84%

August 2018                                                                                  4
Step 11. Identify the percentage of medium and heavy truck (found in the most-right
columns of the table). In this example, the percentage for medium trucks is 3.82% and
1.15% for heavy trucks.

Step 12. Calculate the Average Daily Trips (ADT) for cars. For this example, the AADT is
2,300 and the percentage of Cars is 73.84. Therefore, multiply 0.7384 by 2300, which is
1,698. This is the number that will be used to calculate the DNL.

Step 13. Calculate the ADT for medium and heavy trucks. 2,300 multiplied by 0.0382 =
87; and (2,300 * 0.0115) 26 for heavy trucks.

Step 14. Return to HUD’s DNL Calculator, select Add Road Source.

August 2018                                                                                5
Step 15. Type in the Street Name and select cars, medium trucks, and heavy trucks, as
indicated below.

August 2018                                                                             6
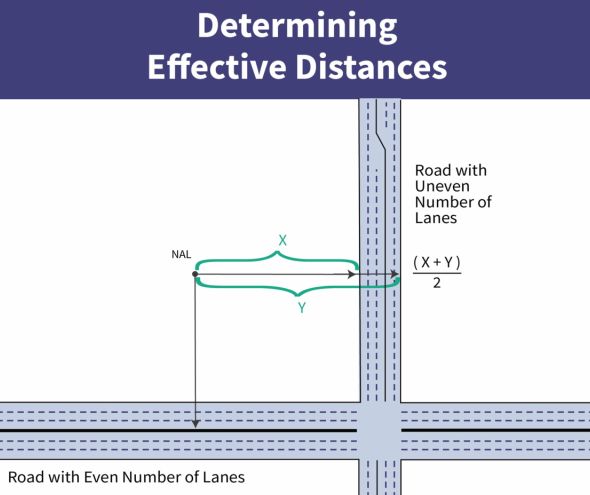
Step 16. Fill out the Effective Distance. When measuring distance, the Noise Assessment
Location (NAL) should be used: 6.5 feet (or 2 meters) in front of the façade of the
existing or proposed building (large projects may have more than one NAL), to the road.
From the NAL:
   1. Measure to the near
      edge of the nearest lane
   2. Measure to the far
      edge of the farthest lane
   3. Add and divide by two
      (See illustration to the right,
      courtesy of HUD’s WISER
      webinar)
These measurements can be made
using the “measure” function
in Google Maps. For this example,
we’ll use 100 feet. If Google Maps
are used for measurements, take a
screenshot of the map showing the
measurement to include as a
supporting documentation for the DNL Calculation.

Step 17. Fill out the Distance to Stop Sign (Note: stop lights are not equivalent to stop
signs, stoplights do not have to be considered). This is in feet and should be from the
NAL to the nearest stop sign (only stop signs within 600 feet need to be considered).
For this example, we’ll use 145 feet.

Step 18. Fill out the Average Speed. This should be the road speed limit. For this
example, we’ll use 25 mph.

Step 19. Fill out the ADT for Cars, Medium Trucks, and Heavy Trucks. Remember this
requires computing the percentage per vehicle type of the Average Annual Daily Traffic
(see Steps 9-13).

Step 20. Fill out the Night Fraction of ADT. This is usually 15.

Step 21. Fill out the Road Gradient. This refers to the uphill road gradient and is usually
2. If road is a on slope, the grade should be calculated. Elevation data can be found on
NEPAssit using the USGS National Map as a base map, or on the Vermont ANR Atlas
using the Slope Layer.

August 2018                                                                                   7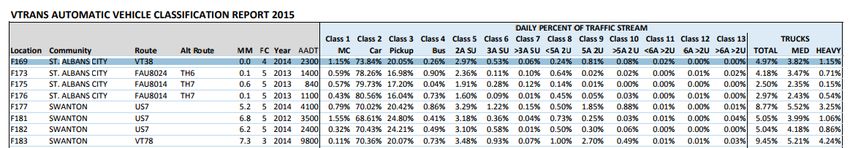
Step 22. Once all information has been entered, select Calculate Road #1 DNL. The DNL
will populate as shown below. Select Add Road Source if the proposed project location
is within 1,000 feet of more than one major road and repeat steps 1-22.

August 2018                                                                         8
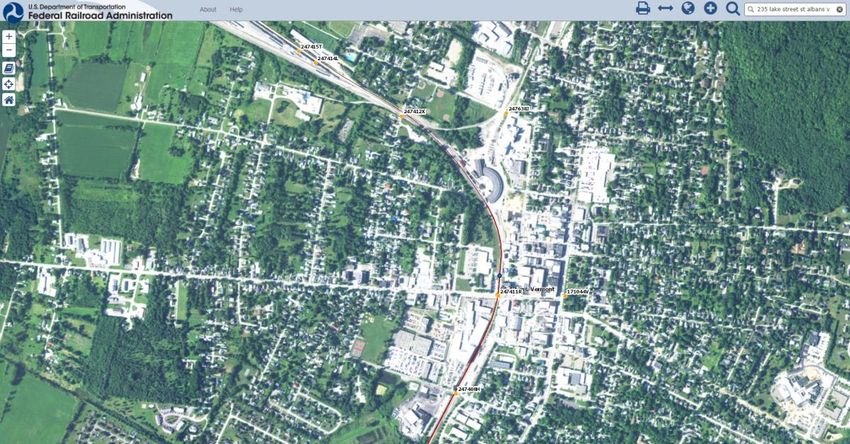
Rail Source

Step 23. Use the Federal Railroad Administration (FRA), Office of Safety Analysis
Mapping Tool to identify the railroad tracks within 3,000 feet of the project location.
Type in the project address (street address, town, state) in the search bar in the upper
right-hand corner and hit enter.

Step 24. Zoom out to identify all railroads and crossings within 3,000 feet from the
project location, you can use the measure tool to estimate a 3,000-foot radius.

Note: You can also use the NEPAssist Tool to identify railroads within 3,000 feet of your
project location by adding a buffer with a 3,000 foot radius and using the “Railroads”
layer found under the “Transportation” heading. You will still need to return to the FRA
Mapping Tool to find the correct crossing # for the applicable railroad.

August 2018                                                                                 9
Step 25. For each track within 3,000 feet of the project location, determine which
crossing is closest to the project location (the # of the closest crossing is the one you will
use to generate a report in Step 26). Use the measure tool to determine the effective
distance (See Step 15) between the project location’s NAL and the railroad track, take a
screen shot. A screen shot showing the FRA Map should still be included as a supporting
document even if there are no crossings within 3,000 feet of the project location.

Step 26. Once all applicable tracks/railroad crossings have been identified and their
effective distances have been determined, go to the Crossing Report Generator of the
FRA, Office of Safety Analysis website. Enter the crossing number and select “Generate
Report.”

August 2018                                                                                 10
Step 27. A PDF document will be generated, save this to be included as a supporting
document for the DNL Calculation. Scroll down to the bottom of Page 1, Part II: Railroad
Information. This information will be needed for the DNL Calculation (Step 29). If 1A and
1B are zero, this means that the railroad crossing is not in service. For crossings that are
not in service, the Crossing Inventory Form should still be included as a supporting
document for the DNL Calculation to support the crossing’s inactivity.

Step 28. Go back to the HUD DNL Calculator, select Add Rail Source, the below form will
populate.

August 2018                                                                               11
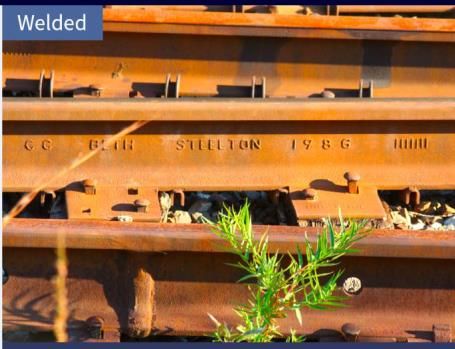
Step 29. Resources for the necessary information:

Electric or Diesel: Information available from the railway operator or supervisor of
customer relations for the railway.
Effective Distance: Railroad distances should measure from a center of a single track or
the middle of a set of tracks. Use the measurement (in feet) taken from the Federal
Railroad Administration map.
Average Train Speed: See #3 of the Crossing Inventory Form.
Engines per Train: Information available from the railway operator or supervisor of
customer relations for the railway. If unknown use 2 for diesel and 1 for electric.
Railway cars per Train: Information available from the railway operator or supervisor of
customer relations for the railway. If unknown use 50 for diesel and 8 for electric.
Average Train Operations (ATO): See #1A of the Crossing Inventory Form.
Night Fraction of ATO: See #1B of the Crossing Inventory Form.
Railway whistles or horns: Whistle-stops and horns are typically used one-quarter mile
before a crossing in each direction. If the segment of track is not directly across from the
site’s property line don’t include the whistles, their sound is very directional. See the
illustration below (courtesy of HUD’s WISER webinar).

August 2018                                                                               12
Bolted Tracks (Y/N): This information is most easily gathered from a site visit (of course,
use caution when inspecting the tracks), or by contacting the railway operator or
supervisor of customer relations for the railway.

Images courtesy of HUD’s WISER webinar.

Step 30. Once all information has been entered, select Calculate Rail #1 DNL. The DNL
will populate as shown below. Select Add Rail Source for each railroad track within
3,000 feet of the proposed project location.

August 2018                                                                              13
Airport Source

Step 31. If the project location is within 15 miles of any airports, the corresponding
noise contour map should be consulted (the only airport in Vermont with enough
operation per year to warrant a noise contour study is Burlington International Airport).
If the project location falls within the DNL contours indicated on the map, include in the
DNL Calculation. If applicable, include the contour map with the project location
identified as a supporting document for the DNL Calculation (if the project is not within
15 miles of an airport, no contour maps have to be included). Please Note: An update of
the Burlington International Airport Noise Exposure Map (NEM)/Noise Contour Map is
scheduled to begin in 2018/2019 to account for the F35 Fighter Jets that the Vermont
Air National Guard is slated to receive in 2019. Once available the updated NEM/Noise
Contour Map should be used (even if the F35s are not yet being used).

Step 32. Once all applicable road sources, rail sources, and/or airport sources have been
calculated, select Calculate at the bottom and the Combined DNL Calculation will
populate. Save the DNL Calculation webpage as a PDF. Combine all DNL Calculation
supporting documents into a single PDF file and upload to the Supporting
Documentation page in GEARS. Determine if the DNL meets HUD’s requirements and
discuss in the checklist. Review HUD’s noise requirements here. Contact the
Environmental Officer for an example of a complete DNL Calculation with applicable
supporting documents if desired.

August 2018                                                                             14
You can also read