Strategic Income Allocation (SIA) - July 2021 - Deutsche Bank Wealth ...
←
→
Page content transcription
If your browser does not render page correctly, please read the page content below
Deutsche Bank
   Wealth Management

                    Strategic Income
                    Allocation (SIA)

                    July 2021

This material is intended for: Professional and Accredited Investors in Hong Kong and Singapore respectively; for Professional Clients as defined by the Dubai Financial
Services Authority and for investors outside of the U.S., Japan and the European Economic Area (“EEA”). Furthermore this material is provided to addressee only, further
distribution of this material is strictly prohibited.
Strategic Income Allocation (SIA)
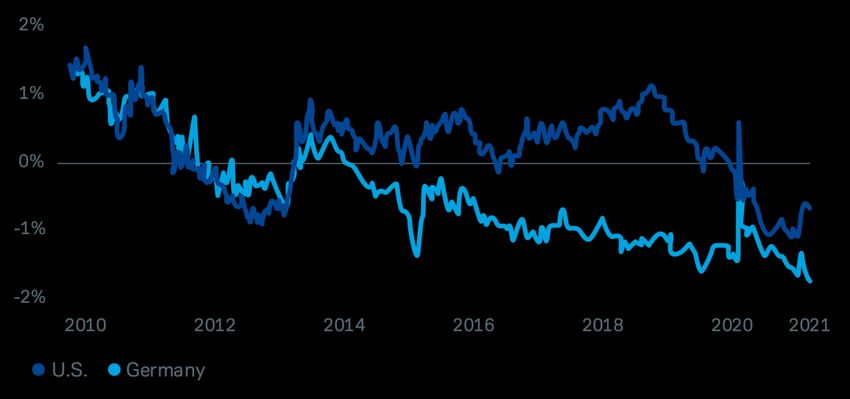
Investors should be aware
of persistent negative real rates
Financial repression: still 10-year inflation-indexed government bond yield comparison
restraining real rates looks at
central banks’ use of
monetary policy to hold
down real interest rates.
This so-called “financial
repression” carries a number
of policy risks and creates
challenges for investors.
Source: Bloomberg Finance LP., Deutsche Bank AG as of 9 April 2021
No assurance can be given that any investment objective or forecast or target can be achieved. Forecasts are based on assumptions, estimates, opinions and hypothetical models
which may prove to be incorrect. Past performance is not indicative of future returns. Investments come with risk and the value of an investment can fall as well as rise and you
might not get back the amount originally invested at any point in time. The product descriptions are for information purpose only instead of invitation for investment. Investors may
wish to consult their independent financial advisers. Please refer to the respective investment offering documents; the Important Information/Risk Warning at the end of the
presentation for further details.
2Strategic Income Allocation (SIA)
Fixed income:
positive yields require risk acceptance
Yields and duration of different bond market segments
Source: Deutsche Bank AG, Datastream; data as of 30 April 2021
No assurance can be given that any investment objective or forecast or target can be achieved. Forecasts are based on assumptions, estimates, opinions and hypothetical models
which may prove to be incorrect. Past performance is not indicative of future returns. Investments come with risk and the value of an investment can fall as well as rise and you
might not get back the amount originally invested at any point in time. The product descriptions are for information purpose only instead of invitation for investment. Investors may
wish to consult their independent financial advisers. Please refer to the respective investment offering documents; the Important Information/Risk Warning at the end of the
presentation for further details.
3Strategic Income Allocation (SIA)
Equity dividend yield
Regional dividend yield development over the past 10 years
Source: Deutsche Bank AG, Bloomberg Financial L.P.; data as of 30 April 2021
No assurance can be given that any investment objective or forecast or target can be achieved. Forecasts are based on assumptions, estimates, opinions and hypothetical models
which may prove to be incorrect. Past performance is not indicative of future returns. Investments come with risk and the value of an investment can fall as well as rise and you
might not get back the amount originally invested at any point in time. The product descriptions are for information purpose only instead of invitation for investment. Investors may
wish to consult their independent financial advisers. Please refer to the respective investment offering documents; the Important Information/Risk Warning at the end of the
presentation for further details.
4Strategic Income Allocation (SIA)
Strategic Income Allocation (SIA) –
A modern income portfolio
Our two SIA Plus strategies2
For illustrative purposes only
Aims for
income Multi-asset Conservative Plus
generation portfolio • Target distribution 2% p.a.2
2% •
•
Equity/fixed income approach
Equity max. 60%
• Risk budget -10% p.a.1
ETF-based Systematic Emphasises wealth
hedging to preservation over time
manage
tail risk1
Balanced Plus
Covered • Indicative target distribution 4% p.a.2
call writing
for extra 4% •
•
Focused on equities
Equity max. 80%
yield • Risk budget -20% p.a.1
opportunity
Balanced portfolio
approach
Equity Fixed Income Liquidity Derivatives
1 Refers to Risk Return Engineering and Plus strategies: Plus means continuous portfolio hedging so that a targeted lower value limit is met with a high probability (99%). This does
not constitute a loss limitation commitment or capital guarantee or a statement by the Bank that it will be able to comply with the targeted loss limitation. In particular, the
targeted loss limitation does not rule out the possibility of higher losses arising (no capital protection). The hedging can lead to a reduction in the return.
2 Distributions are not guaranteed and can vary over time including zero distribution. Source: Deutsche Bank Wealth Management, 5 May 2021
No assurance can be given that any investment objective or forecast or target can be achieved. Forecasts are based on assumptions, estimates, opinions and hypothetical models
which may prove to be incorrect. Past performance is not indicative of future returns. Investments come with risk and the value of an investment can fall as well as rise and you
might not get back the amount originally invested at any point in time. The product descriptions are for information purpose only instead of invitation for investment. Investors may
wish to consult their independent financial advisers. Please refer to the respective investment offering documents; the Important Information/Risk Warning at the end of the
presentation for further details.
5Strategic Income Allocation (SIA)
Our approach
Features
Global CIO Profiles1
Expertise for strategic
asset allocation Conservative Plus and Balanced Plus
Indicative target distribution2
Efficiency
2% or 4% p.a. with semi-annual payout
Distributions2 and protection1
ETF portfolio
Dividends, coupons,
and option premium with systematic
management against
tail risks Target risk budget (99%)1
-10% and -20% p.a.
1 Refers to Plus strategies: Plus means continuous portfolio hedging so that a targeted lower value limit is met with a high probability (99%). This does not constitute a loss
limitation commitment or capital guarantee or a statement by the Bank that it will be able to comply with the targeted loss limitation. In particular, the targeted loss limitation
does not rule out the possibility of higher losses arising (no capital protection). The hedging can lead to a reduction in the return.
2 The share class for the Conservative Plus Fund targets a distribution of 2% per annum. The share class for Balanced Plus targets a distribution of 4% per annum. Distribution
amounts are not guaranteed and are purely indicative. The targeted distribution amounts depend on various factors, such as market developments and the composition of the
portfolio, and may be subject to change without notice. Actual determined distributions may therefore differ over time or may even be zero.
Source: Deutsche Bank Wealth Management, 5 May 2021
No assurance can be given that any investment objective or forecast or target can be achieved. Forecasts are based on assumptions, estimates, opinions and hypothetical models
which may prove to be incorrect. Past performance is not indicative of future returns. Investments come with risk and the value of an investment can fall as well as rise and you
might not get back the amount originally invested at any point in time. The product descriptions are for information purpose only instead of invitation for investment. Investors may
wish to consult their independent financial advisers. Please refer to the respective investment offering documents; the Important Information/Risk Warning at the end of the
presentation for further details.
6Strategic Income Allocation (SIA)
Global diversification with ETFs covering
main asset classes
Investment universe for indication only. Actual implementation differs and changes.
Equities High-yield bonds
Over 1250 companies Over 1500 issuances
Listed infrastructure Corporate bonds
Over 200 companies Over 8000 bonds
Listed real estate Sovereign bonds
Over 320 companies Over 1000 bonds
Forecasts are based on assumptions, estimates, opinions and hypothetical models or analysis which may prove to be incorrect. Shown data are indicative based on own research
using publicly available information as of Q4 2020. The numbers reflect the theoretical investment universe and may not reflect the investment universe of the selected investment
profile. Source: Deutsche Wealth Management, as of 5 May 2021
No assurance can be given that any investment objective or forecast or target can be achieved. Forecasts are based on assumptions, estimates, opinions and hypothetical models
which may prove to be incorrect. Past performance is not indicative of future returns. Investments come with risk and the value of an investment can fall as well as rise and you
might not get back the amount originally invested at any point in time. The product descriptions are for information purpose only instead of invitation for investment. Investors may
wish to consult their independent financial advisers. Please refer to the respective investment offering documents; the Important Information/Risk Warning at the end of the
presentation for further details.
7Strategic Income Allocation (SIA)
Combining pockets of income to strive for
uncorrelated and robust sourcing
Deutsche Bank Wealth Management CIO1 View
Plus Strategy2
Dividends
Global Strategic
investment Coupons Portfolio income
universe optimization portfolio
Option premium
Integration of risk management into investment process
aiming for systematic tail risk management.
1. CIO stands for Chief Investment Office
2. Plus Strategy means continuous portfolio hedging so that a targeted lower value limit is met with a high probability (99%). This does not constitute a loss limitation commitment
or capital guarantee or a statement by the Bank that it will be able to comply with the targeted loss limitation. In particular, the targeted loss limitation does not rule out the
possibility of higher losses arising (no capital protection). The hedging can lead to a reduction in the return. Source: Deutsche Bank Wealth Management, 5 May 2021
No assurance can be given that any investment objective or forecast or target can be achieved. Forecasts are based on assumptions, estimates, opinions and hypothetical models
which may prove to be incorrect. Past performance is not indicative of future returns. Investments come with risk and the value of an investment can fall as well as rise and you
might not get back the amount originally invested at any point in time. The product descriptions are for information purpose only instead of invitation for investment. Investors may
wish to consult their independent financial advisers. Please refer to the respective investment offering documents; the Important Information/Risk Warning at the end of the
presentation for further details.
8Strategic Income Allocation (SIA)
Sources of potential income
Equities ETFs
The possibility for capital appreciation over time and dividend streams
from well-diversified indices are an important element of the portfolio
structure and the distributable income. Equity has volatility risk.
Fixed income ETFs
Fixed Income is an important source of income with recurring coupons.
Using ETFs on main fixed income indices, a diversified exposure to
issuers and maturities can be achieved.
Covered call writing
Covered call writing on equity indices aims to generate an additional
source of income on an opportunistic basis. Typically this is done on
main equity market indices. The risk and opportunities of a covered call
writing strategy are explained on page 11.
There is no guarantee that investment objectives or return expectations may be realized. Past performance is not indicative of future returns. Investments come with risk. The value
of an investment can fall as well as rise and you might not get back the amount originally invested at any point in time. Your capital may be at risk. Source: Deutsche Wealth
Management, as of 5 May 2021
No assurance can be given that any investment objective or forecast or target can be achieved. Forecasts are based on assumptions, estimates, opinions and hypothetical models
which may prove to be incorrect. Past performance is not indicative of future returns. Investments come with risk and the value of an investment can fall as well as rise and you
might not get back the amount originally invested at any point in time. The product descriptions are for information purpose only instead of invitation for investment. Investors may
wish to consult their independent financial advisers. Please refer to the respective investment offering documents; the Important Information/Risk Warning at the end of the
presentation for further details.
9Strategic Income Allocation (SIA)
Potential sources of income –
Equities ETFs and fixed income ETFs
Equities ETFs Fixed income ETFs
Analysing main equity markets, regions and DWS takes an unconstrained view across
sectors we assess the attractiveness of the asset regions, ratings and currencies. Diversified
class for an income-oriented investor. DWS ETFs provide investors with the opportunity
favours diversified indices to capture market to capture yield, while not compromising on
exposure and distributable income, including: diversification, including.:
• Indices covering developed markets • Corporate bonds
• Emerging market indices with dividend focus • Emerging market bonds
• Listed infrastructure and real estate1 • High yield bonds
Global exposure for equities and fixed income
EMEA US APAC China Japan
1Investments may be classified as Alternative Investments in the reporting.
There is no guarantee that investment objectives or return expectations may be realized. Past performance is not indicative of future returns. Investments come with risk. The value
of an investment can fall as well as rise and you might not get back the amount originally invested at any point in time. Your capital may be at risk. Source: Deutsche Wealth
Management, as of 5 May 2021
No assurance can be given that any investment objective or forecast or target can be achieved. Forecasts are based on assumptions, estimates, opinions and hypothetical models
which may prove to be incorrect. Past performance is not indicative of future returns. Investments come with risk and the value of an investment can fall as well as rise and you
might not get back the amount originally invested at any point in time. The product descriptions are for information purpose only instead of invitation for investment. Investors may
wish to consult their independent financial advisers. Please refer to the respective investment offering documents; the Important Information/Risk Warning at the end of the
presentation for further details.
10Strategic Income Allocation (SIA)
Sources of potential income –
Covered call writing
Covered call writing What happens when What happens when
(CCW) strategy1 markets are rising? markets are falling?
• Combination of a long position • Covered call position accumulates • Long equity position
in an equity index with the sale premium and participates in upside participates in downside
of out-of-the-money call stock price up to the call strike. performance.
options on the same index. • Opportunity to enhance equity • Call options expire worthless.
• Return through option returns up to the call strike. • Reduced drawdown in a
premiums, but performance combined view of equity and
capped at strike of the option. received option premium.
Long-term studies show that covered call writing can help to generate additional income while staying
invested in equities over time. Income can vary over time.
1 Call Writing Strategy: The fund may sell call options on the underlying portfolio or portfolio related positions (i.e. options on broad market equity indices, bond indices or
commodity indices) in order to receive a premium and increase the income. Selling call options generally results in the sub-fund not or only partially participating in price
increases of the underlying assets. On the other hand participation in price losses is reduced by the amount of the option premiums received. Selling call options on portfolio-
related positions may increase the basis risk. There is no guarantee that investment objectives or return expectations may be realized. Past performance is not indicative of future
returns. Investments come with risk. The value of an investment can fall as well as rise and you might not get back the amount originally invested at any point in time. Your capital
may be at risk. Source: Deutsche Wealth Management, as of 5 May 2021
No assurance can be given that any investment objective or forecast or target can be achieved. Forecasts are based on assumptions, estimates, opinions and hypothetical models
which may prove to be incorrect. Past performance is not indicative of future returns. Investments come with risk and the value of an investment can fall as well as rise and you
might not get back the amount originally invested at any point in time. The product descriptions are for information purpose only instead of invitation for investment. Investors may
wish to consult their independent financial advisers. Please refer to the respective investment offering documents; the Important Information/Risk Warning at the end of the
presentation for further details.
11Strategic Income Allocation (SIA)
Protection against tail risk –
Plus Strategies
Equity markets move up Equity markets move down
While investors tend to
Market performance
Market performance
underestimate the
probability of extreme
events, staying invested Risk tolerance
over a long time horizon
seems to be the best way Time Time
Benefit from higher equity exposure, which Risk management aims to limit portfolio risk
to capture the risk helps to increase long-term risk-adjusted and supports investors to stay invested
premium in markets. in return expectations. throughout volatile markets. No capital
protection or guarantee at any time.
markets.
• Integration of risk management into • Analysis include empirical return
investment process distributions
• Risk budget (99%) on daily rolling basis for • Extensive portfolio analysis
Integration a 12-month horizon
Reliability
• Forward-looking illustration of risk • Performance of additional tests of
robustness
• Implementation via plain-vanilla hedging
Transparency instruments Robustness • 99% confidence interval
There is no guarantee that investment objectives or return expectations may be realized. Past performance is not indicative of future returns. Investments come with risk. The value
of an investment can fall as well as rise and you might not get back the amount originally invested at any point in time. Your capital may be at risk. Source: Deutsche Wealth
Management, as of 5 May 2021
No assurance can be given that any investment objective or forecast or target can be achieved. Forecasts are based on assumptions, estimates, opinions and hypothetical models
which may prove to be incorrect. Past performance is not indicative of future returns. Investments come with risk and the value of an investment can fall as well as rise and you
might not get back the amount originally invested at any point in time. The product descriptions are for information purpose only instead of invitation for investment. Investors may
wish to consult their independent financial advisers. Please refer to the respective investment offering documents; the Important Information/Risk Warning at the end of the
presentation for further details.
12Strategic Income Allocation (SIA)
Available investment profiles
EUR / USD EUR / USD
Conservative Plus Balanced Plus
Target loss limitation / risk budget (99%)1 ca. -10% ca. -20%
Risk management approach Risk budget (99%) with rolling 12 months horizon on daily basis.
Indicative distribution target p.a.2 2% 4%
Asset classes with higher risk3 0-60% 30-80%
Cash and fixed income investments3 0-100% 0-70%
Alternatives3 0-15% 0-15%
1 If the targeted loss limitation is reached, the Bank will not automatically sell portfolio positions; rather further actions shall be taken based on the current market expectations of
the Bank. The targeted loss limitation does not exclude the possibility that bigger losses may result (no capital protection).
2 Distribution targets are not guaranteed and are purely indicative. The targeted distribution amounts depend on various factors, such as market developments and the
composition of the portfolio and may be subject to change without notice. Actual determined distributions may therefore differ over time or may even be zero.
3 Asset Class ranges are indicative and depend on the evolution of financial markets (including DB WM market outlook, asset valuation levels, real and implied volatility levels), and
how those factors conjunctively influence the risk-return-profile of the mandate.
Indicative and subject to local booking center regulation. The lending value may be lower.
There is no guarantee that investment objectives or return expectations may be realized. Past performance is not indicative of future returns. Investments come with risk. The value
of an investment can fall as well as rise and you might not get back the amount originally invested at any point in time. Your capital may be at risk. Source: Deutsche Wealth
Management, as of 5 May, 2021
No assurance can be given that any investment objective or forecast or target can be achieved. Forecasts are based on assumptions, estimates, opinions and hypothetical models
which may prove to be incorrect. Past performance is not indicative of future returns. Investments come with risk and the value of an investment can fall as well as rise and you
might not get back the amount originally invested at any point in time. The product descriptions are for information purpose only instead of invitation for investment. Investors may
wish to consult their independent financial advisers. Please refer to the respective investment offering documents; the Important Information/Risk Warning at the end of the
presentation for further details.
13Strategic Income Allocation (SIA)
Strategic Income Allocation (SIA) Investment profiles
USD
SIA USD Conservative Plus1 SIA USD Balanced Plus1
Distribution target2 Distribution target2
2% p.a 4% p.a
Risk Budget1 (99%) Risk Budget1 (99%)
Indicative target Indicative target
allocation -10% p.a.. allocation
-20% p.a..
Liquidity 1% Fixed Income 71% Liquidity 1% Fixed Income 48%
Equity 27 % Derivatives 1% Equity 50% Derivatives 1%
Solution description:
Well diversified ETF portfolio investing into equities and fixed income on a global scale geared towards distribution
On opportunistic basis, covered call writing on index level is used to generate option premia
Systematic and efficient down-side protection with defined risk budget (99%) through Risk Return Engineering
1) Plus means continuous portfolio hedging so that a targeted lower value limit is met with a high probability (99%). This does not constitute a loss limitation commitment or
capital guarantee or a statement by the Bank that it will be able to comply with the targeted loss limitation. In particular, the targeted loss limitation does not rule out the
possibility of higher losses arising (no capital protection). The hedging can lead to a reduction in the return.
2) Distribution targets are not guaranteed and are purely indicative. The targeted distribution amounts depend on various factors, such as market developments and the
composition of the portfolio and may be subject to change without notice. Actual determined distributions may therefore differ over time or may even be zero.
There is no guarantee that investment objectives or return expectations may be realized. Past performance is not indicative of future returns. Investments come with risk. The value
of an investment can fall as well as rise and you might not get back the amount originally invested at any point in time. Your capital may be at risk. Source: Deutsche Wealth
Management, as of 5 May, 2021
No assurance can be given that any investment objective or forecast or target can be achieved. Forecasts are based on assumptions, estimates, opinions and hypothetical models
which may prove to be incorrect. Past performance is not indicative of future returns. Investments come with risk and the value of an investment can fall as well as rise and you
might not get back the amount originally invested at any point in time. The product descriptions are for information purpose only instead of invitation for investment. Investors may
wish to consult their independent financial advisers. Please refer to the respective investment offering documents; the Important Information/Risk Warning at the end of the
presentation for further details.
14Strategic Income Allocation (SIA)
Strategic Income Allocation (SIA) Investment profiles
EUR
SIA EUR Conservative Plus1 SIA EUR Balanced Plus1
Distribution target2 Distribution target2
2% p.a 4% p.a
Risk Budget1 (99%) Risk Budget1 (99%)
Indicative target Indicative target
allocation -10% p.a.. allocation
-20% p.a..
Liquidity 1% Fixed Income 72% Liquidity 2% Fixed Income 40%
Equity 26 % Derivatives 1% Equity 58% Derivatives 1%
Solution description:
Well diversified ETF portfolio investing into equities and fixed income on a global scale geared towards distribution
On opportunistic basis, covered call writing on index level is used to generate option premia
Systematic and efficient down-side protection with defined risk budget (99%) through Risk Return Engineering
1) Plus means continuous portfolio hedging so that a targeted lower value limit is met with a high probability (99%). This does not constitute a loss limitation commitment or
capital guarantee or a statement by the Bank that it will be able to comply with the targeted loss limitation. In particular, the targeted loss limitation does not rule out the
possibility of higher losses arising (no capital protection). The hedging can lead to a reduction in the return.
2) Distribution targets are not guaranteed and are purely indicative. The targeted distribution amounts depend on various factors, such as market developments and the
composition of the portfolio and may be subject to change without notice. Actual determined distributions may therefore differ over time or may even be zero.
There is no guarantee that investment objectives or return expectations may be realized. Past performance is not indicative of future returns. Investments come with risk. The value
of an investment can fall as well as rise and you might not get back the amount originally invested at any point in time. Your capital may be at risk. Source: Deutsche Wealth
Management, as of 5 May, 2021
No assurance can be given that any investment objective or forecast or target can be achieved. Forecasts are based on assumptions, estimates, opinions and hypothetical models
which may prove to be incorrect. Past performance is not indicative of future returns. Investments come with risk and the value of an investment can fall as well as rise and you
might not get back the amount originally invested at any point in time. The product descriptions are for information purpose only instead of invitation for investment. Investors may
wish to consult their independent financial advisers. Please refer to the respective investment offering documents; the Important Information/Risk Warning at the end of the
presentation for further details.
15Strategic Income Allocation (SIA)
Strategic Income Allocation USD (SIA)
Indicative statistics. Actual implementation may differ
Name ETF Distribution % Allocation Conservative % Allocation Balance %
Cash 1.34% 1.49%
Fixed Income Total 71.00% 48.00%
Government bonds and mortgage bonds (Pfandbriefe) 39.00% 9.00%
iShares $ Treasury Bond 1-3yr UCITS ETF USD (Dist) 1.11% 18.00%
XtrackersUS Treasuries 1-3 UCITS ETF 1D 1.81% 4.00%
iShares $ Treasury Bond 3-7yr UCITS ETF USD (Dist) 1.40% 13.00%
iShares $ Treasury Bond 7-10yr UCITS ETF USD (Dist) 2.02% 4.00% 9.00%
Corporate bonds InvestmentGrade 22.00% 16.00%
Xtrackers USD Corporate Bond UCITS ETF 1D 3.51% 18.00% 16.00%
AMUNDI PRIME US CORPORATES- UCITS ETF DR (D) 3.40% 4.00%
Corporate Bonds HighYield 5.00% 13.00%
Xtrackers USD High Yield Corporate Bond UCITS ETF 1D 5.53% 5.00% 13.00%
EM Bonds 5.00% 10.00%
Xtrackers USD Emerging Markets Bond UCITS ETF 2D 4.62% 5.00% 10.00%
Equity Total 27.00% 50.00%
Equities Europe 8.00% 11.00%
Xtrackers EURO STOXX Quality Dividend UCITS ETF 1D 5.40% 8.00% 11.00%
Equities UK 2.00%
iShares UK Dividend UCITS ETF GBP (Dist) 3.54% 2.00%
Equities US / Global 12.00% 22.00%
Fidelity US Quality Income UCITS ETF 2.76% 10.00% 14.00%
iShares Developed Markets Property Yield UCITS ETF (Dist) 2.62% 5.00%
iShares Global Infrastructure UCITS ETF (Dist) 2.08% 2.00% 3.00%
Equities Japan 2.00% 2.00%
UBS ETF (LU) MSCI Japan UCITS ETF (JPY) A-dis 1.54% 2.00% 2.00%
Equities EM 5.00% 13.00%
iShares Emerging Markets Dividend UCITS ETF (Dist) 4.32% 5.00% 13.00%
Derivatives 0.66% 0.51%
Short Call SX5E 06/22 C4450 Index -0.11% -0.15%
Short Call SPX 06/22 C4650 Index -0.26% -0.36%
Short Call UKX 06/22 C7700 Index -0.03%
Long Put spx 06/22 p3750 index 0.71%
Long Put sx5e 06/22 p3750 index 0.32%
Long Put spx 06/22 p2950 index 0.35%
Long Put sx5e 06/22 p2950 index 0.10%
Long Put spx 06/22 p3550 index 0.40%
Long Put sx5e 06/22 p3500 index 0.20%
Total 100.00% 100.00%
There is no guarantee that investment objectives or return expectations may be realized. Past performance is not indicative of future returns. Investments come with risk. The value
of an investment can fall as well as rise and you might not get back the amount originally invested at any point in time. Your capital may be at risk. Source: Deutsche Wealth
Management, as of 5 May, 2021. No assurance can be given that any investment objective or forecast or target can be achieved. Forecasts are based on assumptions, estimates,
opinions and hypothetical models which may prove to be incorrect. Past performance is not indicative of future returns. Investments come with risk and the value of an investment
can fall as well as rise and you might not get back the amount originally invested at any point in time. The product descriptions are for information purpose only instead of invitation
for investment. Investors may wish to consult their independent financial advisers. Please refer to the respective investment offering documents; the Important Information/Risk
Warning at the end of the presentation for further details.
16Strategic Income Allocation (SIA)
Strategic Income Allocation EUR (SIA)
Indicative statistics. Actual implementation may differ
Name ETF Distribution % Allocation Conservative % Allocation Balance %
Cash 1.33% 1.63%
Fixed Income Total 72.00% 40.00%
Government bonds and mortgage bonds (Pfandbriefe) 24.00% 5.00%
iShares $ Treasury Bond 1-3yr UCITS ETF EUR Hedged (Acc) 10.00%
iShares $ Treasury Bond 3-7yr UCITS ETF EUR Hedged (Dist) 1.32% 8.00%
iShares $ Treasury Bond 7-10yr UCITS ETF EUR Hedged (Dist) 1.64% 6.00%
Lyxor Core US Treasury 10+Y (DR) UCITS ETF - Dist 2.59% 5.00%
Corporate bonds InvestmentGrade 23.00% 10.00%
Amundi Prime Euro Corporates - UCITS ETF DR 1.39% 18.00% 10.00%
iShares Core € Corp Bond UCITS ETF EUR (Dist) 0.87% 5.00% 0.00%
Corporate Bonds High Yield 10.00% 10.00%
Xtrackers II EUR High Yield Corporate Bond UCITS ETF - 1D 2.24% 10.00% 10.00%
EM Bonds 15.00% 15.00%
iShares J.P. Morgan $ EM Bond EUR Hedged UCITS ETF (Dist) 3.87% 15.00% 10.00%
Xtrackers USD Emerging Markets Bond UCITS ETF 2D 4.62% 5.00%
Equity Total 26.00% 58.00%
Equities Europe 10.00% 20.00%
Xtrackers EURO STOXX Quality Dividend UCITS ETF 1D 5.40% 10.00% 18.00%
iShares EURO STOXX Select Dividend 30 UCITS ETF (DE) (Dist) 3.01% 2.00%
Equities UK 2.00% 3.00%
iShares UK Dividend UCITS ETF GBP(Dist) 3.54% 2.00% 3.00%
Equities US / Global 7.00% 20.00%
Fidelity US Quality Income UCITS ETF 2.76% 5.00% 10.00%
SPDR S&P US Dividend AristocratsUCITS ETF 2.20%
iShares Developed Markets Property Yield UCITS ETF (Dist) 2.62% 7.00%
iShares Global InfrastructureUCITS ETF (Dist) 2.08% 2.00% 3.00%
Equities Japan 2.00% 2.00%
UBS ETF (LU) MSCI Japan UCITS ETF (JPY) A-dis 1.54% 2.00% 2.00%
Equities EM 5.00% 13.00%
iShares Emerging Markets Dividend UCITS ETF (Dist) 4.32% 5.00% 13.00%
Derivatives 0.67% 0.37%
Short Call SX5E 06/22 C4450 Index -0.15% -0.31%
Short Call SPX 06/22 C4650 Index -0.14% -0.28%
Short Call UKX 06/22 C7700 Index -0.03% -0.05%
Long Put SX5E 06/22 P3400 Index 0.80%
Long Put SPX 06/22 P3400 Index 0.20%
Long Put SX5E 06/22 P3000 Index 0.55%
Long Put SPX 06/22 P2900 Index 0.46%
Total 100.00% 100.00%
There is no guarantee that investment objectives or return expectations may be realized. Past performance is not indicative of future returns. Investments come with risk. The value
of an investment can fall as well as rise and you might not get back the amount originally invested at any point in time. Your capital may be at risk. Source: Deutsche Wealth
Management, as of 5 May, 2021. No assurance can be given that any investment objective or forecast or target can be achieved. Forecasts are based on assumptions, estimates,
opinions and hypothetical models which may prove to be incorrect. Past performance is not indicative of future returns. Investments come with risk and the value of an investment
can fall as well as rise and you might not get back the amount originally invested at any point in time. The product descriptions are for information purpose only instead of invitation
for investment. Investors may wish to consult their independent financial advisers. Please refer to the respective investment offering documents; the Important Information/Risk
Warning at the end of the presentation for further details.
17Strategic Income Allocation (SIA)
DB Strategic Income Allocation USD (SIA) –
Share class information
DB Strategic Income Allocation USD (SIA) Conservative Plus
Share class SBD WAMBD*
Share class currency USD USD
ISIN LU2330519260 LU2330519187
Initial minimum investment** 100,000 100,000
Front end load (% up to) 3.00 NA
Total Trailer Fee (%)1 0.48 0.075
Management (All-in-fee) Fee (%)2 0.65 0.245
Estimated TER (%) 0.853 0.448
Back End Load NA NA
Performance Fee NA NA
Risk Class 3 3
DB Strategic Income Allocation USD (SIA) Balanced Plus
Share class SBD LBD10 WAMBD*
Share class currency USD USD USD
ISIN LU2330520607 LU2330520789 LU2330520516
Initial minimum investment** 100,000 10,000,000 100,000
Front end load (% up to) 3.00 1.00 NA
Total Trailer Fee (%)1 0.48 0.28 0.075
Management (All-in-fee) Fee (%)2 0.65 0.45 0.245
Estimated TER (%) 0.958 0.758 0.553
Back End Load NA NA NA
Performance Fee NA NA NA
Risk Class 4 4 4
*Share class only available in dbXpert accounts
** Minimum investment indicated in prospectus is on aggregate basis at the end of subscription period. Please refer to prospectus for details
1. Total trailer fee comprises of trailer fees and investment advisory fees paid to DBWM.
2. All-in Fee refers to the sum of management fee and third party fees. Trailers/Investment Advisory Fees are a part of the All-in Fee.
No assurance can be given that any investment objective or forecast or target can be achieved. Forecasts are based on assumptions, estimates, opinions and hypothetical models
which may prove to be incorrect. Past performance is not indicative of future returns. Investments come with risk and the value of an investment can fall as well as rise and you
might not get back the amount originally invested at any point in time. The product descriptions are for information purpose only instead of invitation for investment. Investors may
wish to consult their independent financial advisers. Please refer to the respective investment offering documents; the Important Information/Risk Warning at the end of the
presentation for further details.
18Strategic Income Allocation (SIA)
DB Strategic Income Allocation EUR (SIA) –
Share class information
DB Strategic Income Allocation EUR (SIA) Conservative Plus
Share class SBD LBD10 WAMBD*
Share class currency EUR EUR EUR
ISIN LU2330519930 LU2330520276 LU2330520946
Initial minimum investment** 100,000 10,000,000 100,000
Front end load (% up to) 1.00 1.00 NA
Total Trailer Fee (%)1 0.48 0.28 0.075
Management (All-in-fee) Fee (%)2 0.65 0.45 0.245
Estimated TER (%) 0.919 0.719 0.514
Back End Load NA NA NA
Performance Fee NA NA NA
Risk Class 3 3 3
DB Strategic Income Allocation EUR (SIA) Balanced Plus
Share class SBD LBD10 WAMBD*
Share class currency EUR EUR EUR
ISIN LU2330519773 LU2330518882 LU2330521084
Initial minimum investment** 100,000 10,000,000 100,000
Front end load (% up to) 1.00 1.00 NA
Total Trailer Fee (%)1 0.48 0.28 0.075
Management (All-in-fee) Fee (%)2 0.65 0.45 0.245
Estimated TER (%) 1.007 0.807 0.602
Back End Load NA NA NA
Performance Fee NA NA NA
Risk Class 4 4 4
*Share class only available in dbXpert accounts
** Minimum investment indicated in prospectus is on aggregate basis at the end of subscription period. Please refer to prospectus for details
1. Total trailer fee comprises of trailer fees and investment advisory fees paid to DBWM.
2. All-in Fee refers to the sum of management fee and third party fees. Trailers/Investment Advisory Fees are a part of the All-in Fee.
No assurance can be given that any investment objective or forecast or target can be achieved. Forecasts are based on assumptions, estimates, opinions and hypothetical models
which may prove to be incorrect. Past performance is not indicative of future returns. Investments come with risk and the value of an investment can fall as well as rise and you
might not get back the amount originally invested at any point in time. The product descriptions are for information purpose only instead of invitation for investment. Investors may
wish to consult their independent financial advisers. Please refer to the respective investment offering documents; the Important Information/Risk Warning at the end of the
presentation for further details.
19Strategic Income Allocation (SIA)
DB Strategic Income Allocation HKD (SIA) –
Share class information
DB Strategic Income Allocation USD (SIA) Conservative Plus HKD
Share class HKD SBD
Share class currency HKD
ISIN LU2349911086
Initial minimum investment** 1,000,000
Front end load (% up to) 3.00
Total Trailer Fee (%)1 0.48
Management (All-in-fee) Fee (%)2 0.65
Estimated TER (%) 0.853
Back End Load NA
Performance Fee NA
Risk Class 3
DB Strategic Income Allocation USD (SIA) Balanced Plus HKD
Share class HKD SBD
Share class currency HKD
ISIN LU2349911599
Initial minimum investment** 1,000,000
Front end load (% up to) 3.00
Total Trailer Fee (%)1 0.48
Management (All-in-fee) Fee (%)2 0.65
Estimated TER (%) 0.958
Back End Load NA
Performance Fee NA
Risk Class 4
** Minimum investment indicated in prospectus is on aggregate basis at the end of subscription period. Please refer to prospectus for details
1. Total trailer fee comprises of trailer fees and investment advisory fees paid to DBWM.
2. All-in Fee refers to the sum of management fee and third party fees. Trailers/Investment Advisory Fees are a part of the All-in Fee.
No assurance can be given that any investment objective or forecast or target can be achieved. Forecasts are based on assumptions, estimates, opinions and hypothetical models
which may prove to be incorrect. Past performance is not indicative of future returns. Investments come with risk and the value of an investment can fall as well as rise and you
might not get back the amount originally invested at any point in time. The product descriptions are for information purpose only instead of invitation for investment. Investors may
wish to consult their independent financial advisers. Please refer to the respective investment offering documents; the Important Information/Risk Warning at the end of the
presentation for further details.
20Strategic Income Allocation (SIA)
DB Strategic Income Allocation SGD (SIA) –
Share class information
DB Strategic Income Allocation USD (SIA) Conservative Plus SGDH
Share class SGD SBDH
Share class currency SGD
ISIN LU2349911243
Initial minimum investment** 100,000
Front end load (% up to) 3.00
Total Trailer Fee (%)1 0.48
Management (All-in-fee) Fee (%)2 0.68
Estimated TER (%) 0.883
Back End Load NA
Performance Fee NA
Risk Class 3
DB Strategic Income Allocation USD (SIA) Balanced Plus SGDH
Share class SGD SBDH
Share class currency SGD
ISIN LU2349911755
Initial minimum investment** 100,000
Front end load (% up to) 3.00
Total Trailer Fee (%)1 0.48
Management (All-in-fee) Fee (%)2 0.68
Estimated TER (%) 0.988
Back End Load NA
Performance Fee NA
Risk Class 4
** Minimum investment indicated in prospectus is on aggregate basis at the end of subscription period. Please refer to prospectus for details
1. Total trailer fee comprises of trailer fees and investment advisory fees paid to DBWM.
2. All-in Fee refers to the sum of management fee and third party fees. Trailers/Investment Advisory Fees are a part of the All-in Fee.
No assurance can be given that any investment objective or forecast or target can be achieved. Forecasts are based on assumptions, estimates, opinions and hypothetical models
which may prove to be incorrect. Past performance is not indicative of future returns. Investments come with risk and the value of an investment can fall as well as rise and you
might not get back the amount originally invested at any point in time. The product descriptions are for information purpose only instead of invitation for investment. Investors may
wish to consult their independent financial advisers. Please refer to the respective investment offering documents; the Important Information/Risk Warning at the end of the
presentation for further details.
21Strategic Income Allocation (SIA)
Order and Settlement Details
NAV Calculation Daily
Cut-off-time Daily 4:40 pm (SG/HK time)
Order placement T-1
Forward Pricing T
Settlement T+3
Transferable Not outside DB
No assurance can be given that any investment objective or forecast or target can be achieved. Forecasts are based on assumptions, estimates, opinions and hypothetical models
which may prove to be incorrect. Past performance is not indicative of future returns. Investments come with risk and the value of an investment can fall as well as rise and you
might not get back the amount originally invested at any point in time. The product descriptions are for information purpose only instead of invitation for investment. Investors may
wish to consult their independent financial advisers. Please refer to the respective investment offering documents; the Important Information/Risk Warning at the end of the
presentation for further details.
22Strategic Income Allocation (SIA)
Potential Opportunities and risk
Potential Opportunities Risks
• Aiming to outperform broad capital • There is no capital guarantee; thus, there might be a total loss of
markets. the amount invested There is no guarantee that any investment
• Investment in various asset classes objectives will be achieved.
may allow participation from overall • The performance might be negative. The value of the
investment trends. investment strategy may fall significantly below the initial
• The hedging strategy may limit and amount invested.
dampen losses in negative markets. • Under certain market conditions there might be a high
• Estimation of close-to-reality concentration on only a few asset categories
distributions with explicit • High volatility might occur also on a short-term basis There are
consideration of extreme risks and risks associated with the use of derivatives.
instable correlations increases • Figures of the distribution contain no guarantees, hence the
portfolio transparency. portfolio value may decrease below the value of a pre-defined
• By showing the risk-return-profile, risk budget (risk of total portfolio loss).
returns and risks become visible at a • Capital market assumptions may differ significantly from actual
glance. market development Correlation between the hedging strategy
• Transparent illustration of the impact and the portfolio may be overestimated.
of derivative hedging and reallocation • Only market risk of liquid, transparent asset classes can be taken
strategies in a portfolio context. into account, other risks remain unconsidered.
There is no guarantee that investment objectives or return expectations may be realized. Past performance is not indicative of future returns. Investments come with risk. The value
of an investment can fall as well as rise and you might not get back the amount originally invested at any point in time. Your capital may be at risk. Source: Deutsche Wealth
Management, as of 5 May 2021
No assurance can be given that any investment objective or forecast or target can be achieved. Forecasts are based on assumptions, estimates, opinions and hypothetical models
which may prove to be incorrect. Past performance is not indicative of future returns. Investments come with risk and the value of an investment can fall as well as rise and you
might not get back the amount originally invested at any point in time. The product descriptions are for information purpose only instead of invitation for investment. Investors may
wish to consult their independent financial advisers. Please refer to the respective investment offering documents; the Important Information/Risk Warning at the end of the
presentation for further details.
23Strategic Income Allocation (SIA)
Risk areas related to ETFs* (1/2)
Liquidity risk: Certain types of securities in which the Sub-Fund ** invests or which are provided to the Sub-Fund as collateral are difficult to buy or sell,
particularly in times of unfavorable market conditions. This may make it more difficult to determine the price of the components of the underlying and thus
have a negative impact on the value of the underlying. This can have a negative impact on the net asset value per share of the sub- fund. The fact that the
shares may be listed on a stock exchange does not guarantee the liquidity of the shares.
Shares can be traded at prices differing from the net asset value: The net asset value of a sub-fund is the price at which shares of this sub-fund can be
subscribed or redeemed. The market price of the shares may sometimes be above or below this net asset value. There is therefore a risk for investors not to be
able to buy or sell at a price roughly equal to this net asset value. Various factors can lead to such a deviation from the net asset value, which is exacerbated in
the event of a large imbalance between supply and demand for the underlying securities. The ask / ask spread of the Shares (the difference between the price
that potential buyers are willing to pay and at which potential seller is willing to sell) may also result in prices that differ from the net asset value. In times of
volatility or uncertainty on the market, the bid / ask spread can widen and the deviation from the net asset value can widen.
Counterparty / credit rating / issuer risk: Credit risk is the risk of the counterparty (issuer) being unable to pay, i.e. a possible inability to meet its payment
obligations at a certain point in time or permanently, such as dividend payments, interest payments, repayments, etc. If the issuer is unable to meet its
obligation to the investor, the investor is at risk of a total loss. Alternative terms for credit risk are debtor or issuer risk. The creditworthiness risk is also
important for guarantee providers. The issuer's credit risk is reflected in the value of a financial product.
Influence on price formation: Scientific studies arrive to different conclusions on the possible influence of ETFs on price formation. Mechanical index
investment could limit the information function of prices, with additional liquidity improving the pricing process, but risks from possible transfers of price
shocks are conceivable. It is open for debate, how large the ETF sector needs to be in order to impact price formation and the corresponding information
function investors derive from it.
Cost risk: cost blocks such as administrative, operational and transaction costs are incurred even if an ETF does not make a profit. Passive management risk:
ETFs replicate indices and do not attempt to outperform them or to counteract a loss in value in times of falling indices. As a result, ETFs lose at least as much
in value as the replicated index when the index falls.
Replication risk: ETFs try to track indices. However, the performance of an ETF will deviate negatively from that of the index, since there are administrative and
other costs at fund level, the direct replication of an index leads to transaction costs and possibly not all components of an index can be purchased at all.
Risk from sampling / mapping techniques: For various reasons, ETFs may not be able to hold all index components themselves. Therefore, various techniques
are used to achieve a performance that comes as close as possible to that of the index. As a result, the portfolio of an ETF may be composed of securities other
than those of the index and therefore the performance may differ negatively from that of the index.
*Source: Deutsche Bundesbank monthly report: „Die wachsende Bedeutung von Exchange-Traded Funds an den Finanzmärkten“, April 2020
** Sub-Fund stands for ETF
No assurance can be given that any investment objective or forecast or target can be achieved. Forecasts are based on assumptions, estimates, opinions and hypothetical models
which may prove to be incorrect. Past performance is not indicative of future returns. Investments come with risk and the value of an investment can fall as well as rise and you
might not get back the amount originally invested at any point in time. The product descriptions are for information purpose only instead of invitation for investment. Investors may
wish to consult their independent financial advisers. Please refer to the respective investment offering documents; the Important Information/Risk Warning at the end of the
presentation for further details.
24Strategic Income Allocation (SIA)
Risk areas related to ETFs* (2/2)
Synthetic Mapping Risk: ETFs that seek synthetic index replication seek to achieve index performance through a total return swap with a counterparty. In doing
so, they may hold assets as collateral that are not related to the components of the index. These ETFs are exposed to counterparty risk because their ability to
track the performance of the index depends on the counterparty's solvency. Insofar as they hold collateral, the collateral may not be recoverable and there is no
connection between the performance of the index shown and that of the collateral basket, so that the value of the ETF may then deviate significantly from that
of the index.
Index-related risks: Errors can occur when calculating the indices that represent ETFs. These can adversely affect the performance of an index, which can also
have a negative impact on the corresponding ETFs due to index replication. Rebalancing or changes in the composition of an index must be mapped by the ETF,
which can result in corresponding costs and can therefore have a negative impact on the performance of the ETF.
Risk of different composition: If ETFs cover the same markets or sectors, the same reference indices need not necessarily be used. The components of the ETFs
or indices may differ due to differences in methodology, different weightings or different calculation methods.
Risks in exchange-traded funds: The price for the purchase of shares in a fund on the stock exchange may differ from the value of the investment fund per
share. While the fund management company calculates the unit price once a day, prices are usually continuously formed on the stock exchange due to the
current relationship between supply and demand. Differences also result from the different recording of unit prices over time.
Lack of liquidity: ETFs are traded on exchanges, as market makers continuously price them. However, there is no guarantee that ETF Shares can actually be
bought or sold on a stock exchange at any time.
Securities Lending Risk: Some ETFs engage in securities lending to improve performance. If the relevant counterparty (the borrower) does not return the
securities, there is a risk of loss in value for the ETF, as it is hidden if any collateral provided cannot be realized or cannot be realized at a reasonable price.
Diversification risk: The distribution across various asset classes, sectors, countries and currencies is intended to reduce individual security risks in a portfolio.
However, a corresponding diversification cannot provide a guarantee and it is possible that all assets could develop negatively and that an investment fund will
therefore show a negative performance.
*Source: Deutsche Bundesbank monthly report: „Die wachsende Bedeutung von Exchange-Traded Funds an den Finanzmärkten“, April 2020
** Sub-Fund stands for ETF
No assurance can be given that any investment objective or forecast or target can be achieved. Forecasts are based on assumptions, estimates, opinions and hypothetical models
which may prove to be incorrect. Past performance is not indicative of future returns. Investments come with risk and the value of an investment can fall as well as rise and you
might not get back the amount originally invested at any point in time. The product descriptions are for information purpose only instead of invitation for investment. Investors may
wish to consult their independent financial advisers. Please refer to the respective investment offering documents; the Important Information/Risk Warning at the end of the
presentation for further details.
25Strategic Income Allocation (SIA)
DB Strategic Income Allocation (SIA) Funds
Our DB Strategic Income Allocation (SIA) Funds are a multi-asset, ETF-based portfolio aimed at generating income,
with systematic hedging added to manage downside risk.
Derived from our flagship SAA1 approach, our two SIA Emphasises wealth Balanced portfolio Risks
Plus Funds offer a simple and effective way to leverage preservation over time approach This investment may have negative
the expertise of our Chief Investment Office (CIO) and performance, and the value of the
platform of DWS.2 investment strategy may fall significantly
below the initial amount invested. High
volatility or high concentration on only a
A modern income portfolio few asset classes might occur on a short-
The funds aim for diversified and robust income
sources with semi-annual payout:
2% 4% term basis. No assurance can be given
that investment objectives will be
achieved. All investors should read the
• Recurring coupons using ETFs linked to fixed prospectus to ensure they are fully aware
income indices to capture yield from corporate, of the risks. During periods when equity
emerging markets and high-yield bonds. markets move sideways, and the Plus
• Quality dividend streams via ETFs covering U.S., Conservative Plus Balanced Plus features are activated, the asymmetric
European and Emerging Markets equity indices plus investment strategy1 may underperform,
listed real estate and infrastructure indices. • Indicative target • Indicative target as the option premium will be lost and
• Option premium generated from covered call distribution 2% p.a.5 distribution 4% p.a.5 potentially not be compensated by higher
writing3 on part of the equity exposure to provide an equity exposure. As a result of the higher
• Equity/fixed income approach • Focus on equities
equity quota, volatility (standard
opportunity for yield enhancement. • Equity max. 60% • Equity max. 80% deviation) in the portfolio will increase and
Plus Features4 • Targeted risk budget • Targeted risk budget the daily fluctuations of the portfolio will
be higher (see footnote 4). Due to the call
• Actively manages risk to increase exposure to -10% p.a.6 -20% p.a.6 writing component, the investment has a
growth assets • Risk Class 3 • Risk Class 4 capped upside potential in rising markets
• Systematically hedges against the impact of severe (see footnote 3).
losses via liquid exchange-traded instruments Equity Fixed Income Liquidity Derivatives
1 - DWS is the Management Company and the Fund Manager. This fund is managed by DWS and hence is an in-house product. Deutsche Bank Wealth Management acts as the Investment
Advisor of the Funds. 2.- The sub-fund may sell call options on the underlying portfolio or portfolio related positions (i.e. options on equity indices, bond indices or commodity indices) in
order to receive a premium and increase the income. Selling call options generally results in the sub-fund not or only partially participating in price increases of the underlying assets. On the
other hand participation in price losses is reduced by the amount of the option premiums received. 3 - “Plus” means a targeted loss limit is met with a high probability (99%), either through
systematic hedging, whenever economically rational, or through changes in asset allocation, when hedging is not economically rational. This does not constitute a loss limitation
commitment or a capital guarantee or a statement by the Bank that it will be able to comply with the targeted loss limit. In particular, the targeted loss limit does not rule out the possibility of
higher losses arising (no capital protection). The hedging can lead to a reduction in the return. 4 - The share class for the Conservative Plus Fund targets a distribution of 2% per annum.
The share class for Balanced Plus targets a distribution of 4% per annum. Distribution amounts are not guaranteed and are purely indicative. The targeted distribution amounts depend on
various factors, such as market developments and the composition of the portfolio, and may be subject to change without notice. Actual determined distributions may therefore differ over
time or may even be zero. 5 – Maximum loss with a 99% probability, however this is not a guarantee. Example: Risk budget = 10% ->In 99 out of 100 cases, the maximal loss is 10% or less.
Similarly, in one out of 100 cases, the loss is greater than 10%. For the Plus funds, the risk budgets (using a 99% confidence level) of -10% p.a. and -20% p.a., are provided on a daily rolling
basis over a 12-month forward-looking time horizon. This means that for any given date, the target loss limitation on a 12-month forward-looking time horizon is implemented with reference
to the current fund value, i.e. risk budget (99%) on January 5th = -10% for the next 12 months; risk budget (99%) on May 28th = -10% for the next 12 months. There is no guarantee that
investment objectives or return expectations may be realized. For illustrative purpose only. Source: Deutsche Bank Wealth Management, May 2021.
No assurance can be given that any investment objective or forecast or target can be achieved. Forecasts are based on assumptions, estimates, opinions and hypothetical models
which may prove to be incorrect. Past performance is not indicative of future returns. Investments come with risk and the value of an investment can fall as well as rise and you
might not get back the amount originally invested at any point in time. The product descriptions are for information purpose only instead of invitation for investment. Investors may
wish to consult their independent financial advisers. Please refer to the respective investment offering documents; the Important Information/Risk Warning at the end of the
presentation for further details.
26You can also read