Streptococcus agalactiae in childbearing age immigrant women in comunitat Valenciana (Spain) - Nature
←
→
Page content transcription
If your browser does not render page correctly, please read the page content below
www.nature.com/scientificreports

            OPEN           Streptococcus agalactiae in
                           childbearing age immigrant women
                           in Comunitat Valenciana (Spain)
                           José Miguel Sahuquillo-Arce1,2 ✉, Alicia Hernández-Cabezas1, María Jesús Castaño-Aroca1,
                           Rabab Chouman-Arcas1, Estefanía Díaz-Aguirre3, Beatriz Acosta-Boga1 &
                           José Luis López-Hontangas1
                           Streptococcus agalactiae (GBS) remains the leading cause of meningitis and neonatal sepsis in the
                           world, and causes disease in pregnant and puerperal women. This is a retrospective study of GBS
                           infections on women of childbearing age living in Comunitat Valenciana, Spain (years 2009–2014) and
                           GBS colonization rate on pregnant women attending Hospital La Fe (years 2013–2015) according to
                           their origin. An aggregated total of 6,641,960 women exposed during the study period had an average
                           GBS isolation rate of 5.19‰ (5.14–5.25‰), geographical group rates being: Western Europe (2.2‰),
                           North America (2.1‰), Australia (3.7‰), Spain (4.6‰), Latin America II (4.5‰), Eastern Europe
                           (5.3‰), Asia (6.7‰), Latin America I (7.7‰), Middle East (7.9‰), Indian Subcontinent (17.2‰), North
                           Africa (17.8‰), Sub-Saharan Africa (22.7‰). The 4532 pregnant women studied had an average GBS
                           colonization rate of 12.47% (11.51–13.43) and geographical group rates varied similar to geographical
                           isolation rates. Low GDP and high temperatures of the birth country were associated with higher
                           colonization rates. Thus, differences in GBS colonization depend on the country of origin; Africa and the
                           Indian subcontinent presented the highest, while Western Europe and North America had the lowest.
                           This variability portrays a geographical pattern influenced by temperature and GDP.

                           Streptococcus agalactiae, also known as Group B Streptococcus (GBS), is a commensal of the gastrointestinal tract
                           and vagina of a high proportion of healthy adults. GBS remains the leading cause of meningitis and neonatal
                           sepsis in the world, affecting 0.5 to 3 newborns in every 1000 live births. But GBS also causes disease in pregnant
                           and puerperal women such as chorioamnionitis, preterm birth or even stillbirth1,2. The newborn is colonized by
                           GBS as it passes through the birth canal, which occurs in approximately 40–60% of the children of carrier moth-
                           ers, and 1–2% of them develop an infectious condition with high morbidity and mortality rates3–5. In addition,
                           neonatal colonization rates are directly proportional to the mother’s vaginal colonization density and inversely
                           proportional to the titer of antibodies against the colonizing strain6.
                               The screening of GBS in pregnant women is fundamental to knowing the state of vaginorectal colonization
                           and establishing intrapartum antibiotic prophylaxis to reduce the risk of developing neonatal invasive infec-
                           tion7–9. The Pregnancy Monitoring Program in Comunitat Valenciana incorporated the screening of GBS colo-
                           nization in 2002 according to a consensus review of a previous circular (1/97 of April 17). This was reflected in
                           the manual for healthcare professionals entitled “Basic Pregnancy Control in Comunitat Valenciana”, based on
                           international recommendations. Therefore, since 2002, screening of GBS in the Comunitat Valenciana is carried
                           out on pregnant women between weeks 35 and 37.
                               After the widespread implementation of GBS screening and the administration of intrapartum antibiotic
                           prophylaxis, the incidence of early onset neonatal invasive infection due to GBS has decreased more than 80%
                           in Europe and the USA1,10. However, the incidence of late onset neonatal invasive infection has remained stable
                           about 0.25–0.5 per 1000 live births due to different ways of acquiring GBS1.
                               A promising alternative to these strategies which is currently undergoing multiple clinical trials is the immu-
                           nization of pregnant women. Recently, published data have shown that an increase in IgG in the serum of preg-
                           nant women correlates with a decrease in the colonization of the vaginorectal area6,11. This would reduce the
                           exposure of the newborn to GBS and thus the risk of early onset infection. In addition, the levels of maternal IgG

                           1
                             Microbiology Department, Hospital Politécnico y Universitario La Fe, Valencia, Spain. 2Respiratory Infections
                           Research Group, IIS La Fe, Valencia, Spain. 3Universidad Miguel Hernández, Elche, Spain. ✉e-mail: wadjur@hotmail.
                           com

Scientific Reports |   (2020) 10:9904 | https://doi.org/10.1038/s41598-020-66811-2                                                          1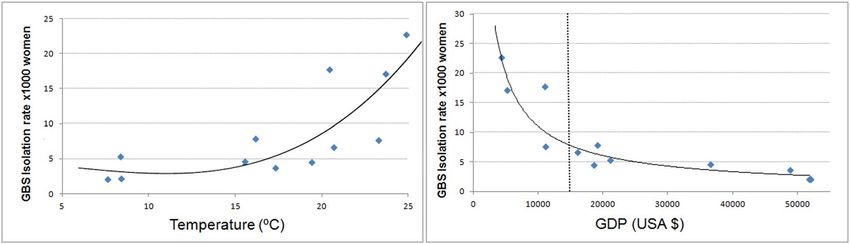
www.nature.com/scientificreports/                                                              www.nature.com/scientificreports

                           in the neonates would be enough to protect them from late-onset infection6,12. Moreover, vaccination would also
                           diminish GBS associated miscarriage, stillbirth and maternal infection1
                               Prior studies have demonstrated that individual GBS colonization is remarkably homogeneous and stable
                           through time13,14. Therefore, the acquisition of microbiota will depend on the mother’s colonizing bacteria and the
                           local environment where people are raised, and will probably remain the same through life unless unbalanced by
                           direct aggressions to their structure such as antimicrobial treatments or dramatic weather changes15–17.
                               Immigrant women from all over the world reside in Comunitat Valenciana; thus, the aim of this study is to
                           assess the prevalence of GBS colonization among pregnant women attending Hospital La Fe or associated health
                           care centres, and to identify newborns at higher risk for GBS infection according to their mothers’ origin. For
                           this purpose we have determined the GBS colonization rates among pregnant women from Hospital La Fe and
                           compared it with the isolation rates of GBS in childbearing age women living in Comunitat Valenciana (Spain) to
                           find trends or geographical variety.

                           Material and Methods
                           This is a retrospective study to analyze the rate of GBS carriage among women of childbearing age according to
                           their country of origin. In a first approach, pregnant women attending our hospital or associated health care cen-
                           tres (Health area Valencia-La Fe) during a three-year period (2013–2015) who were studied for GBS colonization
                           were included in the study. Hospital La Fe has a total of 945 beds and 20 associated health care centres. Its health
                           area covers a total population of 255873. In 2018, our hospital had 661423 medical appointments, 44883 medical
                           admissions 33183 surgical procedures and 661423 medical consultations.
                                Vaginal and rectal samples obtained at prenatal visits or admission for delivery were cultured on selective
                           chromogenic medium (chromID Granada agar, bioMérieux, Marcy l’Étoile, France) and incubated for 48 hours
                           in an anaerobic atmosphere for the screening of Group B Streptococci. Orange colonies were further identified by
                           Maldi-tof (Vitek MS, bioMérieux).
                                In a second approach, isolation rates of GBS from clinical samples in women of ages between 15 and 49 years
                           old during a six-year period (2009–2014) and living in Comunitat Valenciana (Spain) were identified through the
                           Microbiological Surveillance Network of the Valencian Community (RedMIVA). This network is a system that
                           processes and records microbiological information from more than 90% of the population living in Comunitat
                           Valenciana18, which had a size of 4,934,993 people as of December 2016 and about 1,020,000 childbearing age
                           women.
                                Population data including age group, sex and country of origin were extracted from the Instituto Nacional de
                           Estadística (Spanish Statistics Office). Data about co-morbidities were obtained from the Documentation depart-
                           ment of Hospital La Fe and the Sistema de Información de la Asistencia Ambulatoria de la Conselleria de Sanitat.
                           Explanatory co-variates tested were: age, Gross Domestic Product per capita based on purchase parity power
                           (GDP) and the mean temperature of the country of birth. GDP and mean temperature were extracted from
                           Weatherbase and The World Factbook19,20. Climate data was obtained from High-resolution gridded datasets
                           from the University of East Anglia and GISTEMP Team, 2019: GISS Surface Temperature Analysis (GISTEMP),
                           version 4. NASA Goddard Institute for Space Studies21–23.
                                Colonization rates in pregnant women from Hospital La Fe and isolation rates in the aggregated population
                           were calculated with 95% confidence intervals. Subjects were grouped according to their birth country by geopo-
                           litical areas with similar prevalence. Chi square and Welch tests were used to compare rates and ages respectively.
                           Post hoc analyses were used after applying Bonferroni’s correction. A p < 0.05 was considered statistically signif-
                           icant. Curvilinear estimation was used to construct models that fitted explanatory co-variates. SGB colonization
                           trends during the 6-year period 2009–2014 were compared with temperature trends from the corresponding
                           geopolitical area in thirty nine 6-year groups from 1970 through 2009. Correlations between normalised temper-
                           ature trends and normalised SGB colonization trends were assessed by the Kolgomorov-Smirnov test. Data were
                           analyzed using the SPSS software version 15.0.
                                The fundamental ideas behind our work are that microbiota is naturally acquired during birth and early life,
                           that its altering depends on severe aggressions, and that populations with higher GBS isolation rates must conse-
                           quently have higher GBS colonization rates.
                                Access to the RedMIVA databases was granted by the Public Health Department and our research was
                           approved by the RedMVA committee. Other data acquisition and processing were carried out in accordance
                           with relevant guidelines and regulations and under permission of the local authorities (Conselleria de Sanitat,
                           Comunitat Valenciana) and was approved by the ethics committee of the Instituto de Investigación Sanitaria
                           del Hospital Universitario y Politécnico La Fe. The data was fully anonymised so informed consent from partic-
                           ipants was not required, and access was granted in line with European General Data Protection Regulations. No
                           experiments were performed either on humans or on human tissue samples; therefore, informed consent was not
                           needed.

                           Results
                           Geopolitical areas with similar prevalence. Twelve groups were formed based on similar isolation rates
                           and geographical proximity (Table 1). The names Latin America I and II were used to group American countries
                           with different isolation rates but in the same continent.

                           Pregnant women attending Hospital La Fe.                The total number of pregnant women included in the
                           study was 4532, with an average GBS colonization rate of 12.47% (11.51–13.43%), 90.8% of the colonized women
                           were detected after routine GBS screening between weeks 35–37, while 9.2% were detected before that period
                           due to bacterial vaginosis or to threatened preterm labour. Ages ranged from 29.0 (±4.2) years in Asia to 34.7

Scientific Reports |   (2020) 10:9904 | https://doi.org/10.1038/s41598-020-66811-2                                                           2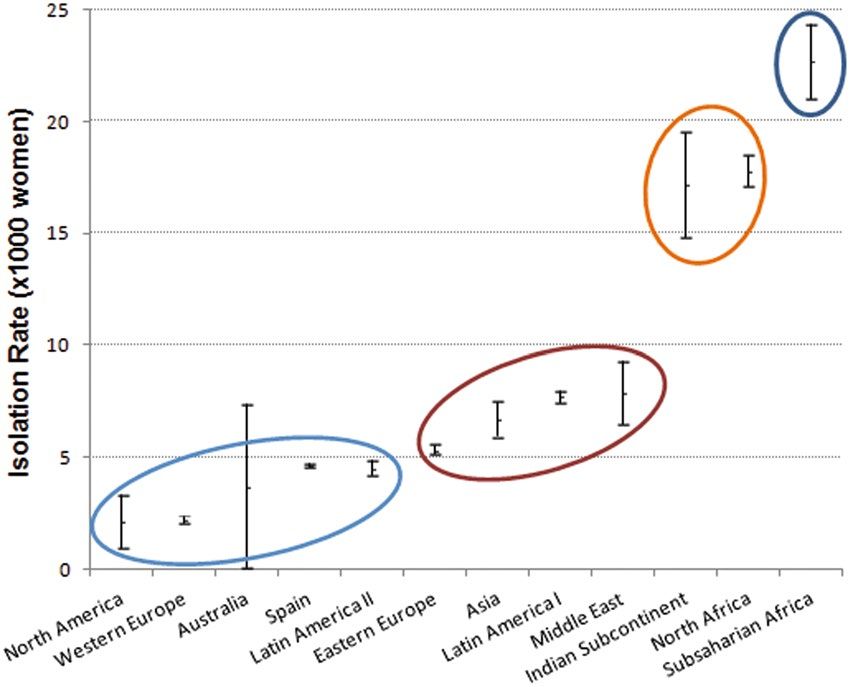
www.nature.com/scientificreports/                                                                         www.nature.com/scientificreports

                            GROUP                 COUNTRIES                                       GDP*    Mean T(°C)
                                                  China, Indonesia, Japan, Laos, Nepal,
                            Asia                                                                  16078   20.7
                                                  Philippines, South Korea, Thailand, Vietnam
                            Australia             Australia                                       48800   17.3
                                                  Albania, Belarus, Bosnia-Herzegovina,
                                                  Bulgaria, Croatia, Czech Republic, Estonia,
                                                  Hungary, Kazakhstan, Latvia, Lithuania,
                            Eastern Europe                                                     21067      8.3
                                                  Moldova, North Macedonia, Poland, Romania,
                                                  Russia, Serbia, Slovakia, Slovenia, Ukraine,
                                                  Uzbekistan
                            Indian Subcontinent   Bangladesh, India, Pakistan                     5233    23.7
                                                  Bolivia, Colombia, Costa Rica, Dominican
                                                  Republic, Ecuador, El Salvador, Grenade,
                            Latin America I                                                       11082   23.2
                                                  Guatemala, Haiti, Honduras, Nicaragua,
                                                  Panama, Paraguay, Peru, Venezuela
                                                  Argentina, Brazil, Cuba, Chile, Jamaica,
                            Latin America II                                                      18583   19.4
                                                  Mexico, Uruguay
                                                  Armenia, Azerbaijan, Georgia, Iran, Iraq,
                            Middle East                                                           19110   16.1
                                                  Jordan, Kuwait, Lebanon, Syria, Turkey
                            North Africa          Algeria, Egypt, Mauritania, Morocco, Tunisia    10967   20,4
                            North America         Canada, United States of America                51750   7.6
                            Spain                 Spain                                           36500   15.5
                                                  Angola, Benin, Burkina Faso, Cameroon,
                                                  Cape Verde, Chad, Democratic Republic of the
                                                  Congo, Equatorial Guinea, Ethiopia, Ghana,
                            Sub-Saharan Africa    Guinea, Guinea-Bissau, Ivory Coast, Kenya,       4392   24.9
                                                  Lesotho, Liberia, Mali, Nigeria, Senegal, Sierra
                                                  Leone, Somalia, Sudan, Tanzania, The Gambia,
                                                  Togo
                                                  Austria, Belgium, Denmark, Finland, France,
                                                  Germany, Ireland, Italy, Luxembourg,
                            Western Europe                                                        51980   8.4
                                                  Netherlands, Norway, Portugal, Sweden,
                                                  Switzerland, United Kingdom

                           Table 1. Geopolitical grouping according to similarity among isolation rates and proximity. *GDP, Gross
                           Domestic Product per capita based on purchase parity power (US dollars.)

                           (±5.7) years in Western Europe (Table 2). There were no significant age differences between colonized and
                           non-colonized women.
                               The prevalence of co-morbidities in our cohort of pregnant women showed the following distribution:
                           1(0.02%) alcohol abuse, 164(3.6%) smoking, 164(5.4%) obesity, 65 (1.4%) diabetes, 9(0.2%), 72 (1.6%) gesta-
                           tional diabetes, 9(0.2%), chronic liver disease, 10(0.2%) chronic obstructive pulmonary disease, 28(0.6%) chronic
                           central nervous system disease –Multiple Sclerosis chiefly–, 30(0.7%) chronic heart diseases –heart murmurs
                           chiefly–, 135(3%) autoimmune chronic diseases –psoriasis chiefly–, 18(0.4%) HIV positive and 2(0.04%) kidney
                           transplants.
                               Significant differences were found between the colonization rates of the different groups (p < 0.0001), and post
                           hoc analysis showed that Sub-Saharan Africa women, with 31% of carriers, had significantly higher rates than the
                           other groups except North Africa, which presented a 21% of carriers. North America and Australia were excluded
                           from the post hoc analysis because of the small number of cases. Pregnant women data fitted total population
                           results in a linear regression model with an R2 of 0.68.
                               During the study period, GBS was also isolated in 2692 samples from 649(32.3%) admitted patients and
                           1359(67.7%) from the health area. Infections ranged from skin and soft tissue infections to more severe infec-
                           tions, including 2 neonatal deaths due to bacteraemia and meningitis (Table 3). All isolates tested were susceptible
                           to beta-lactams, linezolid and vancomycin, 98% to levofloxacin, 72.9% to clindamycin and 73.4% to erythromycin
                           according to EUCAST criteria.
                               As for this cohort of pregnant women, GBS was associated in a case of choriamnionitis, preterm delivery and
                           neonatal death. Other complications were 40 prelabor rupture of membranes, 44 urinary tract infections, 2 gen-
                           ital abscesses and 16 vaginal infections.

                           Aggregated population isolation rate. The cumulative population exposed to infection by GBS during
                           the study period (2009–2014) included 4,940,794 women born in Spain and 1,701,166 born abroad, with an aver-
                           age isolation rate of 5.19‰ (5.14–5.25‰). The isolation area is shown in Table 3.
                               The post hoc analysis showed that women from Sub-Saharan Africa had significantly higher GBS isolation
                           rates compared to the rest of the groups: 22.7‰, whereas North America and Western Europe had the lowest:
                           2.1‰ and 2.2‰ respectively. The post hoc pairwise analysis found differences that allowed us to construct four
                           major groups based on the significant differences between groups (Fig. 1). Global isolation rates are shown in
                           Fig. 2.

                           Co-variates. Using aggregated population data, low GDP and high temperatures were associated with higher
                           isolation rates, and fitted into non-linear regression models (Fig. 3). Temperature data by groups fitted into a

Scientific Reports |   (2020) 10:9904 | https://doi.org/10.1038/s41598-020-66811-2                                                           3
www.nature.com/scientificreports/ www.nature.com/scientificreports
Aggregated population Pregnant women from Hospital La Fe
Mean age
Geographical group N IR (CI 95%) CP Mean age (±SD) n CR (CI 95%)
(±SD)
North America 6060 0.0021 (0.0010–0.0033) 33.2 (±7.2) 2 0.00 (0.00–0.00) 33.0 (±4.2)
Western Europe 345399 0.0022 (0.0020–0.0024) 33.5 (±7.2) 61 0.05 (−0.01–0.10) 34.7 (±5.4)
Australia 1075 0.0037 (0.0001–0.0074) 38.0 (±3.2) 0 — —
Spain 4940794 0.0046 (0.0046–0.0047) 32.4 (±6.7) 3179 0.11 (0.10–0.12) 33.0 (±5.2)
Latin America II 167151 0.0045 (0.0042–0.0049) 31.6 (±6.9) 79 0.09 (0.03–0.15) 33.3 (±4.9)
Eastern Europe 506452 0.0053 (0.0051–0.0055) 29.3 (±6.1) 205 0.15 (0.10–0.19) 30.3 (±5.2)
Asia 43264 0.0067 (0.0059–0.0075) 30.1 (±5.8) 63 0.10 (0.02–0.17) 29.0 (±4.2)
Latin America I 418787 0.0077 (0.0075–0.0080) 31.0 (±7.4) 550 0.15 (0.12–0.18) 30.0 (±6.6)
Middle East 15465 0.0079 (0.0065–0.0093) 29.5 (±6.1) 17 0.18 (0.00–0.36) 31.1 (±5.4)
Indian Subcontinent 12044 0.0172 (0.0149–0.0195) 29.0 (±5.0) 83 0.11 (0.04–0.18) 30.5 (±5.2)
North Africa 154073 0.0178 (0.0172–0.0185) 29.7 (±6.4) 146 0.21 (0.15–0.28) 31.7 (±5.7)
Sub–Saharan Africa 31396 0.0227 (0.0211–0.0244) 30.0 (±5.4) 147 0.31 (0.24–0.39) 31.6 (±5.1)
Table 2. GBS rates and mean age in aggregated population and pregnant women from Hospital La Fe. *IR,
Isolation Rate; CI, Confidence Interval; CP, Culture-positive women; CR, Colonization Rate.
2009-2014 (CBA 2013-2015 (All
women) patients)
Deep specimens
Catheter 3 (0.01)
CSF 6 (0.01) 3 (0.11)
Biological sterile fluid (0.04) 14 (0.52)
Bone and deep tissue 28 (0.06) 42 (1.56)
Blood 47 (0.10) 26 (0.97)
Respiratory specimens
Lower respiratory tract 27 (0.06) 29 (1.08)
ORL 49 (0.11) 33 (1.23)
Superficial specimens
Surgical wound 100 (0.22) 15 (0.56)
Skin and soft tissue 249 (0.55) 131 (4.87)
Urinary tract specimens
UTI 11146 (24.59) 1013 (37.63)
Reproductive area specimens
Mammary gland 16 (0.04) 2 (0.07)
Endometrium 25 (0.06) 2 (0.07)
Intrauterine device 31 (0.07) 2 (0.07)
Placenta and amniotic
113 (0.25) 8 (0.30)
fluid
Genital area 32985 (72.78) 1372 (50.97)
Other 477 (1.05)
Total 45321 2692
Table 3. GBS isolation site in CBA women during the period 2009-2014 and in patients from
Hospital La Fe during the period 2013-2015 (n(%)). CBA, Childbearing age; CSF, Cerebrospinal fluid;
ORL,Otorhinolaryngological area; UTI, Urinary tract infection.
cubic function with an R2 of 0.67 (F statistic = 8.34; p = 0.009); while GDP fitted into a potential function with
an R2 of 0.88 (F statistic = 70.8; p < 0.00001). Using pregnant women data, a similar pattern was observed but R2
were smaller, 0.24 and 0.51 applying linear and potential models respectively.
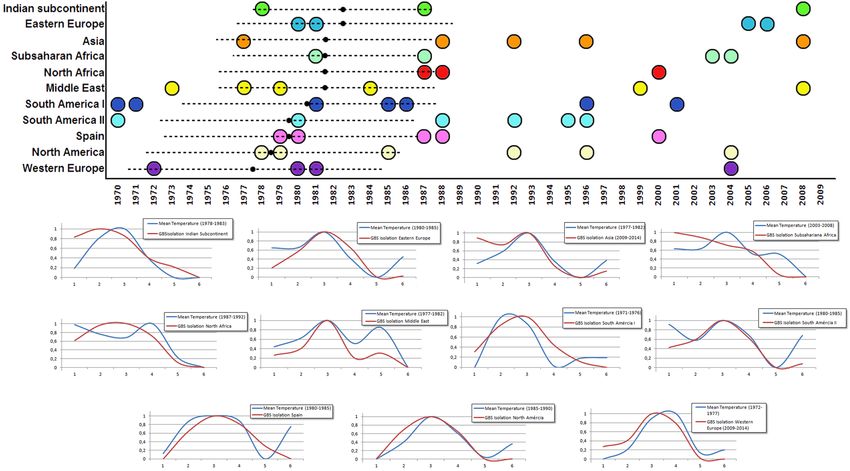
Aggregated population GBS isolation trends and temperature trends presented several matches for each geo-
political area from 1970 to 2014. Figure 4 displays the years where both trends were alike, each coloured dot
representing a 6-year period match. The birth date of each population with a 95% confidence interval is repre-
sented by a black point and a dotted line, and it was calculated by subtracting the mean age of each group to the
middle year of the study period. The best fits between temperature and GBS isolation trends for each geopolitical
area except Australia –due to the scarcity of data– are also displayed. The highest concentration of matches was
found between the late 70 s and early 80 s, coinciding with the age around the birth date of the studied population.
Developed countries presented better fits.
Scientific Reports | (2020) 10:9904 | https://doi.org/10.1038/s41598-020-66811-2 4www.nature.com/scientificreports/ www.nature.com/scientificreports
Figure 1. Isolation rates with 95% confidence intervals. Circles encompass the major groups derived from post
hoc analysis.
Figure 2. Global isolation rate map derived from aggregated data results.
Higher income countries presented higher ages (p < 0.001), but plausible regression models to consider age
as an explanatory co-variate yielded poor R2 values below 0.44 and 0.36 for aggregated population and pregnant
women respectively.
Discussion
The main finding of our study is that there are evident differences in GBS isolation among women of childbearing
age depending on their country of origin; Africa and the Indian subcontinent presented the highest rates, while
Western Europe and North America had the lowest. And more relevant, these differences have a mirror image
in pregnant women. Also, this variability portrays a geographical pattern that seems influenced by temperature
and GDP.
Variations in GBS colonization rates in population from different countries have been previously described;
however, these studies offer different results and the total number of subjects studied is smaller and not compa-
rable to ours. Three of these studies grouped women by geographical world regions but their results are not alike.
From them, we can derive that Africa has a high GBS colonization rate, although their results vary and describe
different geographical areas: i.e., 29% in Africa in Valkenburg-van den Berg et al., 21.8% in North Africa in Ramos
et al., and 19% in Sub-Saharian Africa in Stoll et al.24–26. A fourth paper also describes different rates among Israeli
and immigrant women, but their results are very local and the number of women included in the study is 68113.
A systematic review focused on GBS maternal carriage in European countries found lower colonization rates in
Western Europe compared to Eastern Europe27. But this study also compared two more groups, Scandinavia and
Southern Europe, yielding results that do not match ours, especially the high colonization rate they report for
Scandinavia (data not shown). Two more studies found differences in the USA in women and newborns from the
same country according to their ethnic group28,29. Especially interesting are the results of Zaleznik et al., as they
found that being black or Hispanic was a risk factor for developing neonatal disease29.
Regarding pregnant women from Hospital La Fe, our data correlate with that of the aggregated popula-
tion. Actually, results for women from Africa are worrisome given that colonization rates are as high as 31% for
Sub-Saharan countries and 21% for Northern Africa, which would explain Berardi et al.’s finding that African
Scientific Reports | (2020) 10:9904 | https://doi.org/10.1038/s41598-020-66811-2 5www.nature.com/scientificreports/ www.nature.com/scientificreports
Figure 3. Temperature and GDP regression models.
ethnicity was a risk factor for neonatal intrapartum GBS-transmission5. This means that, as long as our results
are applicable to the original countries of the women included in the study, about one quarter of infants born in
Africa would be at risk of GBS perinatal infection. Knowing that screening for GBS and intrapartum antibiotic
prophylaxis are expensive and difficult to implement in lower-middle-income countries, such high colonization
rate countries would benefit from vaccination of pregnant women as an alternative solution for both early and late
onset GBS invasive infection, given that the vaccine included the appropriate serotypes6,12,30–34.
Age showed a slight effect on isolation rates, but contrary to mean temperature and GDP, it did not seem to
play a major role in GBS colonization.
Humans, as homoeothermic beings, tend to keep a constant body temperature, but increased environmental tem-
perature and atmospheric humidity have been shown to increase GBS carriage35. Features related to temperature such
as clothing, skin and mucous moisture or even microbiota interactions may be crucial and modulate GBS colonization
such as the inhibition of GBS by different strains of Lactobacillus acidophilus and L. brevis36. Interestingly, we found that
the period of time around the birth of the studied population was the period were more correlations between isolation
and temperature trends were found, suggesting that colonization during early life is paramount for future GBS carriage.
Moreover, better fits were found for developed countries, maybe pointing out that, in political and economical stable
areas, temperature becomes the most important driver for GBS colonization. Nevertheless, our data studied a 6-year
period and, although tempting, it is too short a lapse of time to draw any conclusion. Temperature data over almost 50
years presented a nonlinear raising trend in all geopolitical areas; therefore, longer study periods are needed to observe
such a trend in colonization rates. But if our data is right, poor countries, especially sub-Saharan countries could face a
worrisome threat in years to come, and the development of effective vaccines could be the answer.
Interestingly, GDP appears to be paramount in our results since it was able to explain about 90% of the varia-
tion found in our data. Furthermore, we were expecting a linear co-relation between GDP and GBS colonization;
but instead, we found an exponential one. This suggests that colonization levels can be reduced to a great extent
if GDP reaches a certain point that, according to our data, may be at about 15000 USD (vertical, dotted line in
Fig. 3B). Needless to say that an increase in GDP is linked to a safer and more regular food supply, better-quality
sanitation and enhanced healthcare systems. Moreover, given the significance of GDP, it is likely to find different
colonization rates among social classes with different incomes within a country. Thus, we wonder if the differ-
ent colonization rates found by Regan et al. and Zaleznik et al.28,29 among white, black and Hispanic women in
multicentre studies in the USA were due to the fact that white women tend to be in the upper and middle classes,
whereas black and Hispanic women tend to be in the middle and lower classes37,38.
One weakness of our work is that we grouped countries to gain statistical power; thus, results are applicable for
the whole group but should not be used to predict colonization rates for individual countries. Nevertheless, coun-
tries within each group for which there was enough data, followed suit the trends of the group they were included
in. In addition, large countries such as the USA, Canada, Russia or China most certainly experience internal geo-
graphical variation. Another weakness is that people around the world have different reasons to migrate; hence,
people from developing countries come mostly from the working class, whereas people from developed countries
are most likely middle and upper class. Consequently, immigrants may arrive with different colonization rates
according to their social class and their income as we have previously proposed.
In contrast, the main strength of our study is the large amount of data we could work with. Moreover, data
from pregnant women fitted our results for the aggregated population, showing minor divergences in the order
of colonization rates mainly in the middle rate groups, where differences are subtle and data were less abundant.
Our study has found important differences in GBS isolation rates according to the country of origin, as well as
two likely explanatory reasons: GDP and mean temperature of the country of birth, given that GBS colonization
is remarkably homogeneous and stable through time13,14. On the one hand, we offer current information on where
international collaboration is needed and what should be done in order to diminish GBS-related infant morbidity
and mortality; i.e., incrementing GDP in low-income countries and developing a future vaccine against GBS. On
the other, we point out scenarios such as population displacements due to famine, natural disasters or war, where
GBS colonization rates could increase rapidly and become an additional problem, especially for infants.
Another strength of our paper is that it shows new lines of investigation, i.e., how microbiota and GBS colo-
nization may vary after moving to a different country. This task was beyond the scope of our paper due chiefly to
the large amount of people included in this study. Moreover, our research overcomes possible doubts about GBS
isolation due to intermittent vaginal colonization as data from pregnant women is consistent with the isolation
rates found in the aggregated population.
Scientific Reports | (2020) 10:9904 | https://doi.org/10.1038/s41598-020-66811-2 6www.nature.com/scientificreports/ www.nature.com/scientificreports
Figure 4. Correlation between temperature and GBS isolations trends. A coloured circle represents a match
between temperature and GBS isolation trends, a black point represents the birth date of each population with a 95%
confidence interval (dotted line). The best 6-year period matches are fully displayed for each geopolitical area.
Finally, our paper presents remarkable information for a global world, which should help to better treat preg-
nant women and prevent infant mortality. But this is just the beginning, our results should be compared to local
data from countries to picture the actual situation accurately and help scientists to develop new lines of research.
Conclusion
Our paper includes a large population dataset of childbearing age women from almost every major area of the
globe which represents a mini picture of the world. Therein, we have found regional trends in GBS colonization
that are linked to income and, to some extent, to climate. Finally, this information could help identify populations
at higher risk of developing perinatal or post-partum GBS infection in their new countries, and to some extent,
points out possible fields of action to avoid such events.
Received: 5 July 2019; Accepted: 13 May 2020;
Published: xx xx xxxx
References
1. Di Renzo, G. C. et al. Intrapartum GBS screening and antibiotic prophylaxis: a European consensus conference. The J. Matern. Fetal.
Neonatal Med. 28, 766–782 (2015).
2. Nuccitelli, A., Rinaudo, C. D. & Maione, D. Group B Streptococcus vaccine: state of the art. Ther. Adv. Vaccines. 3, 76–90 (2015).
3. Alós-Cortés, J. I. et al. [Prevention of neonatal group B streptococcal infection. Spanish recommendations. Update 2012. SEIMC/
SEGO/SEN/SEQ/SEMFYC Consensus Document]. Enferm. Infecc. Microbiol. Clin. 31, 159–172 (2013).
4. Cassidy-Bushrow, A. E. et al. Maternal group B Streptococcus and the infant gut microbiota. J. Dev. Orig. Health. Dis. 7, 45–53 (2016).
5. Berardi, A. et al. Factors associated with intrapartum transmission of group B Streptococcus. Pediatr. Infect. D. J. 33, 1211–1215
(2014).
6. Kobayashi, M. et al. Group B Streptococcus vaccine development: present status and future considerations, with emphasis on
perspectives for low and middle income countries. F1000Res. 5, 2355, https://doi.org/10.12688/f1000research.9363.1 (2016).
7. Taminato, M. et al. Screening for group B Streptococcus in pregnant women: a systematic review and meta-analysis. Rev. Lat. Am.
Enfermagem. 19, 1470–1478 (2011).
8. Centelles-Serrano, M. J. et al. [Effectiveness of systematic investigation for Group B Streptococcus in urine samples to identify
colonized pregnant women]. Enferm. Infecc. Microbiol. Clin. 27, 394–398 (2009).
9. Valkenburg-van den Berg, A. W. et al. Timing of group B Streptococcus screening in pregnancy: a systematic review. Gynecol. Obstet.
Invest. 69, 174–183 (2010).
10. Andreu, A. et al. [Decreasing incidence of perinatal group B streptococcal disease (Barcelona 1994-2002). Relation with hospital
prevention policies]. Enferm Enferm. Infecc. Microbiol. Clin. 21, 174–179 (2003).
11. Le Doare, K. et al. Association between functional antibody against Group B Streptococcus and maternal and infant colonization in
a Gambian cohort. Vaccine. 35, 2970–2978 (2017).
12. Gilbert, G. L. Vaccines for other neonatal infections: Are group B streptococcal infections vaccine-preventable? Expert Rev. Vaccines.
3, 371–374 (2004).
13. Marchaim, D. et al. Risk factors for carriage of group B Streptococcus in Southern Israel. Isr. Med. Assoc. J. 5, 646–648 (2003).
14. Hansen, S. M. et al. Dynamics of Streptococcus agalactiae colonization in women during and after pregnancy and in their infants. J.
Clin. Microbiol. 42, 83–89 (2004).
Scientific Reports | (2020) 10:9904 | https://doi.org/10.1038/s41598-020-66811-2 7www.nature.com/scientificreports/ www.nature.com/scientificreports
15. Lau, A. S. Y. et al. El Niño altered gut microbiota of children: a new insight on weather-gut interactions and protective effects of
probiotic. J. Med. Food. 22, 230–240 (2018).
16. Brugman, S. et al. A comparative review on microbiota manipulation: lessons from fish, plants, livestock, and human research. Front.
Nutr. 5, 80, https://doi.org/10.3389/fnut.2018.00080 (2018).
17. Gomez de Agüero, M. et al. The maternal microbiota drives early postnatal innate immune development. Science. 35, 1296–1302
(2016).
18. Muñoz, I. et al. [Microbiological surveillance network in the Valencian Community]. Enferm. Infecc. Microbiol. Clin. 26, 77–81
(2008).
19. Weatherbase http://www.weatherbase.com/weather/countryall.php3 (2017).
20. The World Factbook. Central Intelligence Agency https://www.cia.gov/library/publications/the-world-factbook/
rankorder/2004rank.html#sp (2017).
21. High-resolution gridded datasets (and derived products). University of East Anglia https://crudata.uea.ac.uk/cru/data/hrg/ (2019]).
22. GISS Surface Temperature Analysis (GISTEMP v4). NASA Goddard Institute for Space Studies https://data.giss.nasa.gov/gistemp/
(2019).
23. Lenssen, N. et al. Improvements in the GISTEMP uncertainty model. J. Geophys. Res. Atmos. 124, 6307–6326 (2019).
24. Valkenburg-van den Berg, A. W. et al. Prevalence of colonisation with group B Streptococci in pregnant women of a multi-ethnic
population in The Netherlands. Eur. J. Obstet. Gynecol. Reprod. Biol. 124, 178–183 (2006).
25. Ramos, J. M. et al. [Colonization by Streptococcus agalactiae in foreign and Spanish gestating women in the area of Elche (Spain)].
Enferm. Infecc. Microbiol. Clin. 27, 249–251 (2009).
26. Stoll, B. J. & Schuchat, A. Maternal carriage of group B streptococci in developing countries. Pediatr. Infect. Dis. J. 17, 499–503
(1998).
27. Barcaite, E. et al. Prevalence of maternal group B Streptococcus colonization in European countries. Acta. Obstet. Gynecol. Scand. 87,
260–271 (2008).
28. Regan, J. A., Klebanoff, M. A. & Nugent, R. P. The epidemiology of group B streptococcal colonization in pregnancy. Obstet. Gynecol.
77, 604–610 (1991).
29. Zaleznik, D. F. et al. Invasive disease due to group B Streptococcus in pregnant women and neonates from diverse population groups.
Clin. Infect. Dis. 30, 276–281 (2000).
30. Heath, P. T. Status of vaccine research and development of vaccines for GBS. Vaccine. 34, 2876–2879 (2016).
31. Palmeiro, J. K. et al. Maternal group B streptococcal immunization: capsular polysaccharide (CPS)-based vaccines and their
implications on prevention. Vaccine. 29, 3729–3730 (2011).
32. Berardi, A. et al. Group B streptococcal infections in the newborn infant and the potential value of maternal vaccination. Expert Rev.
Anti. Infect. Ther. 13, 1387–1399 (2015).
33. Puertas-Prieto, A. et al. Streptococcus agalactiae: prevention and vaccine development. Rev. Esp. Quimioter. 30, 312–318 (2017).
34. Buurman, E. T. et al. A novel hexavalent capsular polysaccharide conjugate vaccine (GBS6) for the prevention of neonatal group B
streptococcal infections by maternal immunization. J. Infect. Dis. 220, 105–111 (2019).
35. Dadvand, P. et al. Climate and group B streptococci colonisation during pregnancy: present implications and future concerns. BJOG.
118, 1396–1400 (2011).
36. Juárez-Tomás, M. S. et al. Growth and lactic acid production by vaginal Lactobacillus acidophilus CRL 1259, and inhibition of
uropathogenic Escherichia coli. J. Med. Microbiol. 52, 1117–1124 (2003).
37. Semega, J. L., Fontenot K. R. & Kollar, M. A. Income and Poverty in the United States: 2016. 60-259 (Washington, DC; U.S.
Government Printing Office, 2017)
38. Shin, L. The Racial Wealth Gap: Why A Typical White Household Has 16 Times The Wealth Of A Black One, https://www.forbes.
com/sites/laurashin/2015/03/26/the-racial-wealth-gap-why-a-typical-white-household-has-16-times-the-wealth-of-a-black-
one/#2e98c40e1f45 (2015).
Acknowledgements
Thanks to Lisa Alexander and Philip Jones for kindly facilitating the necessary climate data, we are in your
debt. Also thanks to José A. Castejón Esteban and Emilio Gosálbez Pastor for their help with the co-morbidities
data base. And of course, we thank all of the microbiologist and the technicians who collaborate and maintain
RedMIVA, without their effort this paper could not be done.
Author contributions
J.M.S., A.H.C., M.J.C.A., R.C.A., E.D.A., B.A.B. and J.L.L.H. wrote and substantively revised the main manuscript
text. J.M.S.A. and A.H.C. design the study. J.M.S.A. did the analysis and prepared the figures. A.H.C., M.J.C.A.,
R.C.A. and B.A.B. did most of the data acquisition.
Competing interests
The authors declare no competing interests.
Additional information
Correspondence and requests for materials should be addressed to J.M.S.-A.
Reprints and permissions information is available at www.nature.com/reprints.
Publisher’s note Springer Nature remains neutral with regard to jurisdictional claims in published maps and
institutional affiliations.
Open Access This article is licensed under a Creative Commons Attribution 4.0 International
License, which permits use, sharing, adaptation, distribution and reproduction in any medium or
format, as long as you give appropriate credit to the original author(s) and the source, provide a link to the Cre-
ative Commons license, and indicate if changes were made. The images or other third party material in this
article are included in the article’s Creative Commons license, unless indicated otherwise in a credit line to the
material. If material is not included in the article’s Creative Commons license and your intended use is not per-
mitted by statutory regulation or exceeds the permitted use, you will need to obtain permission directly from the
copyright holder. To view a copy of this license, visit http://creativecommons.org/licenses/by/4.0/.
© The Author(s) 2020
Scientific Reports | (2020) 10:9904 | https://doi.org/10.1038/s41598-020-66811-2 8You can also read