Student Managed Investment Fund July 2020 Update - The University of Queensland Business School - UQ ...
←
→
Page content transcription
If your browser does not render page correctly, please read the page content below
The University of Queensland Business School

Student Managed
Investment Fund
July 2020 Update
July 2020 Fund Update
                                                             position in IDX in mid-May at the beginning of our
Fund Review                                                  tenure.

The SMIF portfolio returned 2.54% over the month
of July, outperforming the All Ordinaries
                                                             Market Update
Accumulation Index return of 0.95% by 1.59%. Top
                                                             The Australian All Ordinaries Accumulation Gross
performers in the fund included City Chic Collective
                                                             Index delivered a positive return of 0.95% in the
(ASX:CCX), Northern Star Resources (ASX:NST),
                                                             month of July, as the pace of the market rally
and Breville Group (ASX:BRG), with returns of
                                                             continued to deteriorate due to the economic
17.2%, 15.7%, and 13.9%, respectively. Positions
                                                             uncertainty surrounding the implications of further
which experienced the largest declines include
                                                             COVID induced lockdowns. Travel stocks were hit
Sydney Airport (ASX:SYD), Qube Holdings
                                                             hardest in July, with Webjet (ASX:WEB), Qantas
(ASX:QUB) and CSL (ASX:CSL), with returns
                                                             (ASX:QAN) and Corporate Travel Management
of -7.8%, -6.2%, and -5.9%, respectively.
                                                             (ASX:CTD) all weaker by more than 10%. Surging
                                                             Iron Ore and Gold prices supported natural
CCX saw a significant uplift in its share price after
                                                             resources companies, with the price of gold hitting
announcing their acquisition of U.S. plus-sized
                                                             a record high of US$1981 on the back of continued
fashion retailer, Catherines, from distressed US-
                                                             weakness in global real yields helping companies
listed Ascena Retail Group for US$16mn. Over the
                                                             like Saracen (ASX:SAR) and Northern Star
12 months to April 2020, Catherines achieved
                                                             Resources (ASX:NST). The Australian dollar
online revenues of US$67mn and website traffic of
                                                             remains strong maintaining 0.71 AUD/USD levels,
22mn. The acquisition will fast-track CCX’s online
                                                             appreciating 30% from the March lows.
presence in the US market after CCX acquired the
Avenue and Hips & Curves businesses in 2019.
                                                             Looking overseas, the S&P 500 delivered a strong
Catherines is a well-established player in the U.S.
                                                             positive return of 5.31% in July on the back of Q3
plus-sized apparel market, targeting mature value-
                                                             earnings results that were largely better than
conscious women. With a larger presence in the
                                                             expected, with 85% of companies beating on
U.S. South and Mid-West, Catherines strongly
                                                             earnings by an average of 22.7%. The FAANG
complements CCX’s Avenue acquisition last year
                                                             names all beat expectations, with the standout
(which has a larger focus on the North-East) and
                                                             result being delivered by Apple. Whilst the result
presents significant cross-selling opportunities
                                                             was formidable given the current environment, the
across CCX’s portfolio of brands. With a similar
                                                             team continues to consider its view on the case that
playbook to that of Avenue, the integration of
                                                             that markets are overemphasizing secular
Catherines is expected to be relatively seamless,
                                                             tailwinds and underappreciating the scope and size
with plans to streamline their operating model,
                                                             of fiscal stimulus. As Jamie Dimon declared in
integrate supply chains and logistics, and improve
                                                             J.P.Morgan’s Q3 update, current unemployment
online experience. The company’s pre-release
                                                             insurance (UI) and loan deferrals are potentially
results were also ahead of expectations, with
                                                             just delaying the true size and nature of the
revenues of $195mn up 31% on pcp, and EBITDA
                                                             impending recession. Hence, there is a case to
of $29.3mn, highlighting the strength of the
                                                             argue that Apple might not be a truly defensive
company’s omnichannel model.
                                                             consumer staple company and simply a luxury
                                                             goods     company      currently   supported      by
In July, the SMIF portfolio managers were also able
                                                             Washington D.C.
to speak to the CEO of Integral Diagnostics Limited
(ASX:IDX) Dr. Ian Kadish. We are thankful for his            Looking into August, local markets face two distinct
time and the conversation has added to our                   catalysts; earnings season and the implications of
conviction in the business after entering into a             state-wide reversal of re-openings. Firstly, as
                                                             stated in the June update, EPS estimate

                                                        Student Managed Investment Fund    July 2020 Update    2
dispersions for the ASX are at record highs, with continue its acquisition of attractively priced assets
the Energy and Industrials sectors demonstrating in a time where its competitors are constrained for
the greatest earnings uncertainty. While markets cash. We believe the company is well-positioned to
can take some level of confidence from U.S. continue its expansion coming out of the pandemic.
reporting so far, the disconnect between U.S. and
Australian policy decisions diminishes the validity Growth in number of income-producing sites
of using Q3 reporting as a leading indicator for the
ASX reporting season. The team will be paying
particular attention to company outlook statements
and the potential for a second round of capital
raisings. Secondly, as of writing, the Victorian
government is implementing extensive lockdowns
that will be detrimental to nation-wide growth
through the September quarter. While JobKeeper
and continued stimulus measures have been
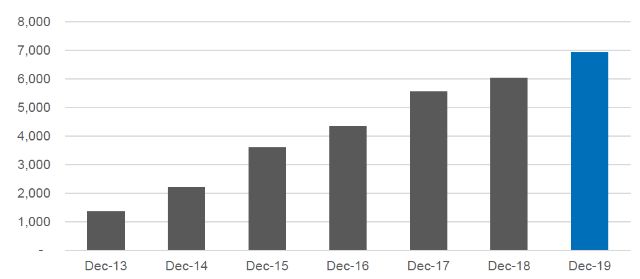
confirmed by policy makers, the pent-up demand Source: Company Reporting Internal Filing Statistics
fueling record retail sales data could begin to While the company’s exposure to holiday parks
reverse as consumer confidence is influenced by along Australia’s east-coast was an initial concern
COVID-19 fatigue and the likelihood of increased in May, since then, we have changed our view and
rightsizing in businesses. see these assets as a positive. As state border
restrictions are reinstated and international travel
Stock Spotlight (ASX:INA) likely impossible until at least mid-2021, we believe
INA’s QLD and NSW holiday parks will benefit from
Ingenia Communities Group was added into the increased local travel for some time to come.
SMIF portfolio in mid-May for its 1) strong demand
Negative sentiment around air-travel and a
from ageing populations who face limited
preference towards coastal, isolated destinations
alternatives, 2) stable inflation-linked cash flows,
would also likely play to INA’s advantage.
and 3) strong development pipeline and acquisition
opportunities. Since then, the position has
performed particularly well and we believe the low-
Portfolio ESG Focus
interest rate environment post-COVID will only In accordance with University of Queensland ESG
create additional pressure on investment income, Policy, the Zion Capital portfolio is managed with
increasing demand for INA’s land lease models an ESG focus maintained throughout. The Portfolio
among self-funded retirees and pensioners. INA’s Managers believe mitigating ESG risk is
pre-reported 325 new home settlements and 179 fundamental to preserving capital in the long run
deposits on hand despite the pandemic, was and as such have selected a portfolio of companies
comparable to the prior FY however average sale with little downside ESG risk and actively manage
prices were higher at $430,000 (compared to the business with a focus on environmental, social
$384,000 in FY19). and governance impacts.
In April, INA engaged in a $175mn equity raising Portfolio and Industry ESG Combined Score
which we believed to be strategic as opposed to comparisons reveal the Zion Capital portfolio to be
addressing liquidity concerns given their undrawn better performing in 7 of the 11 GICS Sectors (see
facilities at the time. Since then, the company has ESG metrics on page 6). The lower relative ESG
completed 2 acquisitions of a 4.2-hectare scores in the Communication Services, Consumer
developed lifestyle community in NSW Central Discretionary, Energy and Utilities sectors can be
Coast and a 6.4-hectare greenfield development explained by smaller market cap holdings and less
site near Ballarat, Victoria, continuing to expand sophisticated or no ESG reporting available for
their rental base and the industry’s largest some holdings. Zion Capital do not perceive
development pipeline. Both acquisitions are material risk to the portfolio with such holdings and
expected to be EPS accretive in FY21/22, with actively seek to ensure any risks are controlled.
INA’s strong balance sheet and size allowing it to
Student Managed Investment Fund July 2020 Update 3Lachlann Smith Bachelor of Advanced Finance & Economics
Portfolio Management Team lachlann.smith@uq.net.au
Name Current Enrolment and Contact Brendan Wilson Bachelor of Advanced Finance & Economics
Golden Chen Bachelor of Advanced Finance & Economics brendan.wilson@uq.net.au
golden.chen@uq.net.au
Matisse Clark Bachelor of Advanced Finance & Economics
matisse.clark@uq.net.au
Quantitative Data:
SMIF Portfolio Holdings:
Ticker Company Name Portfolio Weight Position 30th June Return*
RMD ResMed Inc. 6.6% $15,978 38.9%
BRG Breville Group Limited 6.4% ▲2 $15,636 43.4%
MQG Macquarie Group Limited 6.3% ▼1 $15,313 -2.8%
CNU Chorus Limited 5.8% ▼1 $14,049 25.2%
NST Northern Star Resources Limited 5.1% $12,476 48.6%
APX Appen Limited 4.4% $10,731 103.4%
APA APA Group 4.1% $9,966 -3.0%
BHP BHP Group 4.0% ▲1 $9,702 14.6%
RIO Rio Tinto Group 3.8% ▲1 $9,282 13.4%
SHL Sonic Healthcare Limited 3.8% ▲1 $9,213 46.4%
JHX James Hardie Industries plc 3.7% ▲1 $8,923 11.5%
CSL CSL Limited 3.7% ▼4 $8,913 19.8%
MICH Magellan Infrastructure Fund 3.4% $8,161 -14.1%
WOW Woolworths Group Limited 3.2% $7,891 3.3%
INA Ingenia Communities Group 3.0% ▲2 $7,206 27.2%
PWH PWR Holdings Limited 3.0% ▼1 $7,202 15.5%
CCX City Chic Collective Limited 2.9% ▲2 $6,950 41.7%
QUB Qube Holdings Limited 2.8% ▼2 $6,866 6.0%
SCP Shopping Centres Australasia Property Group 2.4% ▲1 $5,821 -21.0%
SYD Sydney Airport Limited 2.3% ▼2 $5,591 -38.8%
IDX Integral Diagnostics Limited 2.1% $5,232 9.3%
IPH IPH Limited 2.1% $5,193 -0.6%
SSM Service Stream Limited 2.0% $4,861 -15.6%
WBC Westpac Banking Corporation 2.0% $4,785 -38.5%
JLG Johns Lyng Group Limited 1.9% $4,548 1.7%
COE Cooper Energy Limited 1.8% $4,444 -9.0%
BAP Bapcor Limited 1.8% $4,432 -11.7%
Cash and Dividends Receivable 5.8% $14,176
TOTAL $243,539
*Total return on each position since purchase, net of fees, excluding dividends
Student Managed Investment Fund July 2020 Update 4Performance:
1 month 3 months 6 months 12 months Inception (Nov 2018)*
SMIF 2.54% 13.18% -2.88% 1.68% 21.77%
All Ordinaries
0.95% 8.51% -13.62% -9.02% 10.98%
Accumulation Index
Alpha 1.59% 4.67% 10.73% 10.70% 10.79%
*Total return since fund inception on 19 November 2018
Value of $1000 invested since inception
$1,400
$1,300
$1,200
$1,100
$1,000
$900
SMIF (inc. cash) All Ordinaries
$800
Nov-2018 Feb-2019 Jun-2019 Sep-2019 Dec-2019 Apr-2020 Jul-2020
Key Portfolio Multiples: Sector Breakdown:
Metric Change in
% Weight
rank*
Trailing P/E 28.5x
Materials 17.6% ▲1
P/B 3.8x
Health Care 17.2% ▼1
ROE 16.6%
Consumer Discretionary 14.9% -
Financials 12.3% ▲1
Market Capitalisation Breakdown:
Number of Stocks % Weight Industrials 11.8% ▼1
Communication Services 6.1% -
ASX1-100 13 54.0%
Real Estate 5.7% -
ASX101-200 9 27.0%
Information Technology 4.7% -
ASX201-300 0 0.0%
Utilities 4.3% -
ASX301-500 5 13.2 %
Consumer Staples 3.4% -
Cash and Dividends
5.9% Energy 1.9% -
Receivable
*Since last update
Student Managed Investment Fund July 2020 Update 5Key Portfolio Metrics:
SMIF All Ords Acc.
Returns
Annualised return 12.3% 6.3%
Risks
Annual volatility 21.0% 22.6%
Beta 0.87 1.00
Tracking error 11.1% 0.0%
Risk/Return Trade Off
Sharpe ratio 0.45 0.15
Information ratio 0.58 0.00
Jensen's alpha 6.4% 0.0%
Treynor's measure 0.11 0.03
Distribution of Returns
Capture ratio 95% 100%
Downside capture 92% 100%
Upside capture 88% 100%
ESG Metrics:
Industry Average Portfolio Average
80
70
60
50
40
30
20
10
0
Source: Eikon Refinitiv ESG Combined Score (FY0). Industry Average comprised of S&P/ASX300 GICS Sector
average scores.
Information on the Fund and Disclaimer
This update has been prepared by the student portfolio managers of the University of Queensland Business School Student Managed
Investment Fund. The Fund was seeded by the University with $200,000 in 2018 and the first investments were made in November 2018.
The University of Queensland is the sole owner of the assets in the Fund and no fees are payable by the University for the management
of the Fund. The Fund recognises the support of Morgans Brisbane as stockbroker to the Fund.
The information in this update is prepared primarily for educational purposes and to keep internal and external Fund stakeholders informed.
Any views expressed in this update are the views of the student portfolio managers. The accuracy, reliability or completeness of data or
information presented in this update is not guaranteed. The information is not intended as a securities recommendation or statement of
opinion intended to influence a person or persons in making a decision in relation to an investment.
Student Managed Investment Fund July 2020 Update 6You can also read