Subscription vehicles:
end-customer survey
          March 2021
←
→
Page content transcription
If your browser does not render page correctly, please read the page content below

Subscription vehicles:
end-customer survey
March 2021
1 Executive summary ������������������������������������������������������ 3          Table of
                                                                                       contents
2 Scope of research���������������������������������������������������������� 4

3 User demographics������������������������������������������������������� 5

   3.1 Current vehicle�������������������������������������������������������� 6

4 Rental vehicle usage������������������������������������������������������ 7

5 Awareness of subscription services���������������������������� 8

   5.1 Importance of subscription offerings������������������ 9

   5.2 Propensity to use the service������������������������������ 10

   5.3 Preferred price-points������������������������������������������ 11

   5.4 Views about flexibility������������������������������������������ 12

   5.5 Affinity with other subscription services������������ 13

6 Accessories������������������������������������������������������������������ 14

   6.1 How consumers source accessories ���������������� 15

   6.2 Views about accessory providers���������������������� 16

7 Cleaning your car �������������������������������������������������������� 17

8 Paying for parking�������������������������������������������������������� 18

9 Maintaining vehicles���������������������������������������������������� 19

10 Insurance�������������������������������������������������������������������� 20

11 Bundling services������������������������������������������������������ 21

12 Summary�������������������������������������������������������������������� 22

                                                                                                  2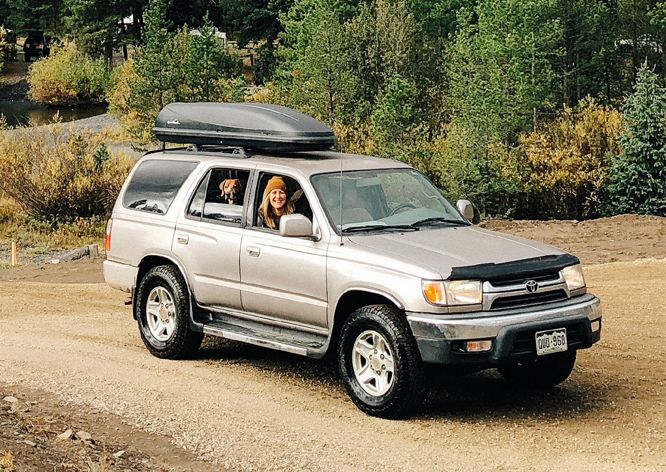
1 Executive summary

                                                               1
                                                               Executive
                                                               summary

    This report represents the result of a quantitative user   QUESTIONNAIRE
    survey on the subject of subscription vehicles.
                                                                   PERIOD:
    GOALS:                                                         Jun 1 -
                                                                   Jun 2 2021
    • Understand users awareness of subscription
      services                                                     PARTICIPANTS:
    • Understand users sensitivities to price and plan type           100
    • Validate interest in flexibility as a benefit                   100

    • Understand current behaviours about associated                  100
      costs, services and accessories                                 100

    KEY FINDINGS:

    • Respondents were interested in considering
      subscription for their next vehicle

    • Price is critical - most respondents were cost-driven
      with ~$500 as the threshold for plan price

    • Bundling and flexibility were consistently ranked as
      favoured options, but brand choice is key

    • Accessories aaS will be a small market unless
      consumers really change their behaviours

                                                                                   3
2 Scope of research

                      2
                      Scope of
                      research

                      QUESTIONNAIRE

                          FORMAT:
                          Self-selection
                          by the respondent

                          NUMBER OF
                          QUESTIONS:
                          27+1 screening
                          question

                          SESSION
                          DURATION:
                          15-20 mins

                          NUMBER OF
                          PARTICIPANTS:
                          400

                          SERVICE:
                          pollfish.com

                                           4
3 User demographics

                                                                  3
                                                                  User
                                                                  demographics

                                                                  Demographics have
                                                                  a relatively even
                                                                  distribution but results
                                                                  in the US may be
                                                                  skewed slightly by a
                         Age range by country                     male, mid/late 30s bias,
    50                                                            and in France may be
                                                                  skewed by a female,
    40
                                                                  late 40/50s bias*.

    30

    20

    10

     0
            FR             DE                 USA            UK
                 18-24   25 - 34   35 -44   45 - 54   54 >

                                                                                         5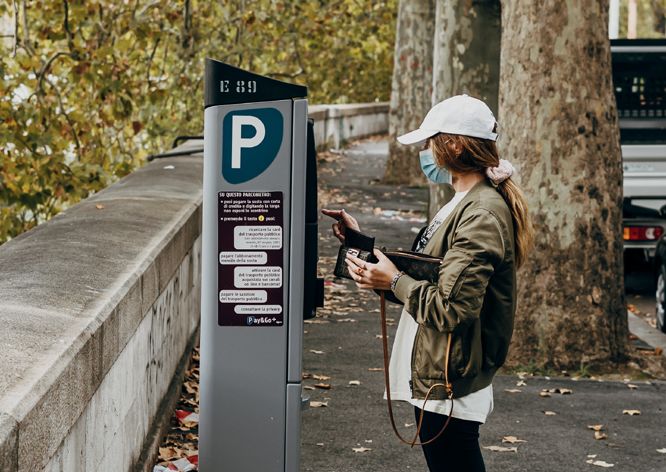
3.1 Current vehicle

                                                                                      3.1
                                                                                      Current
                                                                                      vehicle

                            How old is your primary vehicle?
     50

     40

                                                                                      The average age of
     30
                                                                                      respondent’s current
     20                                                                               vehicle was newest
                                                                                      in UK and oldest in
     10                                                                               France.
      0
                FR                   DE                  USA                     UK
          Less than 1 year old        1-3 years old                 3-5 years old
          5-10 years old              Greater than 10 years old

                     How did you purchase your current vehicle?
     50

     40

     30                                                                               Only the US had
                                                                                      a higher % age of
     20                                                                               consumers on a plan
                                                                                      (HP or PCP).
     10

      0
                FR                   DE                  USA                    UK
                                 Repayment plan     Paid outright

                                                                                                             6
4 Rental vehicle usage

                                                                                            4
                                                                                            Rental vehicle
                                                                                            usage

             Typically, how often would you use a rental vehicle for?
                         7%           1%

              6%                                   19%              Never

                                                                    1 day

       21%                                                          2 - 3 days              Most drivers rent
                                                           10%
                                                                    1 - 2 weeks
                                                                                            vehicles for a few days
                                                                                            or weeks.
                                                                    Up to 1 month

                                                                    More than 1 month

                                                                    Other
                                                 36%

             If you do use a rental vehicle, please indicate why (multiple
                                        choice)
     70%

     60%

     50%

     40%                                                                                    Most drivers rent
     30%
                                                                                            vehicles for vacations
                                                                                            and special occasions.
     20%

     10%

     0%
             Other   I don't always    For gig    For special    For work   For vacations
                        own a car     economy     occasions      purposes
                                        work

                                                                                                                      7
5 Awareness of subscription services

                                       5
                                       Awareness of
                                       subscription
                                       services

                                       Nearly 60% of drivers
                                       are still unaware or
                                       have only limited
                                       knowledge of
                                       subscription services.
                                       But, 40% of drivers have
                                       investigated options
                                       and 24% have quite
                                       good understanding.

                                       US and Germany are
                                       leading the way in
                                       customer awareness,
                                       with the UK lowest in
                                       our survey.

                                                               8
5.1 Importance of subscription offerings

                                                                                                                                    5.1
                                                                                                                                    Importance of
                                                                                                                                    subscription
                                                                                                                                    offerings

                 If you were to try a vehicle subscription service, please rank
                 the following in order of importance to you (multiple choice,
                                       top 3 results used)
     275

     250

     225

     200

                                                                                                                                    Price and choice
     175
                                                                                                                                    of vehicle brand &
                                                                                                                                    specifications were
     150
                                                                                                                                    seen as the most
                                                                                                                                    important factors.
     125
                                                                                                                                    After price, hygiene
                                                                                                                                    rating was the next
     100
                                                                                                                                    most important #1
      75
                                                                                                                                    factor.

      50

      25

       0
               Number of         Flexibility to   Hygiene rating   Flexible pick-up / Choice of vehicle Choice of vehicle   Price
           additional services change model                         drop-off points     specification        brand
           offered by provider according to my
           (parking, car wash,      needs
                 vehicle
            accessories etc)

                                                                    1        2        3

                                                                                                                                                           9
5.2 Propensity to use the service

                                                                                     5.2
                                                                                     Propensity to use
                                                                                     the service

           How likely are you to choose a vehicle subscription when you
                            next change your vehicle?
     30%

     25%
                                                                                     Interestingly, 62% of
     20%                                                                             drivers were moderately
                                                                                     to highly likely to
     15%
                                                                                     choose a subscription
     10%                                                                             service for their next
                                                                                     vehicle.
      5%

      0%
           1 - not at all   2             3             4        5 - highly likely
               likely

                                                                                     Drivers in the >$100k
                                                                                     salary bracket were
                                                                                     most likely to highly
                                                                                     consider subscription
                                                                                     for their next vehicle.

                                                                                                               10
5.3 Preferred price-points
5.3
Preferred
price-points
How much would you be prepared to pay for a vehicle
subscription per month?
40%
35%
30% 64% of drivers
25% expressed a preference
20% to pay less than
15% $500 per month for a
10%
subscription service.
5%
0%
$1500 and $1000 - $750 - $1000 $500 - $750 $300 - $500 Less than
above $1500 $300
Respondents from the
USA were more willing
to pay at higher price-
points, with the UK
least likely to.
115.4 Views about flexibility
5.4
Views about
flexibility
Ideally, how often would you like to change your vehicle for a
different one?
40%
35%
30%
Drivers responses were
mixed for how often
25%
they would change, but
20%
the flexibility to change
15%
whenever they needed
10%
to was clearly popular.
5%
0%
Daily Weekly Monthly Quarterly Yearly Whenever I
need to
How likely would you be to switch your vehicle type to be
able to carry out a different task / job?
40%
35%
Although drivers
30% ranked flexibility as 6/7
25% based on importance,
20% they were quite likely
15% to change vehicle if
10%
they needed one for a
5%
different purpose.
0%
1 - not at all 2 3 4 5 - highly likely
likely
125.5 Affinity with other subscription
services
5.5
Affinity with other
subscription
services
Which other subscription services do you pay for?
(multiple choice)
80%
75%
70%
65%
60%
55%
Drivers are very used
50%
to the subscription
45% economy. Media
40%
consumption is
widespread, and over
35% 50% subscribe to value-
30% added services such as
premium delivery.
25%
20%
15%
10%
5%
0%
Other Gardening or Food or Wine Gym Music streaming Premium Films /
house-clean (eg: Veg or Meal membership (eg: Spotify, delivery (eg: streaming TV
box, Wine Apple Music) Amazon Prime) (eg: Netflix,
selections) Disney+)
136 Accessories
6
Accessories
How often do you use a roof box / trailer / ski rack / bicycle
rack?
60%
55%
50%
45%
40%
35% Bicycle rack is the most
commonly used weekly
30% accessory. Other
accessories are used
25% infrequently.
20%
15%
10%
5%
0%
Bicycle rack Ski rack Trailer Roofbox
Every
Never weekA fewEvery
days couple
a year of weeks Once a month
Once a month A few
Every couple days a yearEveryNever
of weeks week
146.1 How consumers source accessories
6.1
How consumers
source
accessories
When you need an accessory for your car, how do you
typically get it?
45% Most drivers purchase
40% their accessories,
35% but this might be
30% due to a small rental
25% marketplace. Nearly
20% 50% purchase
15% online, which might
10% be a sign that they
5% would subscribe to
0% accessories.
Rent Borrow from family / Purchase from store Purchase online
friend
When using accessories for your vehicle, please rank the
following in order of importance to you
(multiple choice, top 3 results used)
320
280
240
200
Price was clearly the
160 most important factor
120 in deciding whether to
80 use an accessory.
40
0
Potential of Availability of If the vehicle Ease of Price
damage to accessory needs to be assembly
vehicle modified
1 2 3
156.2 Views about accessory providers
6.2
Views about
accessory
providers
How likely would you be to use one provider for all your
accessory needs?
35%
30%
84% of drivers did
express moderate to
25%
high levels of interest
in being able to use
one provider for their
20% accessory needs.
Further investigation
is needed to know
15% if they think of this
as a ordering from a
digital retailer, visiting
a bricks-and-mortar
10%
store, or subscribing to
them.
5%
0%
1 - not at all 2 3 4 5 - highly likely
likely
167 Cleaning your car
7
Cleaning your car
How often do you typically wash your car?
40%
35%
30%
25%
20%
15%
10%
37% of drivers washed
5% their car once a
0% month, and still see
Never A few times a Once a month Every couple of Weekly
year weeks the task as their own,
either washing it
themselves or using
When washing your car, which services do you use?
(multiple choice)
a drive-through. 5%
55% booked through an app,
50% indicating this is not
45%
40%
widespread yet.
35%
30%
25%
20%
15%
10%
5%
0%
Book via an app Pay family or Use a hand-wash Use a drive- Wash it myself
to my location friends to wash service through
it automatic wash
178 Paying for parking
8
Paying for
parking
Unsurprisingly, a
majority of drivers try to
avoid paying often for
parking.
What kind of parking services do you typically use?
(multiple choice)
60%
55%
50%
45%
40%
35% When they do pay, it’s
30%
most commonly for
25%
20% paid street parking.
15%
10%
5%
0%
I only use free Paid private Paid valet Paid off-street Paid street
parking space via app parking parking parking
(eg: JustPark)
189 Maintaining vehicles
9
Maintaining
vehicles
Typically, how often do you get your vehicle serviced or
maintained?
60%
55%
50%
45%
40%
35%
Drivers are fairly regular
30% with maintenance.
25%
20% 59% carry it out at the
15% recommended interval.
10%
5%
0%
Never When instructed by In emergencies only Yearly / at the
the dealer or recommended
company fleet mileage
manager
How do you typically pay for your vehicle servicing and
maintenance?
65%
60%
55%
50%
45% Most drivers still pay in
40%
35%
full for the work once
30% it’s completed, with 28%
25%
20%
paying via a plan.
15%
10%
5%
0%
My company takes care of it A regular monthly payment plan One payment after the work is
completed
1910 Insurance
10
Insurance
When thinking about your vehicle insurance policy, please
rank the following in order of importance to you
(multiple choice, top 3 answers counted)
250
225
200
175
150 Flexibility to adjust
insurance seasonally,
125 and to decrease
costs through safe
100 driving were the most
important for drivers.
75
50
25
0
Ability to carry Ability to decrease Ability to pause Ability to adjust Ability to adjust
insurance from insurance costs payments when the insurance cost to insurance cost
vehicle to vehicle through safe vehicle is not being add/remove other according to
driving used drivers season
1 2 3
2011 Bundling services
11
Bundling
services
How likely would you be to use an all-in-one payment plan
for insurance, maintenance, road taxes and toll fees?
35%
30%
25%
Drivers were keen to
20%
have one plan that
covered all of their
motoring costs, with
nearly 85% expressing
15%
moderate to high levels
of interest.
10%
5%
0%
1 - not at all 2 3 4 5 - highly likely
likely
2112 Summary
12
Summary
KEY INSIGHTS:
• Drivers are still quite traditional. A high number pay for their vehicle in one lump
sum, buy their accessories, avoid paying for parking, wash their car themselves and
only get maintenance done when it’s advised, or when something goes wrong.
• Subscription services are getting the word out, and consumers are finding out
about it. 10 out of our respondents (2.5%) were currently using a subscription
service for their current vehicle.
• Choice of vehicle brand and specification were seen as more critical to the
consumer than flexibility to change vehicle according to the task, but when
prompted, respondents did express an interest in this service.
• Bundling services together (associated costs and procurement of accessories) and
flexible insurance were seen as favoured options.
22CloudMade has a multi-cultural team that designs, About us
develops and deploys software solutions to OEMs
around the world. We are a team of thinkers and doers.
We pride ourselves in thinking from the customer’s
viewpoint and treating our colleagues as equals,
regardless of discipline.
Our organisation has a global reach and you could be
working with a customer in Europe, in the USA and in
Asia, all at the same time. We’re agile and use the latest
software processes and tools to get the job done.
Visit us at www.cloudmade.com.
GET IN TOUCH:
Robert Pitt
Director, Product and Design
robert.pitt@cloudmade.com
23You can also read