Sugar in 2019: Current state of play - Elly Irving, Sustainable Investment Analyst - Schroders
←
→
Page content transcription
If your browser does not render page correctly, please read the page content below
Sugar in 2019:
               Current state of play
Elly Irving, Sustainable Investment Analyst

             Marketing material for professional investors
                                          or advisers only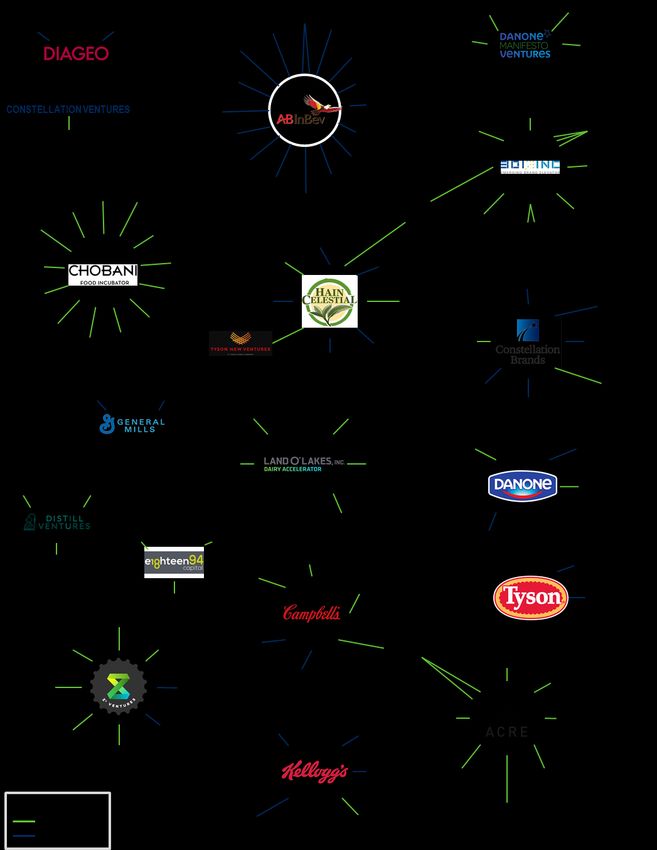
Contents
Part 1: Sugar is a key strategic issue for the sector ..................................................... 4
     Catalyst 1: Increasing awareness amongst consumers and public health bodies ................... 5
     Catalyst 2: Rising healthcare costs – increased prevalence of obesity, diabetes and non-
     communicable diseases putting pressure on governments to act ............................................ 7
     Catalyst 3: Availability of independent scientific research – increasing the possibility of large
     scale litigation ................................................................................................................................ 10

Part 2: The industry is responding ............................................................................... 11
     M&A, divestment and the threat from activist investors ........................................................... 11
     Reformulation, reducing portion sizes and product innovation............................................... 13
     Increase in advertising spend ...................................................................................................... 14

Part 3: How we’re considering sugar risk within our investment process ............... 15
     Engaging for better disclosure ..................................................................................................... 15
     Company research and stock recommendations....................................................................... 16
     Portfolio construction ................................................................................................................... 16

Conclusion ...................................................................................................................... 17

                                                                                                       Sugar in 2019: Current state of play          2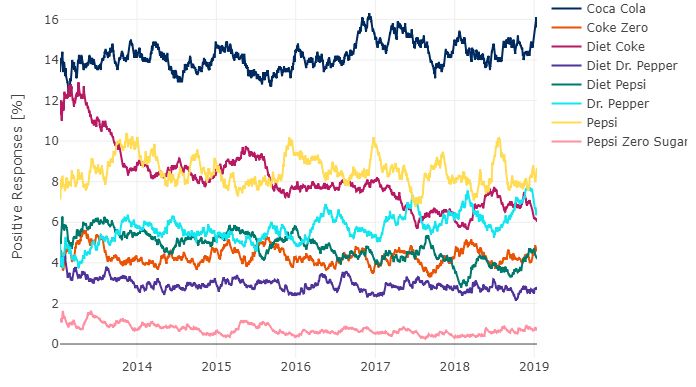
Sugar has become an increasingly important driver of the food and beverage
industry since we first explored the topic in 2015. The health impacts are clearly
worrying, which is translating into increased regulatory attention and consumer
awareness of sugar content. Many companies have responded by reformulating
products and raising advertising spend, but financial pressures on the sector are
growing. We expect the issue to continue moving up social and political agendas,
handing an advantage to those companies that have taken earlier steps to adapt
to a more sugar-constrained industry.

The risks to companies and investors are clear. The rewards for successfully
navigating growing challenges and the costs of inaction will both be huge. The
pick-up in restructuring and activism in the sector underlines a growing
recognition of the sugar issue by major companies in the sector. We don’t think
those risks are reflected in a food and beverage sector that continues to enjoy
valuations 35–40% higher than companies in the tobacco sector or the global
equity market as a whole1.

Sector remains highly-rated. Branded food product average P/E is still at 22.3 versus tobacco sector average of 16.5.
1

                                                                                         Sugar in 2019: Current state of play   3
Part 1: Sugar is a key strategic issue for the sector
As far back as 2015, we identified key catalysts of increased risk to the industry and ways they might translate
into tangible impacts2. The table below describes how these risks have since evolved:
Figure 1: 2015 risk predictions and 2019 state of play
Catalyst Risks State of play in 2019 Industry impacts
identified
2015
Increasing Increasing Healthier challenger brands and private Staples sector volume and price
awareness awareness labels are taking market share from Big Food growth has declined from 5% in
amongst amongst companies. Examples include low sugar, 2011 to below 2% in 20173
consumers consumers high protein ice-cream Halo Top taking share
and public and public and contributing to double digit sales
health bodies health bodies declines for the world's largest ice-cream
manufacturer Unilever
Rising Tougher Regulations around advertising, labelling While we have not yet seen tobacco-
healthcare marketing and voluntary sugar reduction guidelines like litigation, the incidence of
costs and have stepped up. 35 countries now have lawsuits around mismarketing
formulation mandatory restrictions on sugar-sweetened continues to rise. According to
regulations beverages in schools4. Singapore has set World LII legal database nearly 350
voluntary sugar reduction targets to be lawsuits have been brought against
achieved by 2020 and the UK has done the the staples sector in the last three
same for sugary food categories years. Only the banking and
pharmaceutical industries have
faced a higher level of litigation5
Sugar tax While we thought that the industry lobby
may be influential enough to continue with
voluntary targets, the burden of healthcare
costs was enough to convince governments
and states to introduce sugar taxes. 17 new
sugar taxes have been introduced since
2015, with the global total now standing at
42. This means more of the global
population is covered by a sugar tax than by
a carbon tax6
Availability of Tobacco-like Nutritional labelling and industry best While tobacco-like warnings have
scientific product practice is continuing to evolve. For example, not eventuated, media attention and
research warnings authorities have made changes to the consumer awareness means that
nutritional facts label in the US and Hong damage has been done. Brand
Kong. However, tobacco-like warnings have Index shows that perceptions of
not materialised. The American Beverage value are declining: less than 10% of
Association successfully blocked San consumers have a positive
Francisco's tobacco-like warning on sugary perception of product quality across
soft drinks at the US Circuit Court of Appeals 5 of the top 8 carbonated soft
in late 20177 drinks brands8
2
See https://www.schroders.com/en/uk/private-investor/insights/economics/is-sugar-turning-big-food-into-the-next-big-tobacco/
3
WHO, Worldbank, Beverage Daily, Schroders.
4
World Cancer Research Fund International, Schroders.
5
World LII legal database, Schroders.
6
WHO, Worldbank, Beverage Daily, Schroders.
7
https://www.reuters.com/article/us-california-soda-ruling/u-s-appeals-court-blocks-san-francisco-ordinance-on-soda-health-
warnings-idUSKCN1BU24U
8
Brand Index maintains a global survey panel to track consumer perspectives of different brands over time.
Sugar in 2019: Current state of play 4The three catalysts we have identified continue to build, pointing to tougher action and bigger impacts on the
industry in the future.
Catalyst 1: Increasing awareness amongst consumers and public health
bodies
Figure 2: Google trends: Search term – Sugar in coke
Public concern over sugary drinks outpaces smoking worries
120
100
80
60
40
20
0
2004 2006 2008 2010 2012 2014 2016 2018
Sugar in coke Cancer from smoking
Source: Google Trends. Data extracted in December 2018.
The media, consumers and regulators are all increasingly focused on the role of sugar in our diets. Data from
Google trends demonstrates the continued momentum in consumer interest in sugar in soft drinks compared
to a ‘known’ risk of cancer from smoking. There’s no indication that this picture will reverse, putting ever-more
pressure on companies to reformulate their products and ensure the impact of sugar taxes is minimised.
Regulators have attempted to reduce excessive sugar consumption with a range of sugar taxes, advertising
restrictions and voluntary targets. According to the medical journal, The Lancet, 35 countries have now
introduced mandatory restrictions on sugar-sweetened beverages in schools9. Many new regulations and
restrictions like these focus on the next generation of consumers, children between 11–18 years old. Public
Health England (PHE) estimates10 that this age group gets 20% of their daily sugar intake from soft drinks
alone, compared to 11% for adults. The regulatory focus and increasingly negative perception of carbonated
soft drinks has contributed to the continued decline of soft drink volumes, as demonstrated by the graph
below.
Figure 3: Volumes in the US soft drinks markets (mn litres)
80,000
-1.2% pa
70,000
60,000
50,000
40,000
30,000
20,000
10,000
0
2010 2011 2012 2013 2014 2015 2016 2017 2018 2019 2020 2021
Source: Statista, April 2018.
World Cancer Research Fund International.
9
Public Health England, ‘Sugar reduction: Achieving the 20%‘, March 2017.
10
Sugar in 2019: Current state of play 5While most regulations so far have focused on the soft drinks category, the pressure on food producers is also
increasing. While soft drinks can be seen as an easier target because of their ‘empty calories’ (they deliver
sugar and calories but limited nutritional benefit), sugar is also present in other food groups which offer some
nutritional benefit (like protein, fibre or vitamins and minerals) in addition to their sugar content. To address
this, PHE has also set voluntary targets for the food industry. It is aiming for a 20% sugar reduction by 2020
across the food categories with the largest contribution to children’s daily sugar intake. These targets have
been set against a 2015 baseline and a 5% reduction must be achieved in the first year. The categories at risk
are shown in the chart below.
Figure 4: Public Health England (PHE) sugar reduction targets by food category
48.4
Sweet confectionery
60.6
43.8
Chocolate spread
54.8
43.7
Chocolate confectionery
54.6
38.7
Dessert toppings
48.3
34.6
Fruit spreads
43.2
27.9
Cakes
34.9
26.2
Biscuits
32.8
18.6
Ice cream, lollies and sorbets
23.2
15.1
Puddings
18.8
12.3
Breakfast cereals
15.3
11
Yoghurt
12.8
10
Morning goods (pastries, buns)
12.5
3.9
Peanut butter
4.9
0 10 20 30 40 50 60 70
2020 20% reduction target August 2017 5% reduction target Total sugar in 2015
Source: Public Health England, Statista.
Sugar in 2019: Current state of play 6These voluntary targets are a warning shot from regulators. Unless food companies can demonstrate progress
then we believe sugar taxes could extend to these high sugar food categories too. Many international food
majors are taking the threat seriously, using the UK as a test market for new recipes, reformulations and
portfolio mix. Other countries that have introduced a sugar tax, including Australia and South Africa, could
follow a similar path and extend regulatory focus to these food categories too.
Outcome and valuation impact: Increased regulations and a rise in the number of sugar taxes is
driving up R&D budgets and lowering sales volumes. Soft drinks have seen the greatest pressure on
volumes, which on average are down c.6%11 since our first research note in 2015. Going forward, we
think food producers will face more pressure on volumes and costs (given the likely increase in R&D
spend). They are already facing headwinds from the continued rise of private labels and changing
consumer tastes, but we think sugar could compound the challenge and contribute to further declines
in sector volume and price growth.
Catalyst 2: Rising healthcare costs – increased prevalence of obesity,
diabetes and non-communicable diseases putting pressure on governments
to act
The growing number of people globally diagnosed with obesity, diabetes and non-communicable diseases is
undeniable. The World Health Organisation (WHO) states that obesity rates have doubled since 1980 and that
the negative economic impact of obesity alone is greater than the GDP of India. Although we previously
suggested that the strength of the consumer industry lobby and preference for self-regulation may limit the
possibility of sugar taxes, we’ve seen 28 new sugar taxes introduced across the world since 2015. This takes the
global total to 42 sugar taxes, shown on the map below:
Figure 5: Countries with sugar taxes implemented
1. Cook Islands 9. Spain (Catalonia) 17. Hungary 25. Nauru
2. Kiribati 10. Ireland 18. St. Helena 26. Fiji
3. French Polynesia 11. United Kingdom 19. South Africa 27. Samoa
4. Mexico 12. France 20. Saudi Arabia 28. Tonga
5. Chile 13. Belgium 21. United Arab Emirates 29. USA
6. Dominica 14. Norway 22. Mauritius
7. Barbados 15. Finland 23. Seychelles
8. Portugal 16. Estonia 24. Brunei
Source: Media searches, Industry sources, Schroders research
Statista, Soft Drinks market report, 2018.
11
Sugar in 2019: Current state of play 7Growth of sugar taxes
50
40
30
20
10
0
2010 2011 2012 2013 2014 2015 2016 2017 2018
Percentage of global soft drinks market Number of countries
Source: Media searches, Industry sources, Statista, Schroders research
All of these taxes have been applied to soft drinks rather than food products. Recent taxes have also singled
out energy drinks, especially in the Middle East. According to our analysis, the taxes introduced since 2015
have been in countries that meet one or more of the following criteria:
– Level of obesity in the adult population exceeds 20%
– The rate of change in obesity rates exceeds the global average since 1980 i.e. more than doubled
– Diabetes rates exceed 5% of the population
– A significant increase in healthcare spend as a % of GDP. While the increases vary greatly from single digit
increases in smaller countries up to nearly 60% in Saudi Arabia, the average increase over a 20-year period
was 26%
This rising healthcare burden is a key incentive for introducing a sugar tax. The rationale is similar to that for
taxing alcohol to help offset the costs drinking places on public healthcare services and societies. With £45
billion worth of food/beverage related healthcare costs 12 in the UK alone, governments’ incentives for raising
taxes is clear.
To identify countries at risk of future legislation, we have calculated the average healthcare costs and obesity
rates across these countries in which sugar taxes have already been implemented. We have then used these
averages to identify other countries where the increase in healthcare costs or obesity rates is higher. This
analysis is based solely on healthcare spend and obesity rates; it does not account for political appetite or
strength of the national industry lobbies. The countries identified are listed below.
12
The Hidden Cost of UK Food, Sustainable Food Trust, November 2017, www.sustainablefoodtrust.org
Sugar in 2019: Current state of play 8Figure 6: Schroders proprietary sugar tax prediction screen
Source: Schroders.
A sugar tax has already been proposed and defeated in Australia despite the high levels of obesity and
consumer support. The US is also an interesting case; sugar taxes have already been introduced in a number
of states (San Francisco, Boulder, Albany, Oakland, the Navajo Nation, Philadelphia and Seattle), but rejected in
New York, Santa Fe and Massachusetts.
We’ve also looked at longer term trends, and which countries are seeing increases in obesity, diabetes and
healthcare costs, but have not yet reached the same level as the countries who have already introduced sugar
taxes. For example looking at countries where the obesity rate is already at 75% of the obesity and diabetes
rates seen in countries that have introduced a sugar tax may suggest that the additional countries below may
consider sugar taxes in the medium term including some significant emerging markets such as Brazil, Nigeria,
Poland and Russia.
Outcome and valuation impact: Sugar taxes have quickly moved from a local to a global phenomenon.
Companies reliant on high-sugar products are going to come under more and more volume pressure
as their products become relatively more expensive to consumers. Those companies that have already
reformulated their ranges or have less exposed portfolios should benefit relative to slower peers.
Sugar in 2019: Current state of play 9Catalyst 3: Availability of independent scientific research – increasing the
possibility of large scale litigation
In our original research we highlighted the parallels between the food industry and the tobacco industry in the
1980s. To date we have seen an increase in litigation risk for the food and beverage sector, but the majority of
these claims have been for mislabelling and false health claims. According to the World LII legal database there
are nearly 350 lawsuits that have been brought against the staples sector in the last three years. Only the
banking and pharmaceutical industries have faced a higher level of litigation during this period.
Despite this, litigation risk has not reached the scale seen in the tobacco sector in the 1980s and 1990s. One of
the most frequent arguments we’ve heard against sugar being the next tobacco is that smoking can easily be
isolated as the main cause of lung cancer. But unlike smoking, where customers are often loyal to one brand,
people consume multiple food and beverage brands every day. In addition, multiple causes for the non-
communicable diseases have been identified. We believe that scientific research will continue to advance but
our thinking on litigation and causation has evolved.
Accounting for the fact that people’s diets are more complex than their smoking habits, we have reduced the
scale of potential litigation costs by half (using the tobacco industry’s Master Settlement Agreement as a
guide). We have also modelled a low probability of 10% due to the fact that we have yet to see a successful
lawsuit proving corporate practices contributing to obesity. This allows us to model the scale of the potential
fines. We estimate that average forecast earnings for staples could decline by 1.3% due to this litigation risk
alone.
We think litigation risk will follow the more recent tobacco litigation in Canada and award damages on market
share of high risk product and contribution to a given population’s obesity rates. We think governments’
voluntary targets, which focus on higher risk categories such as soft drinks, breakfast cereals, confectionery,
yoghurts and ice cream, provide an indication for product categories that face higher litigation risk.
Outcome and valuation impact: Litigation risk remains material in the industry. Despite challenges
quantifying and attributing the damages caused by sugar consumption, we estimate the impact at
over 1% of current earnings. Companies with portfolios which are structurally less exposed to sugar
are in the strongest positions.
Sugar in 2019: Current state of play 10Part 2: The industry is responding
With sugar firmly on the radar of all stakeholder groups, food and beverage companies need to adapt to
survive these increasing headwinds triggered by the three catalysts above. The key trends we’ve identified are
explained below:
M&A, divestment and the threat from activist investors
Increased stakeholder awareness is a double-edged sword; there is a rise in challenger brands meeting
consumer demand for healthy products, creating a wide range of M&A opportunities for the food majors. But
at the same time, it also changes investor expectations on the speed of product reformulation and portfolio
restructuring. Those companies investing in R&D, product reformulation and acquiring healthier brands are
better positioned to take market share and protect the sustainability of future earnings. But companies failing
to adapt to these new trends fast enough may become a target of activist investors.
Since 2015, we have seen the food majors themselves become a target of activism with a surprise bid for
Unilever from Kraft-Heinz, a company which has focused on the 3G model of cost cutting rather than investing
in R&D into healthier products. There has even been activist investor attention at Nestle over concerns about
earnings growth and the performance of its current portfolio.
The changing profile of the industry is not reversing. During the past three years we’ve seen the continued rise
of smaller challenger brands. According to CBInsights13 there are over 175 new food and beverage start-ups.
Food majors including General Mills, Campbell Soup, and Kellogg’s have all launched or invested in venture
capital funds to foster start-up innovation.
In light of these trends, we continue to believe that companies will need a) a diversified product portfolio and
b) a strong balance sheet to support acquisition of smaller, healthier start-ups. However, reliance on M&A for
growth, over organic investment, is inevitably dilutive for the industry.
CB Insights, ‘175+ Food & Beverage Startups Attacking Grocery Shelves‘, CBInsights website, October 2017.
13
Sugar in 2019: Current state of play 11Figure 7: Major food companies’ private market activity
2015–1 December 2017
Source: CBInsights.
Sugar in 2019: Current state of play 12Reformulation, reducing portion sizes and product innovation
As well as acquiring challenger brands, food and beverage majors are reformulating existing product
portfolios to respond to consumer demand and the threat of sugar taxes. But reformulation success is not
guaranteed; it can be costly and can damage the brand if it doesn’t meet consumer expectations.
In the past two years we’ve seen mixed results. For example, the reduction of sugar in Nestle’s Kit Kats, the first
major recipe change since the Second World War and marketed as an increase in milk and cocoa was met with
negative media attention14. We’ve also seen a swift reaction from private label brands that are keen to benefit
from the rising health and wellness trends by, for example, introducing sugar-free and lower sugar
alternatives. Tesco, the UK-listed supermarket, has reformulated its entire soft drinks range and reduced sugar
content to below 5g per 100ml, which makes them exempt from the UK sugar levy.
YouGov data tracking consumer perceptions in the soft drinks market shows that reformulation can be
challenging. Many soft drinks have swapped sugar for artificial sweeteners to avoid sugar taxes, but this
strategy may not be successful in all markets. As shown in the graphs below, US consumers prefer full sugar
options. Consumers also perceive diet drinks as poor value. In early 2018, ahead of the new UK sugar levy
coming into force, news stories reported that consumers were stock-piling ‘full sugar’ versions of AG Barr’s IRN
BRU15, driven by expectations that the new sugar-free recipe would not be as good. Suntory’s first
reformulation efforts with UK Lucozade also failed and saw sales drop by 8% as a result 16.
Figure 8: Purchase intent: full sugar vs. diet drinks
Source: YouGov’s BrandIndex, Schroders.
History has proven that incremental change works best; manufacturers have successfully reduced salt levels in
crisps and bread by up to 40% over several years without attracting significant consumer attention 17.
We’ve also seen some very innovative solutions from the consumer staples sector. Nestle, for example, has
developed a spherical sugar crystal which will reduce sugar intake by up to 40% without compromising taste or
texture. However, the few global food and beverage majors that do report on R&D numbers paint a mixed
picture; almost a 50/50 split between increases and decreases in R&D investment. Nestle, PepsiCo and Danone
have all made notable increases in R&D spend; on average R&D spend as a percentage of SG&A (selling,
14
Morley, K. ‘New ‘healthier’ KitKat only contains four fewer calories than previous recipes‘, The Telegraph, March 2017.
15
BBC, ‘Irn Bru panic as fans stockpile before recipe change‘, BBC news, January 2018.
16
Fletcher, I. ‘Lucozade sales plummet after brand dramatically cuts amount of sugar in drinks following tax levy‘, The Mirror,
November 2017.
17
Action on Salt, www.actiononsalt.org.uk.
Sugar in 2019: Current state of play 13general and administrative) spend stands at 5.8%. When considering the magnitude of changing consumer
trends and new sugar taxes, investors may question whether relying on acquisitions of challenger brands and
some successful reformulations will be enough for the food and beverage companies to sustain earnings at
their current levels.
Increase in advertising spend
Another response method we’ve seen is an increase in advertising to help offset the move to healthier
alternatives. The introduction of a sugar tax has also contributed to the ‘demonisation’ of sugar, the
perceptions of which advertising agencies are trying hard to fight. Advertising spend data from Societe General
shows that 66% of the top 32 staples brands have increased their ad spend over the last five years18.
Societe Generale, Global Staples and Global Media report, November 2017.
18
Sugar in 2019: Current state of play 14Part 3: How we’re considering sugar risk within our
investment process
Engaging for better disclosure
There is greater pressure on companies, from all stakeholders including investors, to explain how they are
responding to this trend. In 2015, we conducted an earning per share (EPS) sensitivity test on three global food
producers. Depending on the adjustments made to sales growth reflecting changing consumer tastes, and the
weighted average cost of capital (WACC) to account for the risk of changing consumer tastes, we saw a
negative value impact of between 2–25%. However, we recognised that opaque disclosure and restrictive
assumptions hinder our ability to reach firm conclusions.
Our efforts at company-specific analysis also underlined the need for better disclosure. In 2016, together with
another investor, Rathbone Greenbank, we established the Sugar Roundtable, an open, educational forum. It
allowed investors and companies to discuss the emerging health and wellness trends, and the risks and
opportunities facing the industry through advertising, consumer behaviour, national obesity rates, education
and regulation.
We held two meetings and several conference calls, during which we collected the views of over 30 companies.
From this dialogue we drafted Investor Expectations: Sugar, Obesity and Non-communicable Diseases, which
provides a framework for company disclosure. The draft was peer- reviewed by a wide range of stakeholders
from corporates and public health bodies to academics and NGOs (non-governmental organisations). The final
draft is available at the link above and has now been communicated to over 40 global food and beverage
companies19.
We have already seen an improvement in corporate disclosure with greater coverage of the issues around
sugar since the paper’s publication. For example, across the consumer sector annual reports, there has been a
clear trend in mounting disclosure around sugar taxes, as demonstrated by the chart below:
Figure 12: Number of company annual reports referencing sugar tax (2004–2018)
140
120
100
80
60
40
20
0
1 Oct 1 Jul 1 Apr 1 Jan
2007 2010 2013 2016
Company docs
Source: Alphasense.
We analysed the publicly available disclosures of 11 food and beverage companies to benchmark changes in
reporting against our Investor Expectations. We saw positive improvements in transparency at eight out of the
11 companies, with the most progress made against the first principle: governance structure. There is greater
transparency around how boards are assessing the risks and opportunities around sugar and adapting their
strategies in response.
The area where we saw least progress was transparency around public policy and lobbying. Despite escalating
regulation and media coverage, there is little transparency from companies on lobbying spend or alignment
between public commitments and lobbying activity. A summary of our benchmarking results are below:
Schroders, research notes written between November 2015 and January 2018.
19
Sugar in 2019: Current state of play 15Figure 13: Schroders’ benchmark on disclosure against the investor expectations on sugar
Investor expectations: the five principles
Change between 2016
Governance (annual
Overall progress
Implementation
Demonstrating
(annual report)
against sugar
Company
expectations
and lobbying
Public policy
and 20174
progress
Strategy
report)
AG Barr
Associated British Foods Plc
Britvic
Coca Cola Co., The
Kerry Group
Nestle SA
Tate & Lyle Plc
Tesco Plc
Unilever Plc
Whitbread
Wm. Morrison
Key: No progress
Some progress
Meets expectations
Company research and stock recommendations
Our proprietary research platform at Schroders includes over 40 instances of analysts factoring sugar risk into
their stock recommendations, sector research or discussing it at company meetings. The risks and
opportunities around sugar are also being incorporated into our investment processes, with over 50
references to sugar taxes alone across analysts’ notes in our proprietary research database.
Portfolio construction
That analysis is feeding into portfolio decisions across Schroders. For example, the pan-European credit
team started looking at diabetes in 2013, following sustainability team research. As a result, the team adjusted
its sector exposure to mitigate potential balance sheet risk faced by the European food and beverage
corporate bond issuers.
Sugar in 2019: Current state of play 16Conclusion
Of the risks identified in our original research piece in 2015, the majority have risen. Sugar taxes have now
been implemented across 42 nations, states and cities, regulators have tightened rules about advertising and
selling practices, and consumer tastes continue to change. We believe that these trends will continue to create
headwinds for the food and beverages sector, and whilst the soft drinks sector has been hardest hit, we think
food companies now face the greatest pressure to reformulate and innovate to protect future earnings.
Improved corporate disclosure has helped us to more effectively identify industry leaders and laggards but we
will continue to engage and monitor emerging best practice.
Sugar in 2019: Current state of play 17Important information: The views and opinions contained herein are those of the authors as at the date of
publication and are subject to change due to market and other conditions. Such views and opinions may not
necessarily represent those expressed or reflected in other Schroders communications, strategies or funds.
This document is intended to be for information purposes only. The material is not intended as an offer or
solicitation for the purchase or sale of any financial instrument or security or to adopt any investment strategy.
The information provided is not intended to constitute investment advice, an investment recommendation or
investment research and does not take into account specific circumstances of any recipient. The material is not
intended to provide, and should not be relied on for, accounting, legal or tax advice. Any references to
securities, sectors, regions and/or countries are for illustrative purposes only.
Information herein is believed to be reliable but Schroders does not represent or warrant its completeness or
accuracy. No responsibility or liability is accepted by Schroders, its officers, employees or agents for errors of
fact or opinion or for any loss arising from use of all or any part of the information in this document. No
reliance should be placed on the views and information in the document when taking individual investment
and/or strategic decisions. Schroders has no obligation to notify any recipient should any information
contained herein change or subsequently become inaccurate. Unless otherwise authorised by Schroders, any
reproduction of all or part of the information in this document is prohibited.
Any data contained in this document have been obtained from sources we consider to be reliable. Schroders
has not independently verified or validated such data and they should be independently verified before further
publication or use. Schroders does not represent or warrant the accuracy or completeness of any such data.
All investing involves risk including the possible loss of principal.
Exchange rate changes may cause the value of any overseas investments to rise or fall. Past Performance is not
a guide to future performance and may not be repeated. This document may contain “forward-looking”
information, such as forecasts or projections. Please note that any such information is not a guarantee of any
future performance and there is no assurance that any forecast or projection will be realised. For your security,
communications may be taped or monitored.
Note to viewers in the European Union/European Economic Area: Schroders will be a data controller in
respect of your personal data. For information on how Schroders might process your personal data, please
view our Privacy Policy available at www.schroders.com/en/privacy-policy or on request should you not have
access to this webpage. Issued by Schroder Investment Management Limited, 1 London Wall Place, London
EC2Y 5AU. Registered Number 1893220 England. Authorised and regulated by the Financial Conduct Authority.
Note to readers in Argentina: Schroder Investment Management S.A., Ing. Enrique Butty 220, Piso 12,
C1001AFB - Buenos Aires, Argentina. Registered/Company Number 15. Registered as Distributor of Investment
Funds with the CNV (Comisión Nacional de Valores). Nota para los televidentes en Argentina: Schroder
Investment Management S.A., Ing. Enrique Butty 220, Piso 12, C1001AFB - Buenos Aires, Argentina. Inscripto
en el Registro de Agentes de Colocación y Distribución de PIC de FCI de la Comisión Nacional de Valores con el
número 15.
Note to viewers in Brazil: Schroder Investment Management Brasil Ltda., Rua Joaquim Floriano, 100 – cj. 142
Itaim Bibi, São Paulo, 04534-000 Brasil. Registered/Company Number 92.886.662/0001-29. Authorised as an
asset manager by the Securities and Exchange Commission of Brazil/Comissão de Valores Mobiliários (“CVM”)
according to the Declaratory Act number 6816.
Note to viewers in Hong Kong: Schroder Investment Management (Hong Kong) Limited, Level 33, Two Pacific
Place 88 Queensway, Hong Kong. Central Entity Number (CE No.) ACJ591. Regulated by the Securities and
Futures Commission. In Hong Kong, this material is issued by Schroder Investment Management (Hong Kong)
Limited and has not been reviewed by the SFC.
Sugar in 2019: Current state of play 18施羅德投資管理(香港)有限公司
香港金鐘道88號太古廣場二座33字樓 本文件由施羅德投資管理(香港)有限公司刊發並未受香港證監會檢閱。
施罗德投资管理(香港)有限公司
香港金钟道88号太古广场二座33楼 本文件由施罗德投资管理(香港)有限公司刊发并未受香港证监会检阅。
Note to viewers in Indonesia: PT Schroder Investment Management Indonesia, Indonesia Stock Exchange
Building Tower 1, 30th Floor, Jalan Jend. Sudirman Kav 52-53 Jakarta 12190 Indonesia. Registered/Company
Number by Bapepam Chairman’s Decree No: KEP-04/PM/MI/1997 dated April 25, 1997 on the investment
management activities and Regulated by Otoritas Jasa Keuangan (“OJK”), formerly the Capital Market and
Financial Institution Supervisory Agency (“Bapepam dan LK”). OJK makes no representation of approving or
does not approve this advertisement or publication, nor declare the truth or adequacy of the contents of this
advertisement or publication.
Note to viewers in Japan: Schroder Investment Management (Japan) Limited, 21st Floor, Marunouchi Trust
Tower Main, 1-8-3 Marunouchi, Chiyoda-Ku, Tokyo 100-0005, Japan. Registered as a Financial Instruments
Business Operator regulated by the Financial Services Agency of Japan. Kanto Local Finance Bureau (FIBO) No.
90.
シュローダー・インベストメント・マネジメント株式会社
金融商品取引業者 関東財務局長(金商)第90号
加入協会/一般社団法人日本投資顧問業協会、一般社団法人投資信託協会
Note to viewers in People’s Republic of China: Schroder Investment Management (Shanghai) Co., Ltd.,
RM1101 11/F Shanghai IFC Phase (HSBC Building) 8 Century Avenue, Pudong, Shanghai, China, AMAC
registration NO. P1066560. Regulated by Asset Management Association of China.
施罗德投资管理(上海)有限公司
上海(自由贸易试验区)世纪大道8号上海国金中心汇丰银行大楼11楼1101室 施罗德投资管理(上海)有限公司受中
国证券投资基金业协会监管
Note to viewers in Singapore: Schroder Investment Management (Singapore) Ltd, 138 Market Street #23-01,
CapitaGreen, Singapore 048946. Company Registration No. 199201080H. Regulated by the Monetary Authority
of Singapore. This advertisement or publication has not been reviewed by the Monetary Authority of
Singapore.
Note to viewers in South Korea: Schroders Korea Limited, 26th Floor, 136, Sejong-daero, (Taepyeongno 1-ga,
Seoul Finance Center), Jung-gu, Seoul 100-768, South Korea. Registered and regulated by Financial Supervisory
Service of Korea.
Note to viewers in Switzerland: Schroder Investment Management (Switzerland) AG, Central 2, CH-8001
Zürich, Postfach 1820, CH-8021 Zürich, Switzerland. Enterprise identification number (UID) CHE-101.447.114.
Authorised and regulated by the Swiss Financial Market Supervisory Authority (FINMA).
Note to viewers in Taiwan: Schroder Investment Management (Taiwan) Limited, 9F, 108, Sec.5, Hsin-Yi Road,
Hsin-YI District, Taipei 11047 Taiwan, R.O.C. Registered as a Securities Investment Trust Enterprise regulated by
the Securities and Futures Bureau, Financial Supervisory Commission, R.O.C.
本資訊由施羅德投信提供,僅供參考,未經本公司許可,不得逕行抄錄、翻印、剪輯或另作派發。本公司當盡力提供正
確之資訊,所載資料均來自我們相信可靠之來源,惟並未透過獨立之查核;對其完整性、即時性和正確性不做任何擔
保,內容所載之資料與數據可能隨時變更,如有錯誤或疏漏,本公司或關係企業與其任何董事或受僱人,並不負任何法
律責任。
Sugar in 2019: Current state of play 19施羅德證券投資信託股份有限公司 11047台北市信義區信義路5段108號9樓
電話:02-27221868(客服專線:02-87236888)
http://www.schroders.com.tw 施羅德投信獨立經營管理
Note to viewers in the United Arab Emirates: Schroder Investment Management Limited, located on 1st
Floor, Gate Village Six, Dubai International Financial Centre, PO Box 506612 Dubai, United Arab Emirates is
regulated by the Dubai Financial Services Authority.
Sugar in 2019: Current state of play 20You can also read