Summit County, Colorado
2018-2022 Community Health Improvement Plan
←
→
Page content transcription
If your browser does not render page correctly, please read the page content below

Summit County, Colorado 2018-2022 Community Health Improvement Plan

CONTENTS

Executive Summary......................................................................................................................................1

Acknowledgements......................................................................................................................................2

Introduction .................................................................................................................................................4

County Profile ..............................................................................................................................................6

Public Health Priority Area: Mental Health for Families ...........................................................................13

Public Health Priority Area: Opioid Misuse and Abuse .............................................................................18

Public Health Priority Area: Health Equity/Determinants of Health ........................................................23

Conclusion and Next Steps……………………………………………………………………………………………………………………28

References……………………………………………………………………………………………………………………………………………29

Appendix A .................................................................................................................................................30

Appendix B……………………………………………………………………………………………………………………………………………32

Cover Art courtesy of Tracy Fell

EXECUTIVE SUMMARY
Summit County Public Health, in partnership with St. Anthony Summit Medical Center, is pleased to present the 2018-
2022 Community Health Improvement Plan (CHIP). A CHIP and Community Health Needs Assessment (CHNA) are
customary practices of Public Health, a national standard for all public health departments, and a requirement for not-
for-profit hospitals. Our 2017 assessment and planning process were modeled after the Colorado Health Assessment
and Planning System (CHAPS).
Measuring the health of Summit County was a large undertaking. Our process was a collaborative effort that included
representation from more than 30 organizations and stakeholders. The Community Health Assessment (CHA) is
comprised of secondary data as well as robust community input collected via surveys and focus groups. Together, these
assessments illustrate the community’s health status, strengths, and opportunities for the future. Not only does the
assessment present objective data on the health status of Summit County residents, it also offers valuable insights and
opinions on how residents view the quality of life here. Our approach ensured that the process resulted in a community-
driven and -owned CHIP. Readers may review the 2017 CHA at the Summit County Public Health website,
www.SummitCountyCO.gov/PublicHealth.
From the assessment process, community leaders identified the following priorities to improve health, reduce
disparities, and advance equity in the community:
Mental Health (focus on families)
Substance Abuse (focus on opioids)
Health Equity and the Determinants of Health
Although many other health needs are important for Summit County, these three priorities are supported by the data
analysis and were relevant to the majority of community input. Improving community health is not just the work of
public health. No one agency can tackle these complex issues alone, but the collective impact of multiple partners
aligning their efforts toward a common goal is a powerful tool. Fortunately, Summit County enjoys a long history of
community partners collaborating successfully to address community-wide objectives. By focusing on closing gaps in
opportunities and improving outcomes for vulnerable populations, we can create a healthier community that benefits
everyone.
Respectfully submitted,
Amy Wineland, RN, MSN, ND Marshall Denkinger, MD
Director Chief Executive Officer
Summit County Public Health Department St. Anthony Summit Medical Center
Page 1
ACKNOWLEDGEMENTS
    “Never doubt that a small group of thoughtful committed citizens can change the world;
                  indeed, it’s the only thing that ever has.”—Margaret Mead
Summit County Public Health (SCPH) and St. Anthony Summit Medical Center (SASMC) express profound gratitude for
those who devoted their time and expertise to this process. The following individuals worked on the Health Assessment
and/or the development of the Improvement Plan.

       NAME                                                    ORGANIZATION/ROLE

       Robin Albert                                            Summit County Youth and Family Services
       Jeanne Bistranin                                        The Summit Foundation
       Gini Bradley                                            Consultant
       Monica Buhlig                                           Centura Health
       Corrie Burr                                             High Country Healthcare
       Betsy Casey                                             Building Hope Summit County
       Cassie Comeau                                           Summit Community Care Clinic
       Paul Chodkowski                                         St. Anthony Summit Medical Center
       Thomas C. Davidson                                      County Commissioner
       Casey Donohoe                                           Family and Intercultural Resource Center
       Tamara Drangstveit                                      Family and Intercultural Resource Center
       Susan Fairweather                                       Kaiser Permanente
       Erin Fisher                                             NWCCOG Alpine Area Agency for Aging
       Jaime FitzSimons                                        Summit County Sheriff
       Dan Gibbs                                               County Commissioner
       Kellyn Glynn                                            Communities That Care
       Shannon Haynes                                          Town of Breckenridge
       Dan Hendershott                                         Summit County Public Health- Environmental Health
       Whitney Horner                                          Summit County Public Health -WIC
       Sonia Jackson                                           Mind Springs Health
       Jeannette Kintz                                         Mind Springs Health/Summit Community Care Clinic
       Sara Lopez                                              Summit County Public Health
       Julie McCluskie                                         Summit School District
       Rob Murphy                                              Summit Advocates for Victims of Assault
       Tema Nnamezie                                           St. Anthony Summit Medical Center
       Don Parsons                                             Community Member
       Helen Royal                                             Summit Community Care Clinic
       Joanne Sprouse                                          Summit County Human Services
       Karn Stiegelmeier                                       County Commissioner
       Sarah Vaine                                             Summit County
       Trixie VanderSchaff                                     St. Anthony Summit Medical Center
       Sam Weller                                              St. Anthony Summit Medical Center
       Lorie Williams                                          Summit County Community and Senior Center
       Amy Wineland                                            Summit County Public Health

“If you want to walk fast, walk alone. If you want to walk far, walk together.”—African proverb

                                                                                                     Page 2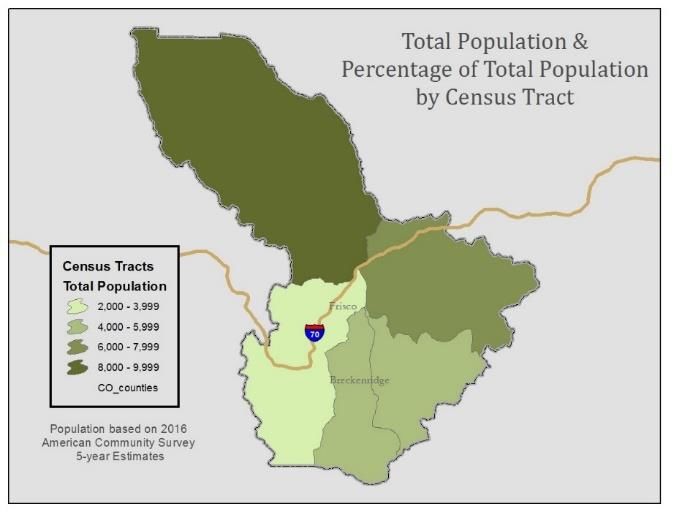
This Health Improvement Plan would not have been possible without the fiscal partners involved in the 2017 Community
Health Assessment, including Colorado Department of Public Health and Environment, Building Hope Summit County
(BH), St. Anthony Summit Medical Center (SASMC), Summit Community Care Clinic (SCCC), the Family and Intercultural
Resource Center (FIRC), and Summit County government.

Data in the analysis was compiled by Corona Insights, an independent research and strategy firm.

                                                                                                   Page 3
INTRODUCTION
To develop the 2018-2022 Summit County Health Improvement Plan, we used the following 11-step process. This is
presented in juxtaposition to the process requirements of the Colorado Health Assessment and Planning System
(CHAPS):

               CHAPS         •Summit County Process
            Requirements

              Plan the       •Review previous plan goals and progress
              Process

             Identify &      •Identify emphasis areas for 2017 research
               Engage        •Survey key experts and practitioners
            Stakeholders

              Conduct        •Review existing data on health issues of interest
             Community       •Survey the English- and Spanish-speaking public
               Health
                             •Conduct focus groups with English and Spanish speakers
             Assessment

                             •Conduct group process to identify potential strategic priority areas
              Conduct
              Capacity       •Identify potential strategies
             Assessment      •Identify resources and champions

              Prioritize     •Finalize priority areas via group process
               Issues

            Develop Local
            Public Health    •Develop strategies and action plan
            Improvement
                Plan

            Implement,
             Promote,        •(2018-2022)
            Monitor Plan

             Inform and
            Participate in   •(2018-2022)
              Statewide
               Planning

                                                                                                     Page 4
To initiate the process, we formed an 18-member steering committee in 2017. Committee members were recruited
because of their interest in and commitment to improving the health and safety of our community. Over several
months, the committee met with Corona Insights, which conducted and produced the 2017 Summit County Community
Needs Assessment. The assessment included review of existing research and data, public surveys in English and Spanish,
public focus groups in English and Spanish, and a key informant survey.

We initially investigated more than 50 issues, and during the course of the process, these were narrowed down into the
highest priority areas over the course of several steps, as listed above. The final three priority areas included in this plan
are:

         Mental Health for                         Substance Abuse                        Health Equity and the
            Families                                  (Opioids)                          Determinants of Health

    Each of these priority areas is discussed in more detail in subsequent sections of this document.

                                                                                                            Page 5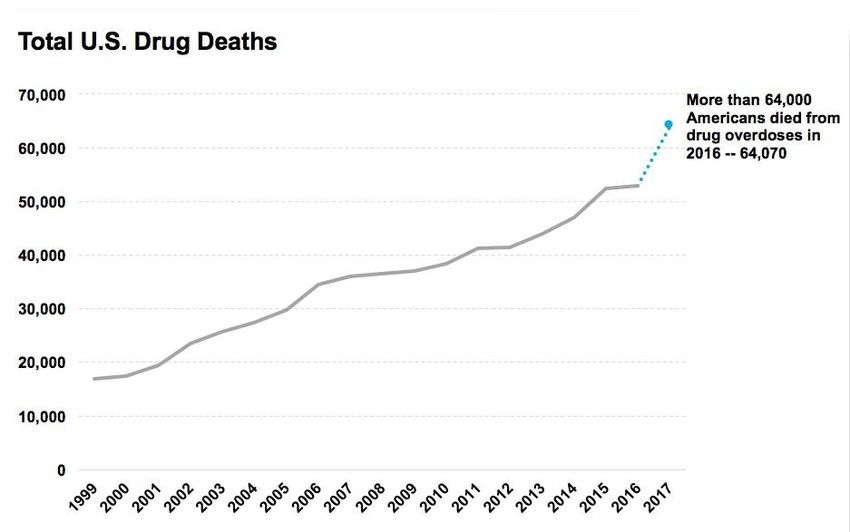
COUNTY PROFILE
Summit County is located in the high Rockies, with elevations ranging from just under 8,000 feet above sea level to a
high point of 14,270 feet. The county is home to slightly more than 30,000 people, approximately half of whom live in
unincorporated areas of the county. The largest incorporated town is Breckenridge, with 5,000 residents, followed
closely by Silverthorne with 4,400 residents. (1)

Among Colorado’s 64 counties, Summit County is the 19th largest in terms of population, and the 55th largest county by
land area, roughly half the size of Rhode Island. Approximately 80 percent of land in the county is federal public land.

Population and Population Growth
The population of the county has increased at an average rate of 1.0 percent per year since 2000. This represents a slower
growth rate than the state is seeing as a whole (1.5 percent per year). (2) (Figure 1 & 2)

                                                                            Summit County Population
                                                                            32,000
                                                                                                       30,367
                                                                            30,000
                                                               Population

                                                                            28,000
                                                                                     25,709
                                                                            26,000

                                                                            24,000

                                                                            22,000
                                                                                     2000               2016

Figure 1                                                     Figure 2

                                                                                                        Page 6
Within Summit County, a slight majority of the population lives in unincorporated areas. However, the Town of
Breckenridge is the jurisdiction in which the largest proportion of growth has occurred since 2000; the Town of
Silverthorne has also seen significant growth. (2) (Figure 3)

                                                                  Population Growth Within Summit County
                                                     4.0%

                                                     3.5%
                                                                 Montezuma, 1%
                                                                                               Breckenridge,
                                                     3.0%                                          42%
                     Annual Growth Rate, 2000-2016

                                                     2.5%

                                                     2.0%

                                                                     Blue River, 5%
                                                     1.5%                                 Silverthorne, 20%

                                                     1.0%
                                                                     Dillon, 3%

                                                                                                                              Unincorporated
                                                     0.5%
                                                                                                                                Area, 27%
                                                                             Frisco, 3%

                                                     0.0%
                                                             0    2,000   4,000   6,000     8,000 10,000 12,000 14,000 16,000 18,000 20,000

                                                     -0.5%
                                                                                             Population in 2016

                Figure 3: The size of each bubble represents the proportion of the county’s population growth that has
                occurred in each area since 2000. For example, 42 percent of population growth has occurred in
                Breckenridge. The X (horizontal) axis represents the 2016 total population, and the Y (vertical) axis
                represents the annual population growth rate of each area since 2000.

                                                                                                                                          Page 7
Workforce
Summit County has a workforce that predominantly supports the tourism and recreation industry. Fifty-two percent of
jobs are in the recreation and arts industry and in food services/accommodations, compared to 14 percent of jobs
statewide. For this and other reasons, the average payroll per job in Summit County is approximately $29,000 per year,
compared with $52,000 statewide. (3) (Figure 4)

  Figure 4: Top Five Employment Sectors Colorado vs Summit County (Percent of Jobs)
                                                                            Summit
                                     Industry                    Colorado   County                      Industry
                                Health care/social assistance       13%       31%       Accommodation/food services
                              Accommodation/food services           12%       20%       Arts/entertainment/recreation
                                                    Retail trade    12%       17%       Retail trade
                                                 Administrative     11%       6%        Real estate
                           Prof., scientific, and tech. services     8%       5%        Health care/social assistance

The most recently reported unemployment rate from the Bureau of Labor Statistics is 1.5 percent for Summit County,
compared to 2.5 percent for the state. (2)

Income and Age
Summit County households have slightly above-average incomes. Despite holding lower-paying jobs, Summit County
households actually slightly outearn the statewide average, with proportionally more middle- and higher-income
households and fewer low-income households. (4) (Figure 5) The higher household income is due in part to a large
proportion of the workforce having multiple jobs because of the high cost of living. Additionally, Summit County has a
higher proportion of working age adults than the state in general, as shown in the following graph. (4) (Figure 6)

                               Figure 5: Household Incomes - Summit County Versus Colorado
                             25.0%
   Percent of Households

                             20.0%

                             15.0%

                             10.0%

                              5.0%

                              0.0%
                                                                                              $100,00 $150,00
                                        Less  $10,000 $15,000 $25,000 $35,000 $50,000 $75,000                 $200,00
                                                                                                0 to    0 to
                                       than     to      to      to      to      to      to                      0 or
                                                                                              $149,99 $199,99
                                      $10,000 $14,999 $24,999 $34,999 $49,999 $74,999 $99,999                  more
                                                                                                 9       9
                           Colorado    5.6%    3.9%    8.6%     9.0%    12.9%   18.2%   13.5%   15.4%   6.5%    6.3%
                           Summit      6.1%    3.6%    4.1%     8.5%    12.4%   20.6%   14.6%   15.3%   7.9%    6.9%

                                                                                                                        Page 8
Figure 6: Age - Summit County Versus Colorado
12%
Percent of Population
10%
8%
6%
4%
2%
0%
10 15 20 25 30 35 40 45 50 55 60 65 70 75 80 85
0 to 5 to
to to to to to to to to to to to to to to to and
4 9
14 19 24 29 34 39 44 49 54 59 64 69 74 79 84 over
Colorado 6% 7% 7% 6% 7% 8% 7% 7% 7% 7% 7% 7% 6% 5% 3% 2% 1% 2%
Summit 5% 4% 5% 4% 8% 10% 9% 9% 7% 7% 8% 7% 7% 5% 3% 1% 1% 0%
Age
Colorado Summit
Ethnicity and Home Ownership
Nearly 9 in 10 households are white and non-Hispanic, and most minority households identify as Hispanic. Because
minority households are much less likely to own their own home, they make up 23 percent of renters and only 5 percent
of homeowners. (4) (Figure 7)
Figure 7: Ethnicity and Home Ownership
2% 1%
100% 6% 4% 4%
8% 9% 12%
Householder Race/Ethnicity
90% 12%
16% 19%
80% 23%
70%
60%
50% 95%
40% 89% 82%
76% 76%
30% 65%
20%
10%
0%
Colorado Summit Colorado Summit Colorado Summit
Total Owner Renter
White Only Hispanic Other Minority
Page 9Language and Income
Approximately one in seven (15 percent) Summit County residents speaks a language other than English at home, with
Spanish being far and away the most common. (4) (Figure 8)
Figure 8: Language Spoken At Home (Age 5 or
Older)
843
3,296
23,778
Speak English at Home
Speak Spanish at Home
Speak Other Language at Home
Significant economic disparities exist by language. Spanish speakers are less likely to own homes (29 percent versus 72
percent), less likely to hold a college degree (20 percent versus 54 percent), and more likely to live in poverty (24
percent versus 10 percent). (4) (Figure 9)
Figure 9: Education by Language Spoken at Home
35%
Bachelor's degree or higher 15%
54%
16%
Some college or associate's degree 16%
29%
High school graduate (includes 12%
34%
equivalency) 16%
37%
Less than high school graduate 35%
2%
0% 10% 20% 30% 40% 50% 60%
Other Language at Home Spanish at Home English At Home
Page 10Health Coverage
A majority of Summit County residents have some sort of health coverage, but the uninsured rate is nonetheless double
the statewide average. (4) (Figure 10)
Figure 10: Uninsured
25%
Percent of Population w/o
19%
20%
coverage
15%
11%
10%
5%
0%
Colorado Summit County
Poverty
Overall poverty rates are nearly equal when comparing Summit County to the state. Summit County seniors have a
notably higher poverty rate than their peers statewide, while women and working age people have slightly higher
poverty rates than their Colorado peers. (4) (Figure 11)
Figure 11: Poverty Rates
25.0%
20.0%
% LIving in Poverty
15.0%
10.0%
5.0%
0.0%
65 and
Total Under 18 18 to 64 White Hispanic Male Female
Older
Colorado 12.2% 15.7% 11.8% 7.4% 10.9% 21.0% 11.2% 13.1%
Summit County 12.1% 12.6% 12.3% 10.0% 10.6% 18.8% 10.5% 14.1%
Colorado Summit County
Page 11Cost of Living
The state of Colorado prepares cost of living estimates by school district. Among Colorado’s 178 school districts, Summit
RE-1 (which encompasses the vast majority of the county) has the second-highest cost of living in the state, with a cost
more than 18 percent higher than the statewide average cost of living. (5) (Figures 12&13)
Figure 12: Cost of Living Index
140
118
120
100
100
80
60
40
20
0
Statewide Index Summit County Index
Figure13
Page 12PUBLIC HEALTH PRIORITY AREA: MENTAL HEALTH
FOR FAMILIES
Mental health includes our emotional, psychological, and social well-being. It
affects how we think, feel, and act. It also helps determine how we handle stress,
relate to others, and make healthy choices. Mental health is important at every
stage of life, from childhood and adolescence through adulthood. (6) Nationally,
one in five adults lives with a mental illness; and 21 percent of youth ages 13-18
and 13percent of children ages 8-15 will suffer from a severe mental disorder in their lifetime. (7) According to Mental
Health America, Colorado ranks 43rd in the nation for mental health, and 48th for youth mental health. The World
Health Organization (WHO), the Centers for Disease Control and Prevention (CDC), and the Substance Abuse and Mental
Health Services Administration (SAMHSA) all emphasize the importance of preventive strategies to promote positive
mental health and wellbeing. Such strategies can reduce the need for more costly treatment services. It is also
recommended that promotion be implemented in a variety of venues, including schools, housing, and health care, to
foster social cohesion and community wellness. These efforts can also identify opportunities for prevention, screening,
and early intervention.
Why is this issue important in Summit County?
Mental health issues are common.
21 percent of residents reported that they themselves have symptoms of depression and/or anxiety.
35 percent of residents reported that someone in their household wanted or needed help for anxiety, which
was more common than any other mental health issue.
66 percent of residents know someone who is struggling with mental health of substance abuse.
1 in 4 Summit HS students report feeling sad or hopeless almost every day for more than 2 weeks.
Mental health issues have significant impacts on people.
Anxiety and depression are linked to suicide. Twenty-two percent of local suicides coincided with issues
regarding anxiety and 47 percent with depression.
Key health experts and practitioners see anxiety as the most common problem among their clients.
Key health experts and practitioners see depression as the most impactful problem among their clients. When
it occurs, it is seen as the mental health issue most likely to have major or catastrophic impacts on the client.
The public wants more attention focused on this issue.
Among 12 tested areas of public health, mental health and substance abuse ranked lowest in the public’s eyes
in terms of areas where the county was “doing enough.” Only 52 percent felt that enough is being done, which
was significantly lower than all of the other areas tested.
The public feels uncomfortable advising others to seek help for mental health issues unless those issues are
seen as a path to harming oneself or others or if they are affecting a person’s ability to hold a job. They would
like to see routine screenings in the health care system to provide this sort of advice.
There are fewer mental health providers in Summit County than in other areas, but there is positive momentum.
Colorado’s Health Rankings show a below average score for the county in the number of mental health
providers per capita.
Page 13 Building Hope works to create a more coordinated, effective and responsive mental health system by focusing
on three major areas: suicide prevention, stigma reduction through mental health education and improved
access to care and support.
Mental health treatment is effective.
Only 60 percent of local people in households who needed mental health treatment received care, but 90
percent of those who received care found it helpful.
School Based Health Centers have seen a significant increase in utilization of behavioral health services overall and in
utilization compared to other visit types. (8)(Figures 14&15)
Figure 14: School Clinic Behavioral Health Visits
2,500 0.70
0.60
2,000
Per Enrolled Student
0.50
Total Visits
1,500 0.40
1,000 0.30
0.20
500
0.10
0 0.00
2011-12 2012-13 2013-14 2014-15 2015-16 2016-17
School Year
Behavioral Health Visits Visits Per Enrolled Student
Figure 15: School Health Clinic Visits by Type
0.70
Visits Per Enrolled Student
0.60
0.50
0.40
0.30
0.20
0.10
0.00
2011-12 2012-13 2013-14 2014-15 2015-16 2016-17
Primary Care 0.26 0.21 0.23 0.24 0.25 0.31
Behavioral Health 0.28 0.37 0.45 0.47 0.50 0.65
Dental 0.43 0.33 0.47 0.42 0.53 0.29
School Year
Page 14MENTAL HEALTH FOR FAMILIES
What can we do about it?
A diagnosis of mental illness like depression or anxiety in one family member affects the whole family. In addition to the
effects on the individual, it may cause tension in relationships and be wearing on the other family members. These
effects can lead to fractures in families, serious disagreement, and sometimes estrangement. These are not intentional
but arise because of differences in understanding what a mental illness is and how to address it. Therefore, a family-
based approach that builds on existing strengths and fosters new skills in families with an overall goal of family
empowerment is ideal.
How do we move forward?
Goal: Enhance the continuum of available services/resources to address varying levels of
behavioral health needs
Objective 1: Deepen our community’s understanding and treatment of the unique needs of high risk populations
Baseline: Currently, there are no intensive outpatient youth services or psychosocial programs in the community
Target: Adolescent intensive outpatient therapy program (IOP) and psychosocial program exist
Data Collection Methods/Sources: Existence of IOP and psychosocial rehab programs; utilization of programs once
established; number of Building Hope crisis/out of home placements in community and schools
Strategy 1: Establish Adolescent Intensive Outpatient Therapy Program (IOP)
Responsible Agencies: SCCC, Building Hope, Mind Springs Health (MSH), Summit School District (SSD)
Action Steps Expected Results Outcome Data Time Line
Collection Methods 2018 2019 2020 2021 2022
Identify community Outcome: An IOP is implemented and Process monitoring to
partners addresses the needs of youth who determine progress and
struggle in their day to day lives because completion of activities X
of mental health challenges and/ or
Pursue/obtain funding substance abuse X
sources
Identify/obtain physical
space for program
X X X X
Identify and train BH
provider for program
X X X X
Initiate program
X X X X
Page 15Strategy 2: Establish a half day Psychosocial Rehab Program.
Responsible Agency: Mind Springs Health
Action Steps Expected Results Outcome Data Time Line
Collection Methods 2018 2019 2020 2021 2022
Identify funding Outcome: Psychosocial program Process monitoring to
requirements implemented and addressing the need determine progress and
for restoration of community functioning completion of activities X
and well-being of individuals diagnosed
Secure funding X X X
with mental health or emotional
Identify space disorder and/or considered to have a X X X
psychiatric disability
Identify/train BH X X X
providers
Initiate program X X
Page 16Objective 2: Improve/enhance the skill sets of families to improve family wellness outcomes
Baseline: Currently there are a few programs in the community that work to improve the wellness of families, but
they only serve a small proportion of parents, and the majority of them serve those with children under age 5.
Additionally, there has been an increase in the number of BH incidents/crises in the schools and within families.
Target: The community has a continuum of strategies that increase protective factors and improve overall family
wellness by reaching out to parents and youth in community-based settings and environments where they already
assemble.
Data Collection Methods/Sources: Number of initiatives implemented, number of mental health incidents in
schools, public perceptions/observations/experiences
Strategy 1: Implement evidence based initiatives
Responsible Agencies: FIRC, Building Hope, SCPH, Y&F Service, SSD, and SASMC
Action Steps Expected Results Outcome Data Time Line
Collection Methods 2018 2019 2020 2021 2022
Identify community Outcome: A variety of prevention and Process monitoring to
partner members educational strategies implemented that determine progress and
will enhance the skill sets of parents, completion of activities X X
improving family wellness
Conduct parent focus
groups to assess needs
X
Determine evidence-
based strategies to
implement such as
community
outreach/educational
events, marketing X X X X X
campaign, youth peer-
peer program, SBIRT,
etc.
Identify /secure
funding X X X X
Implement evidence-
based strategies X X X X
Page 17PUBLIC HEALTH PRIORITY AREA: OPIOID MISUSE AND
ABUSE
The Centers for Disease Control and Prevention has classified prescription drug abuse as an
epidemic. Nationally in 2017, more than 72,000 people died of drug overdoses; 66 percent
of these involved an opioid. This is five times higher than in 1999. (9) Data from the
National Survey on Drug Use and Health (NSDUH) show that nearly one-third of people age
12 and over who used drugs for the first time began using a prescription non-medically.
Drug overdoses have become the leading cause of death for those under age 50. (9) (Figure 16) Though the overdose
deaths for Colorado are lower than the national average, 16.6 vs. 19.8 per 100,000, Colorado ranks second worst among
all states for prescription drug misuse. (10) (11)
Figure 16: Total U.S. Drug Deaths* - More than 64,000 Americans died from drug overdoses in 2016,
including illicit drugs and prescription opioids--nearly double in a decade. Source: CDC WONDER
Why is this issue important in Summit County?
Opioids are a significant problem locally. Select statistics from the 2017 Community Health Needs Assessment include:
One in 25 households is affected. Four percent of residents said that someone in their household had wanted
or needed help with opioid prescription drug dependence.
Opioids are causing local deaths. In 2015, Summit County ranked 11th in the state in opioid deaths. (12)
Key health experts and practitioners see it as one of the most impactful problems among their clients. When
it occurs, it is seen as the second-most-likely mental health issue to have catastrophic impacts on the client,
trailing only major depression.
Combined prevalence and impact are powerful in the community. Based on a survey of key local experts and
practitioners, opioid prescription drug dependence falls into a group of substance abuse issues that represent
a powerful combination of both prevalence and high impact on affected persons. (Figure 17)
Page 18Figure 17: Ranking Prevalence and Impact of Mental Health and Substance Abuse Issues Among Clients
Survey of Local Experts and Practitioners, Comparing 21 Issues
Impact Rank
1
2 Illegal Opioid Use Disorder Prescription Opioid Use
3
4
5
6
7
8
9
10
11
12
13
14
15
16
17
18
19
20
21
21 20 19 18 17 16 15 14 13 12 11 10 9 8 7 6 5 4 3 2 1
Prevalence Rank
Opioids have the public’s attention. When focus group participants were asked to name the most pressing
substance abuse issue in the county, prescription opioids were the second-most-cited issue, following only
alcohol.
Long-acting opioids are prescribed more in Summit County than in the state on average. Time-scheduled
opioids are associated with greater total average daily dosages and increased risk for long term use. In Summit
County, 52 percent of opioids are of the long-duration variety given to opioid-naïve patients, versus a
corresponding figure of 14 percent statewide. (12)
10% of Summit High School students report using a prescription drug that was not prescribed for them (13)
Page 19OPIOID MISUSE AND ABUSE
What can we do about it?
The best ways to prevent opioid overdose deaths are to improve opioid prescribing, reduce exposure to both prescription
and illicit opioids, prevent misuse, and treat opioid use disorder. (10)
How do we move forward?
Goal: Increase the number of community resources to support those struggling with opioid
dependence while also limiting the number of opioid prescriptions available for diversion,
misuse and abuse.
Objective 1: Reduce opioid prescription misuse and abuse
Baseline: 52 percent of patients prescribed long duration opioids vs 13.5 percent statewide
792 pounds of drugs collected at take-back sites and community events in 2017
10 percent of high school students have used prescription drugs without a prescription
Medication Assisted Treatment (MAT) is not available locally
Summit County is 11th in the state for opioid related overdose deaths per capita
Target: 15 percent decrease in opioids prescribed
15 percent increase in pounds of drugs collected at take back sites and community events in 2017
10 percent decrease in high school students who have used prescription drugs without a prescription
Recruit at least two prescribers to provide MAT
10 percent decrease in opioid related overdose deaths
Data Collection Methods/Sources: Summit County Prescription Drug Profile, SASMC prescription data, pounds
collected at Take-Back sites and events, Healthy Kids Survey, MAT sites established, coroner reports, Naloxone RX
filled
Strategy 1: Provider and prescriber education on CDC guidelines, Opioid Alternatives, Medication Assisted Treatment
(MAT) and availability of Naloxone
Responsible Agencies: SCPH, SASMC, Summit County Drug Take Back Task Force
Action Steps Expected Results Outcome Data Time Line
Collection Methods 2018 2019 2020 2021 2022
Establish baseline Outcome: Ability to monitor trends and A variety of reliable local and
data metrics inform decision making by stakeholders state data sources identified
X
Collect and measure X
baseline metrics
Page 20Assess opioid Outcome: Increase the number of SASMC prescription data,
prescribing practices providers & prescribers implementing provider survey
at SASMC the new CDC prescriber guidelines, using X X
ALTO practices, educating clients on
Explore feasibility of take-back locations and availability of Meeting held with UC Health
implementing ALTO in Naloxone on ALTO Pilot
SASMC ER X
Outcome: The number of opioids
Identify funding prescribed at SASMC is decreased by Funding secured X
requirements 15%
Secure funding X X
Coordinate with Number of providers and
Colorado Consortium prescribers attending
to provide provider & trainings X X X X X
prescriber trainings
Screening for SASMC implementing
substance abuse and screenings
mental health issues X X X X X
in healthcare and
other related
community settings
ALTO practices
implemented at
SASMC X X X
Reach out to Outcome: Local pharmacists will Number of pharmacist
pharmacists regarding distribute take-back brochures when meetings and number of
opioid prevention filling opioid prescriptions and discuss brochures distributed X X X X X
efforts availability of Naloxone
Strategy 2: Establish Medication Assisted Treatment site
Responsible Agency: SCPH, SASMC, Ebert Family Clinic
Action Steps Expected Results Outcome Data Time Line
Collection Methods 2018 2019 2020 2021 2022
Identify and recruit Outcome: Two providers in Summit Process monitoring to
two providers to County that provide MAT services determine progress and
provide MAT services completion of activities X X X
Provide training and
support to providers
identified X X
Implement MAT X
Page 21Strategy 3: Establish additional Take-Back locations
Responsible Agencies: SCPH, SASMC, Drug Take Back Task Force
Action Steps Expected Results Outcome Data Time Line
Collection Methods 2018 2019 2020 2021 2022
Identify additional site Outcome: At least one more take-back Process monitoring to
for Drug Take-Back location in the County determine progress and
box location completion of activities X X X
Provide training and
support to new site
X
Implement new Take- X
Back Site
Strategy 4: Increase community awareness and education regarding opioid crisis, safe use, safe storage and overdose
prevention
Responsible Agencies: SCPH, SASMC, Drug Take Back Task Force
Action Steps Expected Results Outcome Data Time Line
Collection Methods 2018 2019 2020 2021 2022
Identify funding Outcomes: Funding secured
requirements and
secure funding Increased community awareness of X X X X X
safe use/storage/disposal of opioids
Identify locations and Number of location and
events where Safe use, Increased poundage of drugs collected events where information is
safe storage and safe at take-back locations and events distributed X X X X X
disposal information can
Increased number of Naloxone
be distributed
prescriptions filled
Utilize existing Students reporting using prescription Number of ads on buses,
marketing campaign drug without a doctor’s prescription radio stations, newspaper ads
that targets the general will decrease by 5% and articles, etc.
public and overcomes
X X X X X
existing obstacles and
misperceptions about
opioids; provides
education on safe
use/storage/disposal
and availability of
Naloxone
Provide community Number of community
awareness presentations awareness presentations
about the opioid X X X X X
epidemic and efforts to
address it
Provide education to Events conducted
students and parents
about the opioid X X X X X
epidemic and risks or
misuse of opioids
Page 22PUBLIC HEALTH PRIORITY AREA: HEALTH EQUITY/
DETERMINANTS OF HEALTH
According to The World Health Organization (WHO), health equity “implies that ideally,
everyone should have a fair opportunity to attain their full potential and that no one
should be disadvantaged from achieving their potential.” (14) Conversely, equity is
undermined when preventable and avoidable systemic conditions constrain life
choices.
Systemic conditions are largely the social and economic factors known as the social
determinants of health. The World Health Organization defines the social determinants of health as the circumstances in
which people are born, develop, live, and age. They include:
Income and income distribution
Early life
Education
Housing
Food security
Employment and working conditions
Unemployment and job security
Social safety net
Social inclusion and exclusion
Health services
Addressing social determinants of health is important for achieving greater health equity.
The presence of health disparities is well established in the United States. Longstanding research has consistently
identified disparities experienced by racial and ethnic minority, low-income, and other vulnerable communities. The U.S.
Department of Health and Human Services defines health disparities as “differences in health outcomes that are closely
linked with social, economic, and environmental disadvantage.” (15) Healthy People 2020 goes on to state that “health
disparities adversely affect groups of people who have systematically experienced greater obstacles to health based on
their racial or ethnic group; religion; socioeconomic status; gender; age; mental health; cognitive, sensory, or physical
disability; sexual orientation or gender identity; geographic location; or other characteristics historically linked to
discrimination or exclusion.” (16) Achieving health equity—defined by Healthy People 2020 as the highest level of health
for all people—will require addressing these social and environmental determinants through both broad population-
based approaches and targeted approaches focused on those communities experiencing the greatest disparities. (16)
Why is this issue important in Summit County?
Summit County recognizes that within a seemingly affluent community, there are pockets of need where our residents
may not have opportunities to attain their full potential. These populations are disproportionately affected by health
issues, which are impacted by differences in key determinants of health such as race/ethnicity, education, employment,
socioeconomic status, and housing.
Unfortunately, many of the households that are eligible for assistance are not receiving it. There could be many reasons
for this – a lack of awareness, language issues, stigma about requesting it, or other reasons – but the bottom line is that
programs that could help the quality of life of lower-income households are not being fully utilized.
Page 23The following statistics show the gap (17) (Figure 18):
Only 17 percent of approximately 900 of those eligible for CCCAP (Colorado Child Care Assistance Program)
benefits are enrolled.
Only 19 percent of approximately 4,600 of those eligible for SNAP (Supplemental Nutrition Assistance
Program) benefits are enrolled.
Only 24 percent of approximately 400 of those eligible for Colorado Works benefits are enrolled.
Only 54 percent of approximately 900 of those eligible for WIC (Special Supplemental Nutrition Program for
Women, Infants, and Children) benefits are enrolled.
Only 77 percent of approximately 4,800 of those eligible for Medicaid benefits are enrolled.
33.3 percent of children in Summit County qualify for Free or Reduced Priced Lunch (18)
Figure 18: Program Enrollment Gaps
6,000
Eligible People/Households
5,000
4,000
3,000
2,000
1,000
0
Colorado Child Colorado Works Medicaid Supplemental Women Infants
Care Assistance Program Nutrition Childen Program
Program Assistance
Program
Enrolled Eligible But Not Enrolled
We also see evidence in the 2017 Community Health Needs Assessment that this is the case. In particular:
Lower-income households report a lower quality of life. Overall, the residents view the quality of life in Summit
County as being very good. However, younger residents, those with lower household incomes, and those with lower
education levels are far less likely to make this claim. The difference is particularly strong with regard to income.
One in five households say that their personal financial situation is not good. Also, 27 percent believe that they do
not have strong career opportunities in the county. These issues disproportionately affect children: 33 percent are
eligible for free or reduced lunch at school.
Anxiety is more common at lower incomes. While 35 percent of county residents report that someone in their
household wanted or needed help for anxiety, the figure rises to 47 percent among those with incomes below
Page 24$50,000. Local experts and practitioners believe that anxiety has a notable impact on quality of life among the
clients that they see.
The cost of living is high. Cost of living is officially measured by school district in Colorado, and Summit County’s
school district has the second-highest cost of living of any district in the state. (5) This means that incomes don’t buy
as much in Summit County, placing additional financial stress on households.
What can we do about it?
The most well-intentioned effort to reduce disparities is less likely to succeed if it is not part of a broader culture of
equity. (19) Therefore, it is essential to ensure that disparities are openly recognized by community partners and that
they are committed to reduce them. Moreover, by being culturally responsive, agencies working with various
populations can better understand an individual’s diverse values, beliefs, and behaviors, and customize services and
resources to meet social, cultural, and linguistic needs.
Additionally, programs exist to provide assistance to households at the lower end of the income spectrum. These programs
serve to increase a household’s “effective income” by providing goods or services at no cost or below-market cost. This
assistance can ease financial pressure, which would increase the recipients’ quality of life and decrease anxiety.
How do we move forward?
Goal: Create a community-wide system of Equity to address needs of under-resourced
populations
Objective 1: Deepen the community understanding of the complex needs of under-resourced populations
Baseline: Currently there is no coordinated effort to educate community partners on health equity and cultural
responsiveness and address the needs of under-resourced populations, and little that includes this population in any
leadership capacity.
Target: Increased awareness, understanding and ways to address the needs of under-resourced populations among
community partners.
Data Collection Methods/Sources: Number of participants in community presentations/trainings, health equity
assessment results, number of partners engaged in implementing a roadmap for health equity.
Strategy 1: Improve community partner awareness of health equity and cultural responsiveness
Responsible Agency: FIRC
Action Steps Expected Results Outcome Data Time Line
Collection Methods 2018 2019 2020 2021 2022
Develop and cultivate core Outcome: Increased awareness and Process monitoring to
coalition group by ability to serve under-resourced determine progress and
engaging partners across populations among community partners completion of activities X X
sectors that includes
members from under-
resourced populations
Page 25Identify funding
requirements and secure
funding X X
Engage community Number of attendees at X X
partners in Health Equity trainings
trainings
Complete community wide Number of trainings
training/assessment of
organizational leadership
and practices in addressing
needs of under-resourced Number of organizations X X
populations assessed
Engage community Number of organizations X X X
partners in creating and participating in
implementing health implementation
equity roadmap
Page 26Objective 2: Increase community capacity to address the Social Determinants of Health among community partners.
Baseline: Currently few agencies screen needs related to Social Determinants of Health (SDoH) and there are numerous
residents that are eligible but not enrolled (EBNE) in various community, state, and federal programs that address these
needs.
Target:
Increase number of providers who screen for SDoH
Increase enrollment rates in WIC, Medicaid, SNAP, etc.
Increase community based strategies to increase trust among disparate populations
Data Collection Methods/Sources: enrollment rates in various programs, utilization of food banks, number of agencies
screening for SDoH, establishment of Community Health Workers program
Strategy 1: Address determinants of health by increasing utilization of existing community resources
Responsible Agencies: FIRC, SCPH, SASMC, SCCC, Ebert Family Clinic
Action Steps Expected Results Outcome Data Time Line
Collection Methods 2018 2019 2020 2021 2022
Identify community Outcomes: Process monitoring to X X
partners determine progress and
Increased enrollment in existing completion of activities
Develop standardized programs that address determinants of
process for resource health Number of agencies
referral to bolster using screening tool X X
enrollment and Increased number of agencies that are
participation in programs utilizing SDoH screening tool Enrollment rates in
programs
Develop or identify existing Hispanic community has access to X X
screening tool Spanish – language health fair Number of outreach
events
At least two community health workers
Identify agencies/ health
navigators to use screening are actively working in the community to Funding for community
tool build trust and capacity among disparate health worker model X
populations established and
Identify /create workers hired and
opportunities to engage trained
with target populations in X X X X X
Number of participants
community based settings
in health fair
Develop scope and
business plan for
community health worker X X
model
Secure funding X X
Implement a community X X
health worker model
Identify partners for and
organize a Spanish-
language Community X X
Health Fair
Conduct Spanish-language X X X X
Community Health Fair
Page 27CONCLUSION AND NEXT STEPS
The implementation of the Community Health Improvement Plan will be monitored by the Summit County Care
Collaborative. Each priority subcommittee will report out on progress toward meeting set goals and strategies on a bi-
annual basis. Updates to the Summit County Board of Health will be provided quarterly by the Public Health Director.
St. Anthony Summit Medical Center has a three year cycle and will review in three years to determine next steps for
addressing community health in Summit County. St. Anthony Summit Medical Center is committed to aligning efforts with
Summit County Public Health and those of community partners, as community input and coordinated efforts are essential
to address the public health opportunities in our community.
Summit County has much to be proud of. We have many valuable resources that contribute to a better quality of life.
Overall, our community is a safe and healthy place where residents can live and thrive. Although we scored well on many
measures of health outcomes and indicators, there is still opportunity for growth. This improvement plan provides a
roadmap to a healthier community by the year 2022. The CHIP is a living document and may be amended and enhanced
as work progresses.
Page 28REFERENCES
1. Summit County Government . About the Communtiy. Summit County Colorado. [Online]
http://www.co.summit.co.us/570/About-the-Community.
2. United States Census Bureau. Summit County Colorado. United States Census Bureau. [Online] 2017.
https://www.census.gov/quickfacts/fact/table/summitcountycolorado/PST045217.
3. Colorado Department of Local Affairs. Demographic and Econmomic Trends in Colorado and Region 12. Denver : State
Demography Office, 2018.
4. United States Census Bureau. American Community Survey. U.S. Census Bureau. [Online] 2016.
https://www.census.gov/programs-surveys/acs/data.html.
5. Pacey Economics, Inc. 2015 School District Cost of Living Analysis . Boulder, CO : Pacey Economics, Inc., 2016.
6. Centers for Disease Control and Prevention. Mental Health. Centers for Disease Control and Prevention. [Online] January 2018.
https://www.cdc.gov/mentalhealth/learn/index.htm .
7. National Institute of Mental Illness. Health Information-Statistics. National Institute of Mental Illness. [Online] November 2017.
https://www.nimh.nih.gov/health/statistics/mental-illness.shtml.
8. Summit County Community Care Clinic. School Based Health Services Visist types. Frisco : Summit Community Care Clinic, 2011-
2017.
9. Centers for Disease Control and Prevention. Annual Report of Drug-Related Risks and Outcomes. Atlanta : CDC National Center
for Injurty Prevention and Control, 2017.
10. —. Confronting Opioids. CDC.gov. [Online] April 2018. https://www.cdc.gov/features/confronting-opioids/index.html.
11. State of Colorado Office of the Governeor . Colorado Plan to Reduce Prescription Drug Abuse. Denver : s.n., 2013.
12. Colorado Department of Public Health and Environment. Summit County RX Drug Data Profile. Denver : Colroado Department
of Public Health and Environment, 2017.
13. —. Healthy Kids Survey. Denver : CDPHE, 2015.
14. World Health Organization. Heatlh Equity. World Health Organization. [Online] World Health Organization, 2018.
http://www.who.int/topics/health_equity/en/.
15. Kaiser Family Foundation. Beyond Health Care: The Role of Social Determinents in Promoting Health and health Equity. KFF.org.
[Online] Kaiser FAmily Foundation, May 2018. https://www.kff.org/disparities-policy/issue-brief/beyond-health-care-the-role-of-
social-determinants-in-promoting-health-and-health-equity/view/footnotes/%20-%20footnote-168746-13/.
16. Office of Disease Prevention and Health Promotion. Social Determinants of Health. Healthy People 2020. [Online] U.S.
department of Health and Human Services Office of Disease Prevention and Health Promotion, 2017.
https://www.healthypeople.gov/2020/topics-objectives/topic/social-determinants-of-health.
17. Colorado Center on Law and Policy. Human Services Gap Map. GapMap. [Online] Colorado Center on Law and Policy, 2016.
http://gapmap.org/.
18. The Annie E. Casey Foundation. Colorado Kids Count. Denver : Colorado Children's Campaign, 2017.
19. Robert Wood Johnson Foundation. Roadmap to Reduce Disparities. Solving Disparities. [Online] 2018.
http://www.solvingdisparities.org/tools/roadmap.
Page 29APPENDIX A
Priority Areas Considered
The 2018-2022 Community Health Needs Assessment for Summit County was conducted to inform the development of
the priorities for the five-year Community Health Improvement plan for public health improvement in Summit County.
The study examined over 50 issues for Summit County to varying degrees of depth.
Issues Considered and/or Investigated
Access to Health Care Eating Disorders Major Depression Preventative
ADD/ADHD Eligibility for Assistance Marijuana Dependence Screenings
Alcohol Exercise Mental Health (General) Quality of Life
Alzheimer’s Health Coverage Non-Opioid Prescription Safe Food
Anger or Oppositional Heart Disease Drug Dependence Safe Sex
Defiance Household Incomes Nutrition Schizophrenia
Anxiety Housing/Transportation Obesity Seat Belt Use
Autism Illegal Drug Dependence Obsessive Compulsive Seniors
Bipolar Disorder Impaired Driving Disorder Social Connections
Cancer Infectious Disease Opioid Prescription Drug Substance Abuse
Child Care Prevention Dependence (General)
Childhood Vaccination Injury Prevention Oral Health Suicide
Clean Air and Water Job Training Post-Traumatic Stress Tobacco Dependence
Cost of Living Language Disorder (PTSD) Use of Violence
Pregnancy Youth
Supporting Documents
Two other documents exist in addition to this document.
The 2017 Community Health Needs Assessment Research Report summarizes all of the research that led to this
plan.
The 2017 Community Health Needs Assessment Key Research Summary and Prioritization Report summarizes
the prioritization process and capacity summary.
Page 30Mental Health for Families
• Deepen our community's understanding and treatment of
the unique needs of high risk populations
• Establish Adolescent Intensive Outpatient Therapy
Program
• Establish half day Psychosocial Rehab Program
• Improve/enhance the skill set of families to improve family
wellness outcomes
• Implement evidence-based initiatives
Opioid Misuse and Abuse
• Reduce opioid prescription misuse and abuse
• Provider/prescriber education on CDC guidelines, opioid
alternatives, Medication Assisted Treatment, and
availability of Naloxone
• Establish MAT site
• Establish additional Take-Back locations
• Increase communtiy awareness and education regarding
opioid crisis, safe use, safe storage, and overdose
prevention
Health Equity/Determinants of Health
• Deepen our community's understanding of the complex
needs of under-resourced populations
• Improve community awareness of health equity and
cultural responsiveness
• Increase community capacity to address the Social
Determinants of Health among communtiy partners
• Increase utilization of existing communtiy resources
Page 31APPENDIX B
SUMMIT COUNTY BOARD OF HEALTH
SUMMIT COUNTY HEALTH PLAN
APPENDIX A
Numerous counties and towns in Colorado and around the U.S. continue to address the problems
associated with the storage, accumulation, collection and disposal of garbage, trash, debris and other discarded
materials. The improper control of these materials is a matter of substantial public concern and may create a
variety of environmental and public health impacts that can adversely affect the public health, safety and
welfare.
One aspect of this problem involves the curbside placement of garbage for pickup by a trash collector.
The improper placement of trash for pickup can result in the dispersal of trash and other discarded materials into
the environment due to the extreme weather we face in Summit County and the presence of wildlife and other
animals that might be attracted to such materials. The resulting dissemination of trash and other debris with all
of its attendant adverse public health and environmental impacts requires that Summit County ensure the
orderly collection and disposal of such garbage, trash and debris.
“Public health” by definition means the prevention of injury, disease, and premature mortality; the
promotion of health in the community; and the response to public and environmental health. C.R.S. 25-1-
502(5). Every county in Colorado is to have a board of health harnessed with the powers and duties to
“administer and enforce the laws pertaining to public health, air pollution and most importantly in the case,
solid and hazardous waste. C.R.S. 25-1-506(3)(b)(IV). Colorado public health laws, including Part 5, Article 1,
Title 25, C.R.S., also authorize the Summit County Board of Health to promulgate rules in the unincorporated
area of Summit County to protect the public health, safety and welfare.
The Center for Disease Control and Prevention has stated that controlling waste is an important part of
public health and safety. Waste that is improperly managed can create conditions that may have severe adverse
effects on public health and the environment. Key elements in controlling infectious wastes include proper
storage, collection, transportation and disposal of waste. To address the issues of improper solid waste storage,
collection and disposal, Summit County’s health plan should include the following rules regarding the disposal
of trash:
GARBAGE RECEPTACLES; PLACEMENT OF RECEPTACLES AT CURBSIDE:
I. Definitions:
The term “garbage” as used herein shall refer to garbage, trash, debris, solid waste and other discarded
materials.
The term “receptacle” as used herein shall refer to a watertight metal or nonabsorbent container equipped with a
tightly fitting galvanized metal or nonabsorbent cover or lid, and shall exclude paper and plastic bags.
Page 32II. Garbage may be placed at the curbside for pick up by a trash collector only in accordance with the
following rules:
A. 1. Garbage may be placed at the curbside for pick up only when fully contained within a receptacle. No
garbage may be placed at the curbside in a paper or plastic bag, or other container that is not a
receptacle.
2. Any receptacle placed for curbside garbage pick-up shall be kept closed and secured with no gap
between the container and the lid until it has been emptied by the trash contractor and moved back to its
normal location.
3. Receptacles may be placed at the curbside only after six o'clock (6:00) A.M. on the day of pick up.
After pick up, each receptacle must be moved back to its normal location by ten o'clock (10:00) P.M. of
the same day.
B. The provisions of this section shall not apply to: (1) a receptacle maintained by a business that is: (a)
primarily intended as a convenience for use by the customers of the business (and not the business
itself); and (b) designed in such a manner as to discourage wildlife from getting into the receptacle or the
dispersal of such debris by weather events; or (2) garbage that consists of recyclable material (defined as
only discarded glass, cardboard, aluminum, tin, newspaper and office paper products that are separated
from other refuse for the purpose of recycling), that is placed at the curbside for pick up by a trash
collector.
C. The owner of real property and any other person who causes the accumulation of garbage at the owner's
property are both individually responsible for any garbage placed, stored, or kept at such property in
violation of this section.
III. Violations of these rules shall be unlawful and enforced in accordance with Sections 25-1-516 and 518,
C.R.S., as well as all other applicable provisions of Colorado law.
Page 33You can also read