Supplements of: Importance of succession in estimating biomass loss: Combining remote sensing and individual-based forest models
←
→
Page content transcription
If your browser does not render page correctly, please read the page content below
Supplements of:
     Importance of succession in estimating biomass loss: Combining
     remote sensing and individual-based forest models
     Ulrike Hiltner1,2,3, Andreas Huth2,4,5, Rico Fischer2
 5
     1
      Institute of Geography, Friedrich-Alexander-University Erlangen-Nuremberg, Erlangen, 91058 Germany
     2
      Department of Ecological Modelling, Helmholtz-Centre for Environmental Research GmbH - UFZ, 04318 Leipzig, Germany
     3
      Department Environmental System Sciences, ETH Zurich, 8092 Zurich, Switzerland
     4
         German Centre for Integrative Biodiversity Research – iDiv Halle-Jena-Leipzig, Leipzig, 04103 Leipzig, Germany
     5
10       Institute for Environmental Systems Research, University Osnabruck, Osnabruck, 49076 Osnabruck, Germany
     Correspondence to: Ulrike Hiltner (u.hiltner.uh@gmail.com)

            Supplements

     Figure S 1: Development of (a) gross primary production and (b) net primary production of the total stand and three succession
15   types for Terra Firma forests in French Guiana. The disturbance intensity of 1.29% indicates natural forest growth in the baseline
     scenario. (GPP: gross primary production, NPP: net primary production, ODM: organic dry matter).

                                                                     1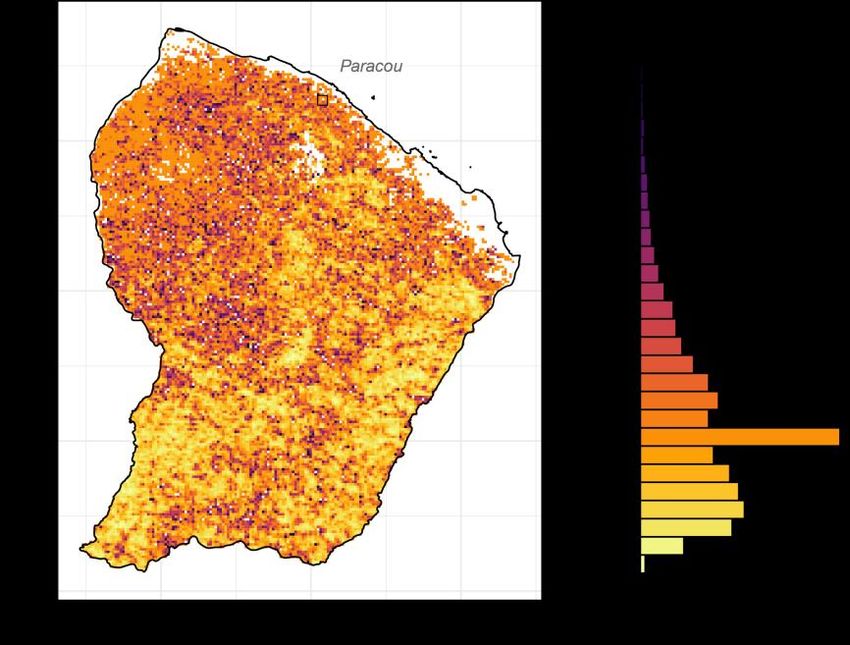
Figure S 2: Goodness of the multivariate linear regression model fit (eq. 6). (a) Frequency distributions of simulated versus fitted
20   biomass mortality rates (mAGB). The dashed line indicates the arithmetic mean of both distributions. (b) Test for normally distributed
     residuals of mAGB around the expectation value (Ε(mAGB)) indicated by the dashed line. (c) Test for homoscedasticity of the residuals
     over fitted mAGB.

                                                                       2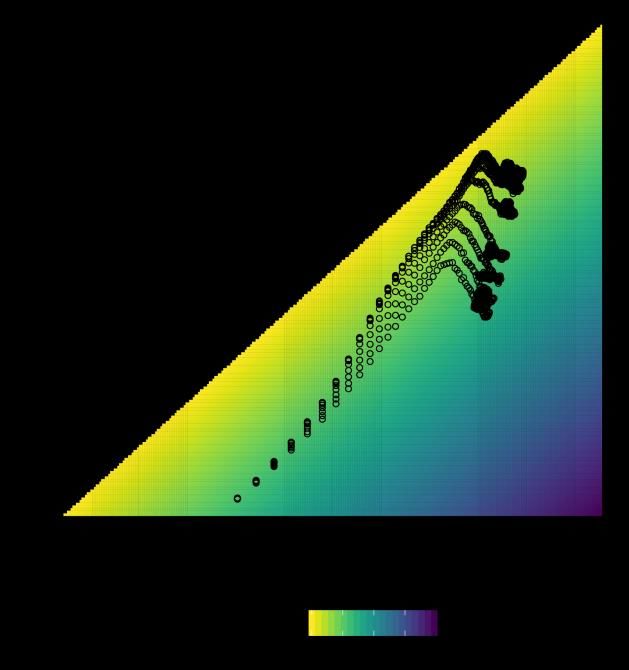
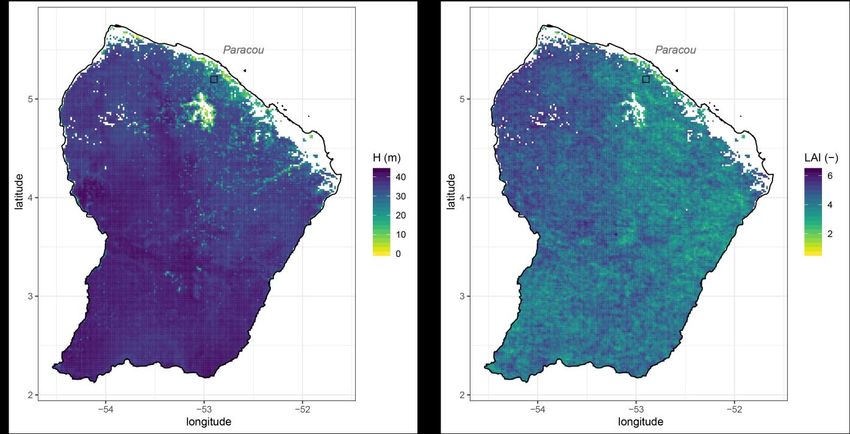
25   Figure S 3: Input maps for deriving biomass mortality rates for Terra Firma forests in French Guiana at ~ 2 km resolution using
     linear regression modelling (eq. 6). (a) ‘Simard’ map of forest height (Simard et al., 2011) and (b) map of leaf area index derived
     using data from the MCD15A2H Version 6 Moderate Resolution Imaging Spectroradiometer (MODIS) Level 4 in a pixel size of 500
     m and averaged then LAI values between 2005-05-20 and 2005-06-23 (Myneni et al., 2015; cf. chap. 2.4). (Projection: WGS-84, EPSG:
     4326).

30

                                                                     3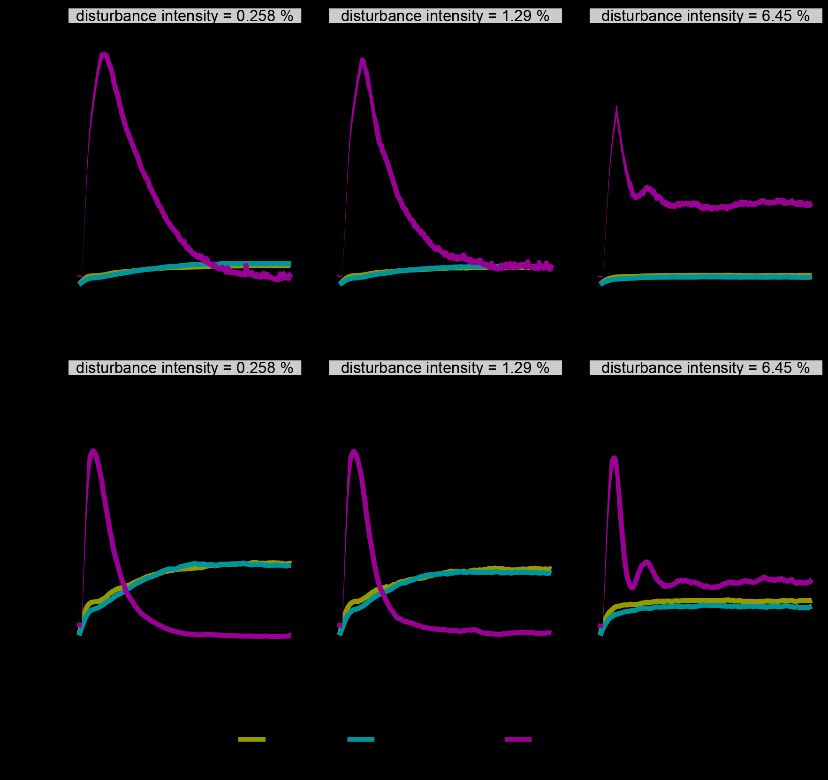
Figure S 4: (left) Map of biomass residence time distribution and (right) its histogram in Terra Firma forest of French Guiana at ~2
     km resolution. To estimate biomass residence time, remote sensing was combined with a forest model that simulated the forest
35   succession. The black square indicates the location of the Paracou site. Leaf area index and forest height were used as proxy variables
     for the underlying multivariate linear regression. (Projection: WGS-84, EPSG: 4326, τ: biomass residence time (cf. eq. 4)).

                                                                       4
Figure S 5: Heat map of biomass mortality rates according to the underlying multivariate regression model (cf. eq. 6) on the basis
40 of its proxy variables leaf area index and forest height. Black dots represent the training data simulated using the forest model
FORMIND. (LAI: leaf area index).
Table S 1: Software used.
To process the simulation data of FORMIND v3.2 as well as the forest height map and LAI map (Myneni et al., 2015; Simard
45 et al., 2011), version 3.6.2 of the R statistical software (R Core Team, 2019) with the packages 'tidyverse' v1.2.1 (Wickham et
al., 2019), ‘viridis’ (Garnier, 2018), ‘broom’ (Robinson and Hayes, 2020), ‘ggpubr’ (Kassambara, 2020), ‘data.table’ (Dowle
and Srinivasan, 2019), ‘gdalUtils’ (Greenberg and Mattiuzzi, 2020), ‘rgeos’ (Bivand and Rundel, 2019), and ‘raster’ (Hijmans,
2020) were used. The FORMIND forest model can be downloaded for free at www.formind.org.
References
50 Bivand, R. and Rundel, C.: rgeos: Interface to Geometry Engine - Open Source ('GEOS’), [online] Available from:
https://cran.r-project.org/package=rgeos, 2019.
Dowle, M. and Srinivasan, A.: data.table: Extension of `data.frame`, [online] Available from: https://cran.r-
project.org/package=data.table, 2019.
Garnier, S.: viridis: Default Color Maps from “matplotlib,” [online] Available from: https://cran.r-project.org/package=viridis,
55 2018.
5Greenberg, J. A. and Mattiuzzi, M.: gdalUtils: Wrappers for the Geospatial Data Abstraction Library (GDAL) Utilities, [online]
Available from: https://cran.r-project.org/package=gdalUtils, 2020.
Hijmans, R. J.: raster: Geographic Data Analysis and Modeling, [online] Available from: https://cran.r-
project.org/package=raster, 2020.
60 Kassambara, A.: ggpubr: “ggplot2” Based Publication Ready Plots, [online] Available from: https://cran.r-
project.org/package=ggpubr, 2020.
Myneni, R., Knyazikhin, Y. and Park, T.: MODIS/Terra+Aqua Leaf Area Index/FPAR 8-day L4 Global 500m SIN Grid V006,
NASA EOSDIS L. Process. DAAC, doi:doi.org/10.5067/MODIS/MCD15A2H.006, 2015.
R Core Team: R: A Language and Environment for Statistical Computing, [online] Available from: https://www.r-project.org/,
65 2019.
Robinson, D. and Hayes, A.: broom: Convert Statistical Analysis Objects into Tidy Tibbles, [online] Available from:
https://cran.r-project.org/package=broom, 2020.
Simard, M., Pinto, N., Fisher, J. B. and Baccini, A.: Mapping forest canopy height globally with spaceborne lidar, J. Geophys.
Res., 116(G4), G04021, doi:10.1029/2011JG001708, 2011.
70 Wickham, H., Averick, M., Bryan, J., Chang, W., McGowan, L. D., François, R., Grolemund, G., Hayes, A., Henry, L., Hester,
J., Kuhn, M., Pedersen, T. L., Miller, E., Bache, S. M., Müller, K., Ooms, J., Robinson, D., Seidel, D. P., Spinu, V., Takahashi,
K., Vaughan, D., Wilke, C., Woo, K. and Yutani, H.: Welcome to the {tidyverse}, J. Open Source Softw., 4(43), 1686,
doi:10.21105/joss.01686, 2019.
6You can also read