Evaluation of the Space Projection Models - Texas Higher Education Coordinating Board - THECB
←
→
Page content transcription
If your browser does not render page correctly, please read the page content below
Evaluation of the
Space Projection
     Models                                     Texas Higher Education
          Mr. Thomas E. Keaton
                                                  Coordinating Board
            Director, Funding
Texas Higher Education Coordinating Board

                                            1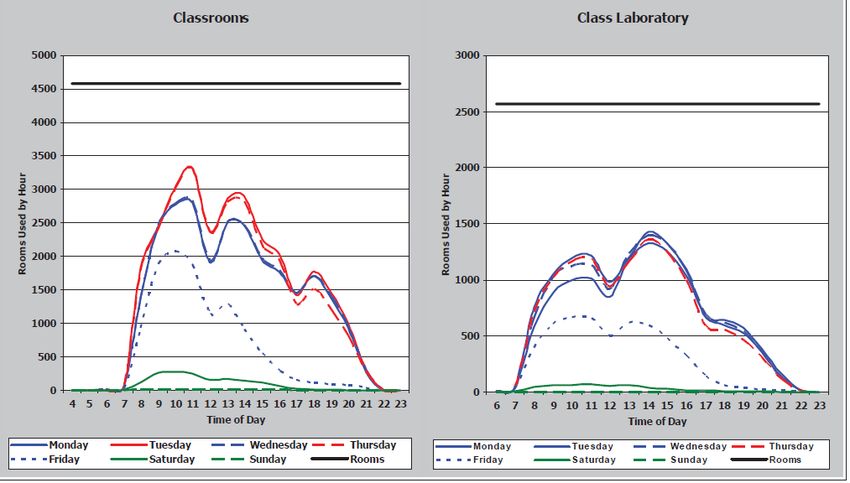
Higher education has changed since 1992…

                                  Space need
                                reduced but not
                                  eliminated

                   2
Purpose of the Study
• Review the space projection model
• Analyze the methodology
• Consider impacts of online courses
• Recommend enhancements to increase accuracy and validity
3Model Overview
• The model has two purposes – predict square feet (SF) for space need
and to inform infrastructure support allocation
• Uses logical drivers to predict space, examples:
• Full‐time student equivalents (FTSE) or headcount for teaching space
• Faculty and staff for office space
• Research activity (expenditures) and faculty for research space
• The model is not a facilities programming tool
• Space for growth needs to be considered on the front end, but the
current model yields unrealistic numbers
4The gap between actual and predicted SF is growing
GAI Total SF Predicted vs Actual HRI Total SF Predicted vs Actual
80 25
Square Feet in Millions
Square Feet in Millions
20
60
15
40
10
20 5
0 ‐
1992 1997 2002 2007 2012 2013 2014 2015 1992 1998 2002 2007 2012 2013 2014 2015
Actual Predicted Actual Predicted
5The percent and number of fully online SCH has increased since 2006
Semester Credit Hours Fully Online
2006‐2015
100% 900,000
90% 800,000
Percent of SCH fully online
Number of SCH “fully online”
80% 700,000
70%
600,000
60%
500,000
50%
400,000
40%
300,000
30%
11.4% 200,000
20% 4.3%
10% 100,000
0% 0
2006 2007 2008 2009 2010 2011 2012 2013 2014 2015
Percent online SCH Fully online
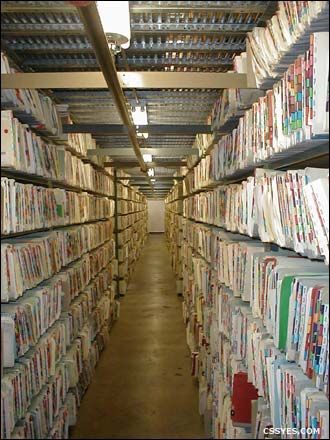
6Statewide data indicate available capacity in existing facilities
Average Classroom and Lab Utilization
40
35
30
25
Hours per week
20
15
10
5
0
2006 2007 2008 2009 2010 2011 2012 2013 2014 2015
Classroom Class Lab Classroom Full Class Lab Full
7Statewide data indicate available capacity in existing facilities
8Process
• Background research into the basis for the existing model
• Data analysis (by sector and factor)
• Time series
• Regression
• Three meetings with each stakeholder group
• Integrate feedback
• External review
9Recommended Changes (GAI)
Current Recommendation
Teaching Teaching
• Four program areas with different coefficients • 40 SF per FTSE (165 for TSTC)
• Economies of scale adjustment • Online adjustment
• Economies of Scale adjustment
Research Research
• Base year to 1992 • Reset base year to 2013
• 9,000 SF per adjusted million, or • 4,150 SF per adjusted million
• 3 SF per FTSE
Office Office
• Base year 1992 • Reset base year to 2013
• 3,500 SF per adjusted million in E&G expenditures, or • 950 SF per adjusted million
• 190 SF per faculty, 170 per staff • Average plus for FTE ratios – 2.0 is base, cap 5
• 1:1.8 faculty to staff ratio
Library Library
• 21 variables • 15 SF per FTSE
• 5 percent law library add on
10Recommended Changes (HRI)
Current Recommendation
Teaching Teaching
• Several program areas with different coefficients • Reduce coefficients by 10 percent
Research Research
• Base year to 1992 • Reset base year to 2013
• 9,000 SF per adjusted million, or • 4,150 SF per adjusted million
• 250 SF per FTE faculty • 250 SF per faculty FTE
Office Office
• Base year 1992 • Reset base year to 2013
• 1,600 SF per adjusted million, or • 950 SF per adjusted million
• 190 SF per faculty, 170 per staff • Average plus for FTE ratios - Average is base, cap 5
• LAR data for faculty: staff ratio
• If headcount calculation is higher, use average
Clinical Clinical
• Actual is the predicted • No change recommended
11If adopted, recommendations would…
• Decrease space deficit from 25 million to 10 million square feet
• Leaves room for growth without over‐predicting
• Change allocations among institutions
• Adjustments would reflect changes in the environment
• Increase the validity of the THECB’s capital project review process
• Improve the Legislature’s ability to evaluate tuition revenue bond
requests
12State sources account for a portion of costs
Infrastructure Support Sources
$1,600
$1,400
$1,200
$1,000
Millions
$800
$600
$400
$200
$-
2006 2007 2008 2009 2010 2011 2012 2013 2014 2015
State Support Other Source
13Recommendations in the report should not be used to…
• Reduce state E&G space support
• State support only covers a portion of the cost
• Institutions must operate and maintain high‐quality facilities
• The THECB has recommended an increase in the formula funding to account
for:
• Enrollment growth
• Inflation
• Support for student completions
14Excerpts from the external reviewer’s comments
Teaching
• “. . . the proposed application provides the same metrics to all institutions regardless of size or mission
with two exceptions.” (TSTCs; Economy of scale reductions for larger institutions)
• “The classroom component number is a bit higher than traditional metrics provided but seems
appropriate . . .”
• “The need for more laboratory space at institutions with complex engineering programs has proved
desirable in a number of other jurisdictions.”
Research
• “The metric in this category is being reduced substantially.”
• “The reduction seems consistent with what the reviewer is seeing in amounts of space per million
dollars of expenditures at successful research institutions.”
Office
• “The proposed calculation which keeps the 190 SF per FTE faculty and 170 SF per FTE staff seems
reasonable.”
• “Looking at the actual staff to faculty ratios seems an improvement over the single ratio that had been
in place.”
15Library
• “THECB had a complicated library formula. It is being changed to a student sized formula with an
add on for law libraries. While this is not a typical approach and, therefore, the reviewer has no
perspective regarding the specific metrics chosen, the application which results in the need for
some additional library space across the state seems reasonable.”
Support
• “The proposed model does not change this factor which remains a percentage of the other
spaces. In the reviewer’s experience, land‐grant institutions and other large research universities
sometimes need more space in this category because of the complexity of their science and
engineering programs, which can have greater needs for support space.”
Clinical
• “This category counts actual space rather than attempting to model it.”
• “ This seems reasonable to the reviewer.”
Space Quality
• “Issues of space quality are not addressed in a space needs model and can be of serious impact
even when the total amount of space is adequate.”
16Discussion
17Texas Higher Education
Coordinating Board
18You can also read