ENSO Dynamics, Trends, and Prediction Using Machine Learning - Rojo Hernández, J. D., Mesa, Ó. J., & Lall, U., 2020.
←
→
Page content transcription
If your browser does not render page correctly, please read the page content below
ENSO Dynamics, Trends, and Prediction Using
           Machine Learning

  Rojo Hernández, J. D., Mesa, Ó. J., & Lall, U.,
                    2020.

                  Group Meeting
                 October 30, 2020
             Santiago Giraldo Cardenas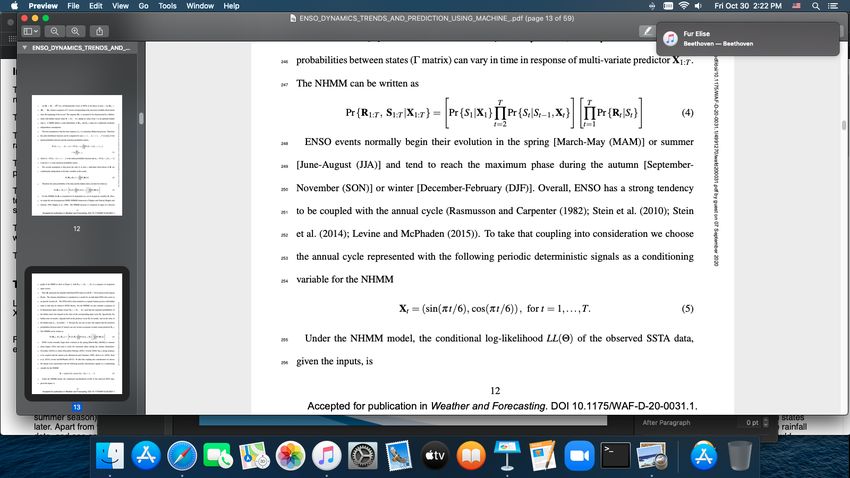
Introduction
!   The spatial pattern is SSTA is key for the evolution and impacts of ENSO
    events.

!   Different flavors or types of ENSO.

    !   Canonical or conventional —> eastern and central tropical Pacific.

    !   Nino Modoki —> central tropical pacific ~ date-line.

!   Different ENSO flavor may represent a continuum (Takahashi et al., 2011).

!   Asymmetry between warm and cold events.

    !   Strong Nino events -> higher intensity than Nina events.

    !   Major Nino events -> eastern Pacific; Strong Nina events -> central Pacific.

    !   Central Pacific heating more frequent in last decades.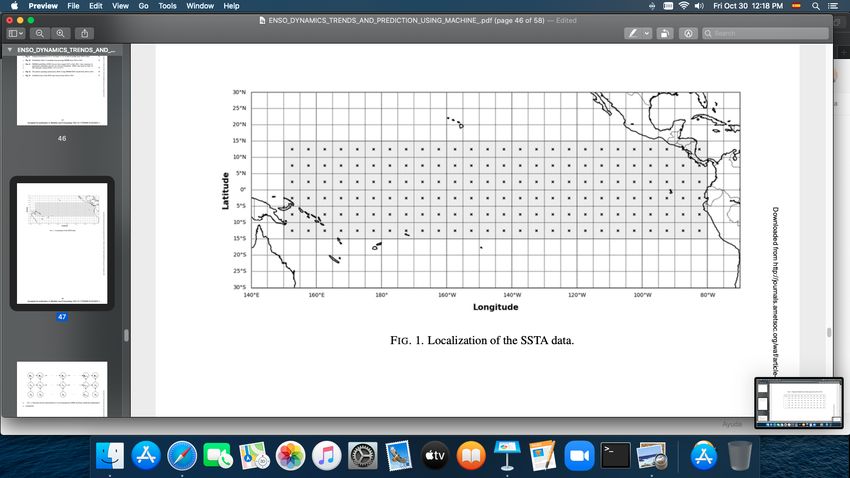
Introduction
                 Trends and projections
!   Weak consensus if observed trends are due to natural variability
    or anthropogenic activity.

!   Most climate models projections: Weakening of Walker’s cell;
    decrease in zonal slope of the thermocline.

    !   May explain increasing CP events; frequency may increase in
        next decades.

!   Positive (negative) global temperature trigger Nino (Nina)
    events.

    !   Warming climate: Nino may be more frequent than Nina.

!   Lack of consensus about weakening Walker’s cell and more Nino
    events due to global warming.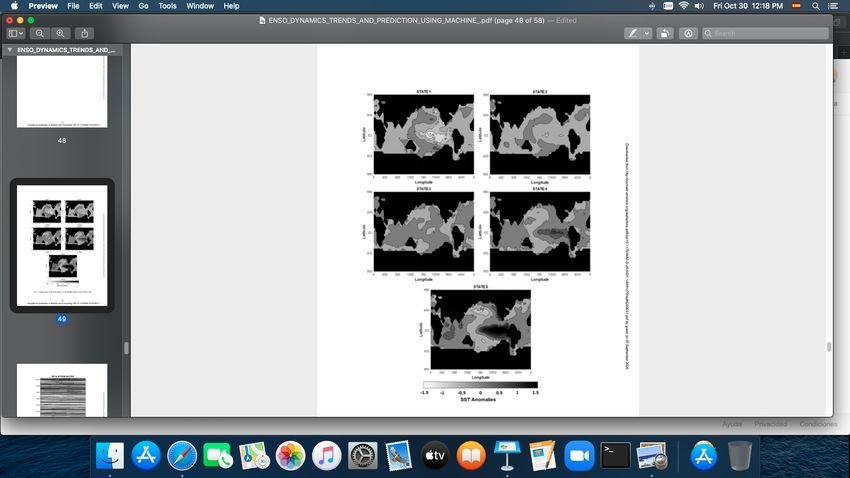
Introduction
                        ENSO in models
!   GCM still have problems with some important features of ENSO.

    !   Amplitude, spatial structure, frequency, seasonal phase
        locking, Nino-Nina asymmetry.

    !   Stability of atmosphere-ocean interactions in ENSO
        projections.

    !   Nino 4 region cold SST variance.

!   Noise level associated with tropical weather.

!   Deterministic and stochastic models.

    !   Linear, non-linear models and Markov chains.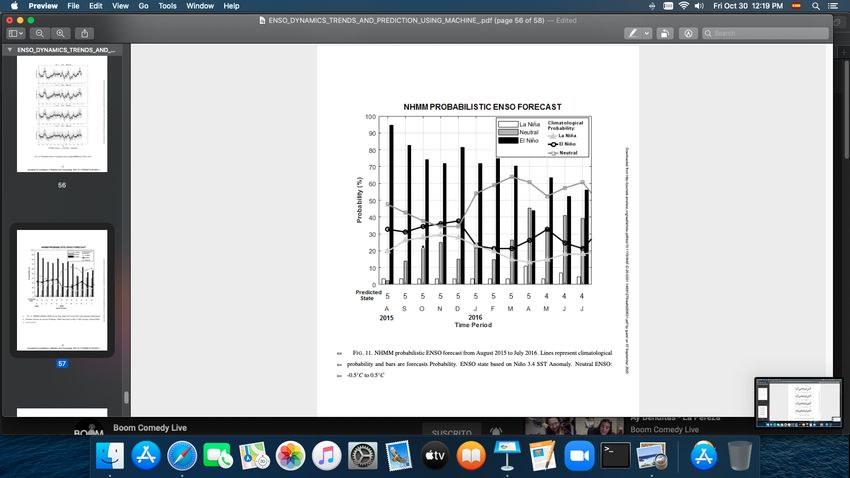
Data and methods
!   SSTA data set derived from the latest version of the
    KAPLAN EXTENDED V2.

    !   Monthly data from 1856 to 2019 with a spatial
        resolution of 5°.

    !   No trend was removed.

!   Non-homogeneous Hidden Markov Model (NHMM).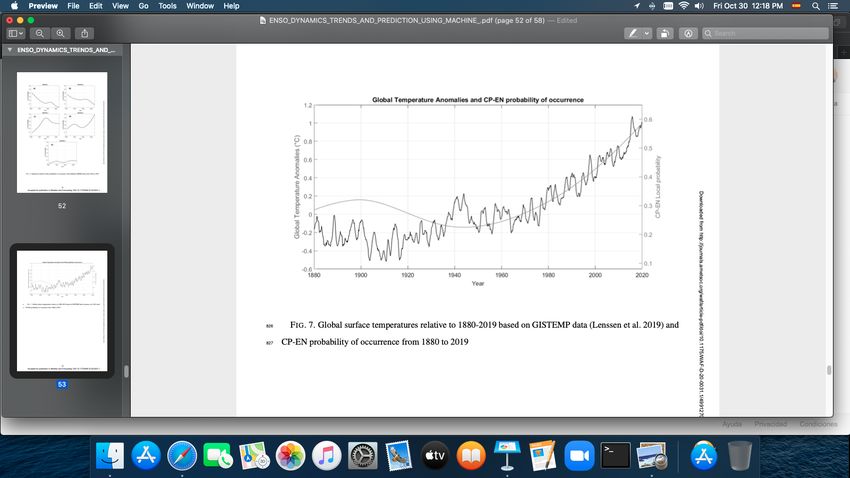
Data and methods
    Non-homogeneous Hidden Markov Model (NHMM).
!   Fits a model to observed data by introducing a small number of discrete datasets.

     !   Diagnostic interpretation of observed data variability in terms of a few data patterns not directly
         observable.

!   Considers a finite set of latent states with Markov transitions over time.

     !   Each latent state is identified with a partition of the state space of the random field modeled.

     !   Markovian dynamics in time, and the spatial field at each time step may correspond to a certain latent
         state with some probability.

     !   Each time period can also be assigned to a specific state in a way that maximizes the likelihood of the
         assignment over the time period of the data —> Transition probabilities for the states.

!   Assumptions:

     !   The state sequence is a stationary Markovian process.

     !   Given the state S at time t, individual observations of are conditionally independent of all other variables
         in the model.

!   Non-homogeneus: observations are considered to depend on an exogenous variable.

     !   They considered the annual cycle: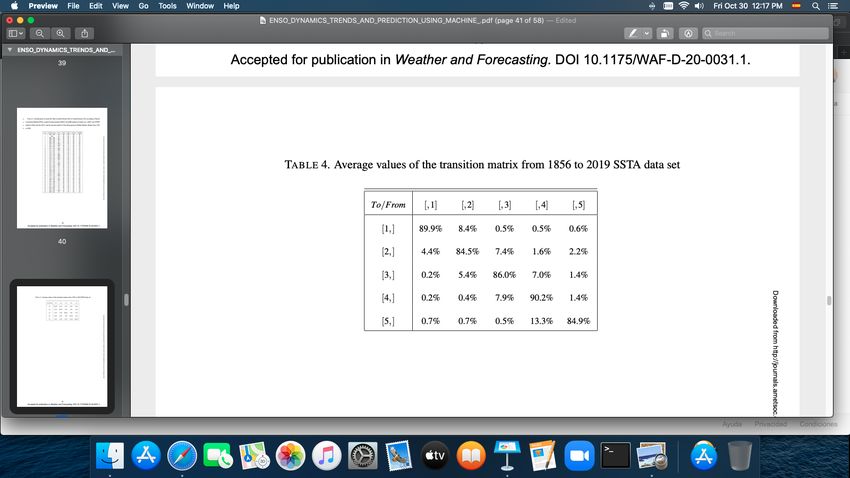
Results
!   5 stated were identified and can
    be interpreted from the coldest to
    the warmest:

    !   1. Strong La Nina.

    !   2. Moderate episodes of La Nina.

    !   3. Neutral state.

    !   4. CP El Nino.

    !   5. EP El Nino.

!   The strongest events of Nino
    present greater anomalies in the
    EP, while strong La Nina events
    tend to be located within the
    central Pacific.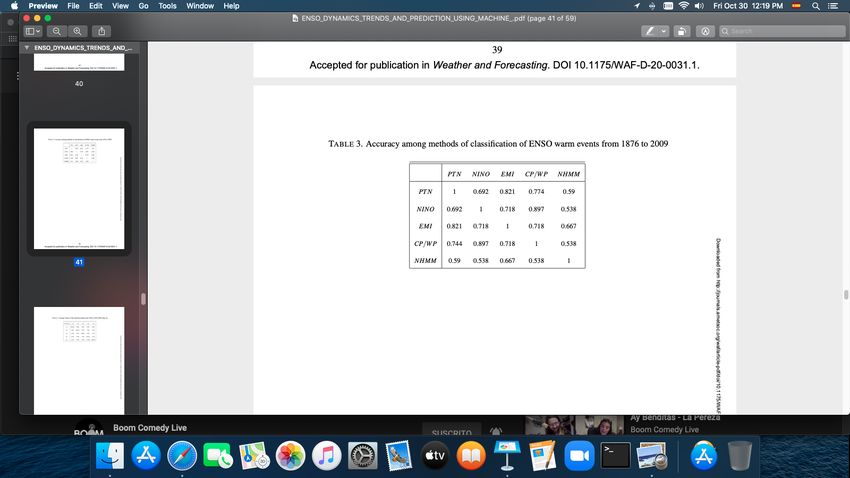
Results
                                 !   Continuity            in   the
!   Persistence of the states.
                                     transitions.
!   CP events tend tp persist
                                     !   More likely to go from 4
    over time.
                                         to 3 than from 4 to 5.
!   EP events with shorter
                                         !   More CP events.
    duration.
                                         !   EP tend to evolve to CP
                                             events.
!   Higher probabilities of going from state 1 to
    state 2 occur during MAM, significantly lower
    values during SON.                                   Results
!   Transition from state 2 to state 3 is more likely
    during spring, but the transition from state 2 to
    state 1 is more likely during the fall.

     !   Weak La Nina tend to become neutral events
         during spring, while tend to evolve to a
         strong La Nina during fall.

!   Transitions from state 3 to state 4, or from state
    3 to state 2 are more likely during the fall.

     !   From a Neutral event to either of the two
         adjacent states is more likely during SON.

!   Transition probabilities from state 4 to state 5
    are greater during the fall, while from state 4 to
    state 3 are higher during spring.

     !   Greater probability that a CP El Nino evolves
         into EP during SOND. Weakening of the CP
         Nino to a neutral condition occurs more
         frequently during spring.

!   Finally moving from state 5 to state 4 state is
    more likely during the spring.

     !   EP El Nino may become a CP event during
         MAM.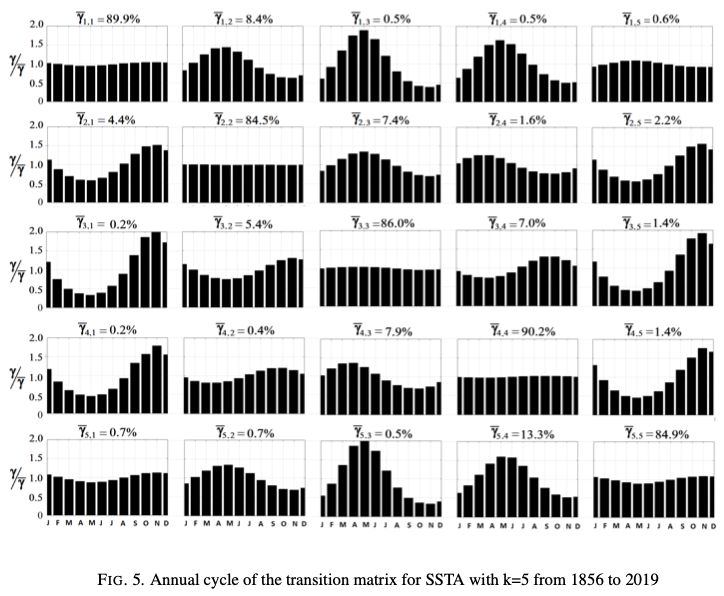
Results
!   NHMM model is more in concordance with the EMI
    method. The closest pair of methods is the NINO-CP/WP,
    with 90% accuracy. Minimum accuracy is 54% for NHMM
    with both NINO and CP/WP classification methods.

!   The accuracy between a pair of models is the ratio of the
    number of same predictions to the total number of
    predictions.
Results
! Cold events have a decreasing
trend in their probability since
1856.
! Neutral conditions, state 3, has
a significant increasing trend
from 1850 until 1940.
! Rapid increase of the warm
event probabilities of CP Nino
events (state 4).
! Increase in the frequency of
this type of events.
! Increase in the likelihood of
occurrence of EP Nino events,
this probability has doubled
since 1940.Results
Results
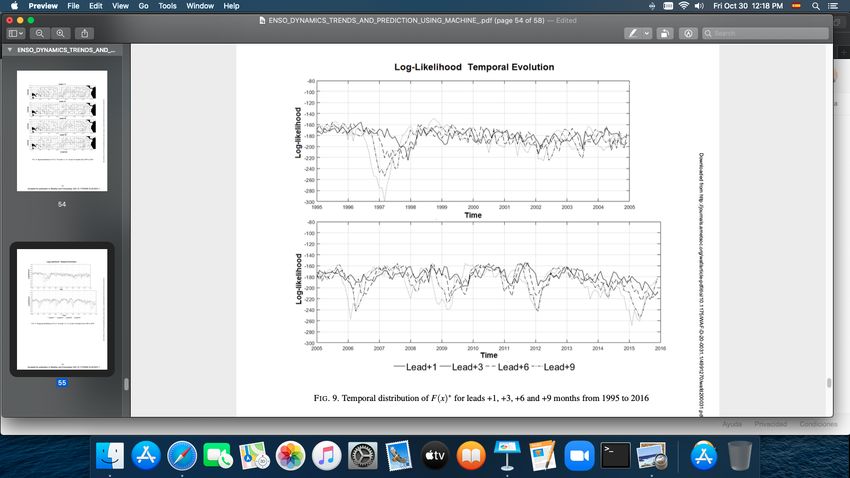
! NHHM adequately
represent the spatial
distribution of the SSTA
for the entire Pacific
Ocean for +1 and +3 lead
times, while for +6 and
+9 some of the spatial
forecasting ability is lost
in the eastern Pacific ,
but the predictions in the
central Pacific remain
acceptable.
! It is a good model for
predicting ENSO
condition.Results
! NHMM ENSO model indicates a
higher chance of EN event
occurring relative to the
historical average form Aug-2015
to July 2016. Given these high
probability anomalies, an
extreme EN event is likely.
! NHMM model —> ability to predict
t h e E N S O f l avo r u s i n g t h e
forecast state probability for each
month and each lead time. In this
case, the NHMM model predicts
an EP-EN case (the warmest state
5), from July 2015 to Apr 2016,
and afterward transitions to a CP
event.
!You can also read