Suppliers' Focus: The Theory of Everything
←
→
Page content transcription
If your browser does not render page correctly, please read the page content below
Detroit – Washington D. C.

   Suppliers’ Focus:
      The Theory of Everything

      TAYSAD Delegation
      March 31, 2015

                                                                      Margaret Baxter
                             Senior Vice President, Operations and International Affairs
                                     OESA – Original Equipment Suppliers Association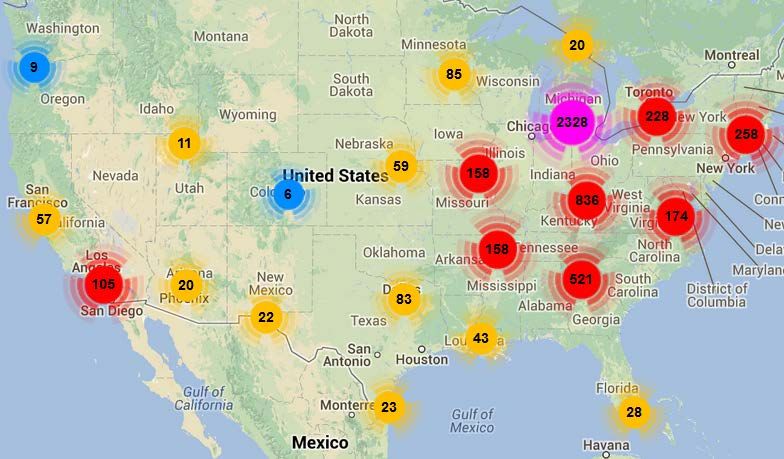
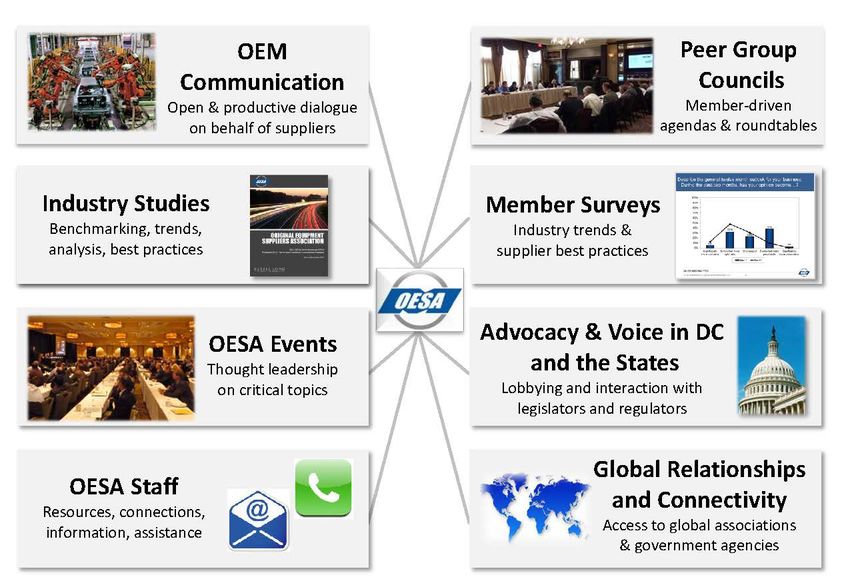
About OESA
Founded in 1998, the Original Equipment Suppliers Association (OESA), serves as the
automotive supplier voice and a valuable resource for member organizations.
Membership is exclusive to original equipment automotive suppliers that directly provide
components, tools, materials and services to the OE light vehicle industry.
Membership is comprised of approximately 450 Tier 1,2, and 3 automotive suppliers with
North American OE sales ranging from $10 million to $5+ billion.
OESA’s interests are guided by a board of directors consisting of CEOs from member
companies.
Members enjoy direct access to 14 dedicated association employees in Detroit and 6 in
Washington, D.C.
2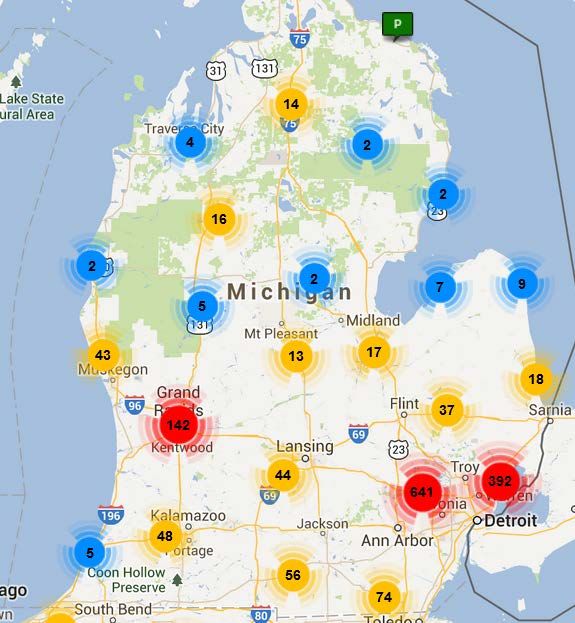
OESA:
The Voice, Forum and Resource

                         3
Short Term: The Automotive Squeeze Play
Revenue Growth Continues – But Slower, Incremental Growth
NA: 800,000 to 400,000 year-over-year unit growth in 2015 and
2016
Launches Drive Caution – Earnings Warnings and Market Share
Shifts
Ford and suppliers noting caution on outlooks
Recalls Drive Panic – All Hands on Deck Responses Required
60 million units in 2014 (2013 = 23 million)
Cash Goes to Shareholders (nothing wrong with that) and
Warranty Reserves (non-value added)
Ford shifts $1.8 billion to dividends and share buybacks; $400
million for warranty/recall reserves
4
North America
 2015-2017 Production Forecast Comparison
 (Volumes represent NA Car, Lt Truck class 1-5)

Δ compares prior reported                            2015
forecast volume                                                                   2016     2017
                                    1Q       2Q       3Q       4Q      2015     Forecast Forecast
                   (in millions) Forecast Forecast Forecast Forecast Forecast
                                4.35      4.48      4.2     4.13      17.17      17.47    18.32

                                4.40      4.46     4.35     4.24      17.44      17.92    18.34

                                4.36      4.55     4.33     4.22      17.46      17.89    18.20

                                4.38      4.71     4.21     3.99      17.31      17.96    18.17

                                4.31      4.41     4.27     4.22      17.21      17.48      na

                                4.28      4.48     4.27     4.32      17.35      17.61    17.88
   Forecast Average             4.35      4.52     4.27     4.19      17.32      17.72    18.18
    Forecast Spread             0.12      0.30     0.15     0.33      0.29       0.49      0.46
          2014 Actual           4.20      4.41      4.17     4.22     17.00

Last Updated: February 2015
Supplier Stress Test: NA Production May Drop 22 Percent From
2015 Forecast and Still be at Breakeven

                    North American Light Duty Sales, Production and Breakeven
           25

                                              NA Sales
           20

           15
Millions

                                                   NA Production

           10
                               12.7 Million   Units = B/E   January 2014                                   January 2015 Breakeven
                               12.0 Million   Units = B/E   January 2013
                                                                                                              13.5 Million Units
                               11.0 Million   Units = B/E   January 2012
            5                  10.5 Million   Units = B/E   January 2011 and July 2011
                               10.0 Million   Units = B/E   May 2010
                                9.5 Million   Units = B/E   Sept 2009

            0

            Production increases 101 percent between 2009 and 2015 (using a 17.3 million
                 projection) while breakeven levels have increased only 40 percent
      Sources: IHS Automotive (December 2014) and                                   OESA Automotive Supplier Barometer- January 2015
      January 2015 OESA Automotive Supplier Barometer
                                                                               6    Published with the support of
Supplier Utilization: The Story is the Lower Quartile
100 The US Federal Reserve and OESA
state that the US supply base is
running approximately at 80%
90 capacity utilization – looking at all
available capacity (the blue line and
80 the middle dot)
Percent Utilization
The lower quartile companies are
70 operating 66% including all available
capacity – a dramatic increase from
55% just three years earlier
60
When asked about utilization rates,
the upper quartile of companies are
50 running at 86% utilization – and this is
FRB: Nov 2014 = 83%
‘all-in’ capacity at a 16.9 million unit level. What
40 happens when we hit 17.7 million units
Jan-07
Apr-07
Jan-08
Apr-08
Jan-09
Apr-09
Jan-10
Apr-10
Jan-11
Apr-11
Jan-12
Apr-12
Jan-13
Apr-13
Jan-14
Apr-14
Jan-15
Jul-07
Jul-08
Jul-09
Jul-10
Jul-11
Jul-12
Jul-13
Jul-14
Oct-07
Oct-08
Oct-09
Oct-10
Oct-11
Oct-12
Oct-13
Oct-14
in 2016?
Dots = Capacity Utilization data from the OESA
Automotive Supplier Barometer May 2012, May
2013, May 2014, January 2015
NAICS 3363 capacity utilization corrected in April 2013 to reflect updates in FRB dataset
Source: U. S. Federal Reserve Board of Governors
7What are Suppliers Doing About It?
• Alternative Work Schedules
• Contingency Workforces
• Productivity/Thru-Put Enhancement
• Existing Plant and R&D Expansions
• Global Footprint Re-Balance (Particularly
Questioning Where and How Mexico Fits)
8The Tooling Sector is Running Flat Out as Well
Design Machining Assembly
Average capacity Average capacity Average capacity
utilization utilization utilization
100% 100% 100%
95% 95%
90% 90% 90%
85%
85% 85% 85%
81% 85% 82%
80% 80% 80%
80%
75% 75%
70% 70% 70%
2014 2015 2014 2015 2014 2015
• Survey question: Based on how you measure capacity internally, identify your current capacity utilization
rate:
• Number of respondents = 79
Source: Harbour Results, January 2015 Tooling BarometerHarbour Results: At a Minimum, The Tooling Industry Needs to
Support 34% Growth by 2018
34%
$13.0
LCC $1.5B 2018 Future
$10.4 Demand based solely on the
number of launches
$ Billion
$9.7 reported by IHS and current
spend reported by OEMs;
without adjustment for
increased content or
localization
Current Spend Current Capacity 2018
Future Demand
• Current Spend = the total of 10 OEMs current annual spend on vendor tooling in N.A.
• Current Capacity = defined by HRI using tool suppliers that are 90% + automotive tool makers, can manufacture
100% of the complete tool, die and mold only, and willing and able to grow with the industry.
• 2018 Future Demand = based on current spend and estimated N.A. model launches (all new and major); Source:
IHS Automotive, OEM Interviews and HRI Estimates.
Source: Harbour Results 10Suppliers are Hiring . . . And Continue to Have Major
Concerns Filling Technical Positions
0% 20% 40% 60% 80% 100%
Engineering - hiring 78 % Will be adding staff
- filling
87% of companies hiring engineers are
Will be cutting staff
having trouble finding candidates
Technicians - hiring 75 %
- filling No change planned
82% of companies hiring technicians are
having trouble finding candidates
Hourly Skilled Trades -
68 %
hiring Yes, we are having
- filling trouble finding
qualified available
83% of companies hiring skilled trades are candidates
having trouble finding candidates No, we are not
Hourly Production -
68 % having trouble
hiring
finding qualified
- filling 1
avalable candidates
1
Note: Data labels show number of respondents
2013 comparative results are shown in the appendix
No. of Responses = 79 OESA Automotive Supplier Barometer- November 2014
Published with the support ofNorth America Production will Hold Its World Share
(yes, Mexico will grow faster than the US and Canada)
U.S. and Michigan Auto Supplier Locations
The States Along the Infrastructure Corridors
Have a Huge Economic Development Opportunity
12For Suppliers Looking to Expand, It is All About Labor Markets,
Inputs, and Operating Environment
Percent of respondents for each rating Wt.
Top 5 Factors 0% 25% 50% 75% 100% Rating
1.64
Availablility of skilled labor 1.76
2.02
Cost of skilled labor 2.04
2.06
Availability of utilities 2.26
2.35
Proximity of customer 2.40
2.46
Non-union environment 2.52
Very Important 2 3 Neutral 5 6 Not at all Important
Other Factors in the Top 10: business taxes, proximity to trucking, worker cost of
living, regulatory/permitting environment, pro-business political environment
13
Source: OESA June 2013; 55 responsesAnd Yes, Public Incentive Packages are an Important Form of
Financing Within Plant Business Case Evaluations
4%
In your most recent plant location decisions,
please rate the following public incentive options.
42% Percent of respondents for each rating
0% 50% 100% Wt. Rating
54% 2.04
Tax abatements
2.19
Tax credits 2.38
2.79
Employee training program funding
Strong influence 2.97
Some influence Sewer, water or other site preparations 3.02
No influence Free land
3.15
3.31
1=Very Important Rating = 2
Rating = 3 Rating = 4
Rating = 5 Rating = 6
7=Not at all Important
14
Source: OESA June 2013, 55 responsesThe Supply Base Faces Unprecedented, Magnitude of
Risk Simultaneously
Operational
Natural
Disasters Globalization
Material Markets Supply disruptions Capacity Legal
management
Pricing and Terms and
availability conditions
Financial Technology Road
Markets Map
Major advances
Access to capital
needed
ROI
Regulations Market Demand
Fuel Economy Consumer
Emissions Acceptance
Safety Perceived Value
15Thank You
Margaret Baxter
Senior Vice President, Operations and International Affairs
OESA – Original Equipment Suppliers Association
1301 West Long Lake Road
Suite 225
Troy, Michigan 48098
248-430-5966
mbaxter@oesa.org
16You can also read