Cape Garden Route & Klein Karoo Visitor Trends - Wesgro
←
→
Page content transcription
If your browser does not render page correctly, please read the page content below

Cape Garden Route & Klein Karoo Visitor Trends

2020
Contents
1. Methodology

2. Participation and Sample Size

3. Executive Summary

4. Cape Garden Route & Klein Karoo Visitor Trends & Patterns
        4.1.    Origin of Visitors
        4.2.    Main Purpose of Visit
        4.3.    Top Activities
        4.4.    Overnight Stay
        4.5.    Average Length of Stay
        4.6.    Accommodation Usage
        4.7.    Average Daily Spend
        4.8.    Top Information Sources
        4.9.    Mode of Transport

5. Cape Garden Route & Klein Karoo Towns

6. Cape Garden Route & Klein Karoo Attractions

7. Acknowledgements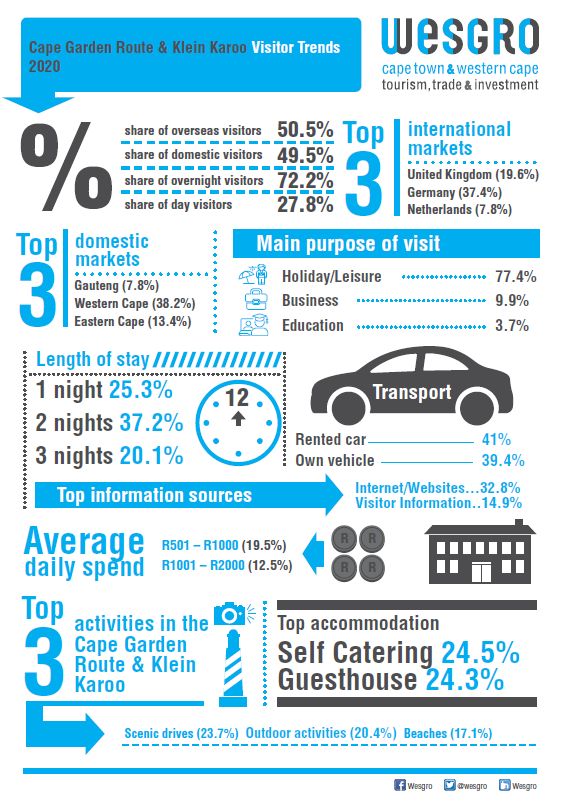
1. Methodology
This report provides an overview of the tourism trends and patterns in the Cape Garden Route & Klein Karoo. The findings will illustrate key visitor trends obtained from the regional visitor
tracking survey.

Responses to the regional visitor tracking surveys are used as a proxy to indicate the key trends within the Western Cape and the various regions. It is important to note that absolute figures
cannot be determined from these surveys, as the survey responses are a sample of the tourists into the respective tourism offices across the Western Cape, and would thus represent a sample
of the visitors. Therefore, where statistically relevant absolute numbers may be given, however, a share is provided to indicate the trend. This is based on international best practice in the use of
surveys within the tourism industry for determining key trends.

Definition: Tourist: refers to any visitor travelling to a place other than that of his/her own environment for more than one night, but less than 12 months and for whom the main purpose of the trip
is other than the exercise of an activity remunerated for from within the place visited.

2. Participation and sample size
  Between January and December 2020, a total of 1 474 responses to the regional visitor tracking survey were received from the respective Tourism Offices in the Cape Garden Route & Klein
  Karoo. The participating Tourism Offices were:

  George                                 391
  Knysna                                 140
  Oudtshoorn                             455
  Plettenberg Bay                        320
  Uniondale                              168

3. Executive Summary

•   In an effort to curb the spread of COVID-19, the South African national government
    announced a nationwide lockdown which took effect on 26 March 2020, resulting in a
    complete standstill of all tourism activity until 31 May 2020. In line with government’s
    risk adjusted strategy, limited tourism activity was introduced in June and
    international borders re-opened in October. However, stricter lockdown restrictions
    were back over the festive season as a result of a second wave of COVID-19
    infections.

•   It should be noted that 90% of visitor surveys in this report were taken between
    January and March 2020 due regulations resulting in a lack of tourists over the
    remaining months because of COVID-19.

•   Visitor surveys conducted in 2020 reflected a fair number of overseas (50,5%) and
    domestic (49,5%) visitors to the Cape Garden Route & Klein Karoo.

•   The top international markets to the region were Germany (37,4%), United Kingdom
    (19,6%), and Netherlands (7,8%).

•   The Western Cape ranked as the top province to the region with 38,2% of domestic
    travellers originating from within the province.

•   Respondents indicated own motor vehicle (39,4%), and rented car (41,0%) as their
    preferred choice of transport to the region.

•   The vast majority of respondents (77,4%) cited holiday/leisure as the main purpose of
    their journey which affirms the region as a favourable holiday destination.

•   Scenic drives was considered the main activity for 23,7% of travellers. In addition
    visitors cited outdoor activities (20,4%) and beaches (17,1%) among the top activities
    undertaken in the Cape Garden Route & Klein Karoo.

•   Day visitors accounted for 27,8% of travellers to the region and 72,2% of visitors
    stayed overnight.

•   Overnight visitors spent an average of 1 night (25,3%), 2 nights (37,2%) or 3 nights
    (20,1%) in the Cape Garden Route & Klein Karoo.

•   Self-catering (24,5%) and Guesthouse (24,3%) were the preferred accommodation
    types amongst respondents.

•   Internet (32,8%) and visitor information centres (14,9%) were the two main sources
    used by visitors to obtain information about the region.
4. Cape Garden Route & Klein Karoo Trends & Patterns

4.1. Origin of Visitors
                                                                                                                        % SHARE OF OVERSEAS AND DOMESTIC VISITORS TO THE CAPE
•   Overseas visitors made up 50,5% of travellers to the Cape Garden Route & Klein Karoo in 2020 which                             GARDEN ROUTE & KLEIN KAROO, 2020
    follows the general trend in the region. Over 90% of visitor surveys were taken during the first quarter of
    2020. No visitor surveys were done during quarter two and three and all visitors who were surveyed in
    quarter four were from the domestic market.

•   Traditional markets such as Germany and the United Kingdom ranked as the region’s top two international
    countries.

•   European travellers continue to drive tourism activity in the Cape Garden Route & Klein Karoo with the top                                                  Domestic;
                                                                                                                                         Overseas;
    five international source markets originating from the continent.                                                                                            49,5%
                                                                                                                                          50,5%
•   Australia, Canada and the United States were also among the top international source markets for this
    region.

•   Nearly two fifths of domestic visitors came from within the Western Cape, 13,4% were from the Eastern
    Cape and 7,8% from Gauteng. 18,4% of respondents who indicated to be from South Africa did not specify
    the province where they originated from.

                     TOP INTERNATIONAL VISITORS TO THE CAPE GARDEN ROUTE & KLEIN KAROO, 2020                              % SHARE OF DOMESTIC VISITORS TO THE CAPE GARDEN ROUTE &
                                                                                                                                             KLEIN KAROO, 2020
                 40,0%   37,4%

                 35,0%                                                                                                 Western Cape                                             38,2%

                 30,0%                                                                                                  Eastern Cape                        13,4%

                                                                                                                             Gauteng                 7,8%
                 25,0%
    % Visitors

                                 19,6%                                                                                Northern Cape               6,3%
                 20,0%
                                                                                                   15,9%                   Free State             5,8%
                 15,0%
                                                                                                                                 KZN          4,4%
                 10,0%                   7,8%
                                                                                                                             Limpopo         3,3%
                                                4,6%   3,9%
                 5,0%                                          2,8%     2,7%     2,7%      2,7%                          Mpumalanga        1,4%

                 0,0%                                                                                             North West Province     1,1%

                                                                                                                       Did not specify                              18,4%
4.2 Main Purpose of Visit

     Health &    Religion; 1,2%      Events/festivals;         Other; 1,8%
     Wellness;                            0,9%
      1,4%
                 VFR; 2,9%
         Education; 3,7%
                                                                                           •   The top motivating factor for travel to the Cape Garden Route & Klein Karoo was for the
                                                                                               purpose of holiday/leisure (77,4%).

                                                                                           •   Travel for business (9,9%), and education (3,7%) ranked as part of the top three
                         Business; 9,9%
                                                                                               reasons for visiting the Cape Garden Route & Klein Karoo.

                                                                                           •   Scenic drives (23,7%), outdoor activities (20,4%) and beaches (17,1%) were the top
                                                                                               three activities undertaken in the region.
                                                         Leisure/Holiday;
                                                                                           •   Activities under the ‘other’ category included expos/exhibitions, health & wellness,
                                                              77,4%
                                                                                               national parks, Astro Tourism, birding, golf, flowers, fishing, cycling, Karoo Lamb (Cape
                                                                                               Karoo Farms), sporting events-participator and shark cage diving.

  4.3 Top Activities

       23,7%
                 20,4%
                             17,1%
                                          14,0%
                                                    12,3%
                                                                 9,0%        8,7%                                                                                               9,8%
                                                                                    6,5%   6,4%       6,3%
                                                                                                                   5,2%        4,8%
                                                                                                                                           3,3%
                                                                                                                                                       2,1%         2,0%
4.4 Overnight Stay                                                                      4.6 Accommodation Usage

                                                                                                  Self Catering                                                         24,5%

                                                                                                  Guesthouse                                                           24,3%

                                                                                                          B&B                                          16,8%
                                           Day Visitor;
                                             27,8%
                                                                                                         Hotel                                        16,5%

               Overnight visitor;                                                       Holiday Rental/ Airbnb             4,0%
                    72,2%
                                                                                                  Backpackers             3,5%

                                                                                             Camping/caravan              3,4%

                                                                                             Friends/relatives            3,2%

                                                                                                    Timeshare      0,2%
4.5 Average Length of Stay
                                                                                              Did not specify             3,5%

                37,2%

   25,3%                                                                                      •    Overnight visitors (72,2%) made up the majority of travellers to the Cape Garden Route
                                                                                                   & Klein Karoo over the Jan – Dec 2020 period and 27,8% of respondents were day
                              20,1%                                                                visitors.

                                                                                              •    Majority of overnight visitors stayed for two nights (37,2%) and 25,3% of respondents
                                                                                                   indicated a stay of one night in the region.
                                             8,9%
                                                                                              •    A quarter of respondents indicated their preferred accommodation type as self-catering,
                                                                         5,0%                      followed by guesthouse (24,3%), and B&B (16,8%).
                                                           3,4%
                                                                                   0,1%

  One night   Two nights   Three nights   Four nights   5 to 6 nights   7 & more   Did not
                                                                          nights   specify
4.7 Average Daily Spend

                                                                                       36,2%

                                                                                                       •    Around 20% of respondents spent between R501 and R1000 daily and 12,5% spent
                                                                                                            between R1001 and R2000 in the region.

                                                                                                       •    Internet (32,8%) and Visitor Information Centres (14,9%) were the most popular tools
                                        19,5%
                                                                                                            used to obtain information about the region. In addition, word of mouth (10,7%) and
                                                                                                            return visits (10,7%) were among the top information sources.
        12,4%            11,5%                            12,5%
                                                                                                       •    Four fifths of respondents travelled to the region via rented cars (41%) or own motor
                                                                         7,9%                               vehicles (39,4%). A small minority travelled via shuttle service (6%), and public
                                                                                                            transport (3,5%).’Other’ modes of transport included long distance bus, mini bus taxi,
                                                                                                            tour bus, and motorbike.

       0-R200          R201-R500    R501-R1000         R1001-R2000     More than   Did not specify
                                                                        R2000

  4.8 Top Information Sources                                                                              4.9 Mode of Transport

                                                                                                                41,0%
         Internet/websites                                                                     32,8%                          39,4%

Visitor Information Centres                                    14,9%

            Word of mouth                              10,7%

                 Return visit                          10,7%

Travel Agent/Tour Operator                      7,8%

         Books/Magazines                  5,4%

             Social Media                 5,4%
                                                                                                                                                                                       7,4%
                                                                                                                                             6,0%
                Newspapers              3,9%                                                                                                               3,5%          2,7%
                  Brochures      0,8%

            Did not specify                    7,6%                                                          Rented Car Own motor           Shuttle        Public       Other         Did not
                                                                                                                         vehicle            service      transport                    specify
6. Cape Garden Route & Klein Karoo Attractions
• The participating Cape Garden Route & Klein Karoo attractions TOTAL NUMBER OF VISITORS TO THE CAPE GARDEN ROUTE &
received a total of 278 062 visitors over the period January to KLEIN KAROO ATTRACTIONS, JAN-DEC 2020
December 2020.
110000 101490
• Visitor numbers to these attractions show an overall decrease of 100000
61,9% over the same period in 2019.
90000
75047 74902 74031
• Visitor numbers were on an upward trend in January (+5,4%), 80000 71323
65855
slowly decreasing in February (-6,3%) and finally plummeted in 70000 79121 61992
March (-47,7%) due to COVID-19 restrictions. 60000 54486
48093
50000 58057
• All attractions in the region were closed throughout quarter two 32850 33723 35336
40000 46668
and most of quarter three of 2020 due to the nationwide
lockdown, which took effect on 26 March 2020. 30000 37312
20000
• Recovery was slow over the remaining months reaching 46 668 10000 3112 20392
0 0 2 3 16530 16865
visitors in December 2020, a 54% decline from the previous 0
year. JAN FEB MAR APR MAY JUN JUL AUG SEP OCT NOV DEC
TOTAL NUMBER OF VISITORS TO THE CAPE GARDEN ROUTE & KLEIN KAROO ATTRACTIONS, JAN - DEC 2020
40 000
35 000
Number of Visitors
30 000
25 000
20 000
15 000
10 000
5 000
0
Jan-20 Feb-20 Mar-20 Apr-20 May-20 Jun-20 Jul-20 Aug-20 Sep-20 Oct-20 Nov-20 Dec-20
Cango Caves 20 839 17 685 9 097 0 0 0 0 0 2 586 3 539 1 927 5 808
Tsitsikamma National Park 36 483 29 181 19 750 0 0 0 1 1 495 7 243 9 000 7 517 18 617
Wildnerness National Park 18 053 8 949 6 907 0 0 2 2 1 129 4 365 5 352 5 524 15 917
Knysna National Park 3 746 2 242 1 558 0 0 0 0 488 2 336 2 501 1 897 6 326
Source: SANParks 2020, Cango Caves 2020TOTAL NUMBER OF VISITORS TO THE CANGO CAVES: JAN - DEC 2020
25 000 100,0% • The Cango Caves welcomed a total of 61 481 visitors in
2020. The highest recorded number of visitors occurred
% Share of Overseas Visitors
90,0%
20 000 80,0% in January with 20 839 patrons visiting the attraction.
Number of Visitors
70,0%
15 000 60,0% • Overseas visitor numbers were the highest in February
50,0% 2020 with 15 450 international patrons visiting the
10 000 40,0% Cango Caves.
30,0%
• South Africa, Germany, and UK were the top 3 source
5 000 20,0%
markets over the period January to December 2020.
10,0%
0 0,0%
Jan Feb Mar Apr- May Jun Jul- Aug Sep Oct- Nov Dec
• The Cango Caves was closed from April to August 2020
-20 -20 -20 20 -20 -20 20 -20 -20 20 -20 -20 due to lockdown restrictions to curb the spread of
Total Visitors 20 839 17 685 9 097 0 0 0 0 0 2 586 3 539 1 927 5 808 COVID-19. Recovery was slow over the third and fourth
Overseas Visitors 13 885 15 450 7 659 0 0 0 0 0 60 40 96 245
quarters with mostly domestic visitors as international
travel only re-opened in October 2020.
% Share of Overseas Visitors 66,6% 87,4% 84,2% 0,0% 0,0% 0,0% 0,0% 0,0% 2,3% 1,1% 5,0% 4,2%
CANGO CAVES VISITOR DISTRIBUTION BY TOP SOURCE MARKETS: JAN - DEC 2020
8 000
7 000
Number of Visitors
6 000
5 000
4 000
3 000
2 000
1 000
0
Jan-20 Feb-20 Mar-20 Apr-20 May-20 Jun-20 Jul-20 Aug-20 Sep-20 Oct-20 Nov-20 Dec-20
South Africa 6 954 2 235 1 438 0 0 0 0 0 2 526 3 499 1 831 5 563
Germany 3756 4985 2986 0 0 0 0 0 14 7 23 31
United Kingdom 2945 3664 1652 0 0 0 0 0 13 23 2 30
India 1340 1069 359 0 0 0 0 0 0 0 20 15
Netherlands 911 959 497 0 0 0 0 0 3 0 13 11
France 450 538 343 0 0 0 0 0 4 0 7 0
Nordics 434 569 276 0 0 0 0 0 0 0 0 0
United States 354 316 139 0 0 0 0 0 2 0 2 10
Asia 302 99 45 0 0 0 0 0 0 0 0 0
Source: Cango Caves 20207. Acknowledgements
Acknowledgements and many thanks go to the following for supplying the data which made this publication possible and whose continued and unwavering support will sustain the forthcoming
issues.
The participating local tourism offices in the Cape Garden Route & Klein Karoo:
• Calitzdorp Tourism
• George Tourism
• Knysna Tourism
• Ladismith Tourism
• Oudtshoorn Tourism
• Plettenberg Bay Tourism
• Wilderness Tourism
• Uniondale Tourism
The participating attractions in the Cape Garden Route & Klein Karoo:
• Cango Caves
• South African National Parks
• Tsitsikamma National Park
• Wilderness National Park
• Knysna National Park
For more information on this publication and other Wesgro publications please contact research@wesgro.co.za. For more publications like this visit the Wesgro publications portal on our
website at www.wesgro.co.za/corporate/resources
Wesgro has taken every effort to ensure that the information in this publication is accurate. We provide said information without representation or warranty whatsoever, whether expressed or
implied. It is the responsibility of users of this publication to satisfy themselves of the accuracy of information contained herein. Wesgro cannot be held responsible for the contents of the
publication in any way.
© Wesgro, 2021
An inspiring place to knowYou can also read