Supporting information Quantifying the strength of a salt bridge by neutron scattering and molecular dynamics
←
→
Page content transcription
If your browser does not render page correctly, please read the page content below
Supporting information
  Quantifying the strength of a salt bridge by
   neutron scattering and molecular dynamics

        Philip E. Mason,∗,† Pavel Jungwirth,∗,† and Elise Duboué-Dijon∗,†,‡

†Institute of Organic Chemistry and Biochemistry, Czech Academy of Sciences, Flemingovo
                        nam. 2, 16610 Prague 6, Czech Republic
  ‡Laboratoire de Biochimie Théorique, CNRS, UPR9080, Univ Paris Diderot, Sorbonne
Paris Cité, PSL Research University, 13 rue Pierre et Marie Curie, 75005, Paris, France

   E-mail: philip.mason@uochb.cas.cz; pavel.jungwirth@uochb.cas.cz; duboue-dijon@ibpc.fr

                                            S1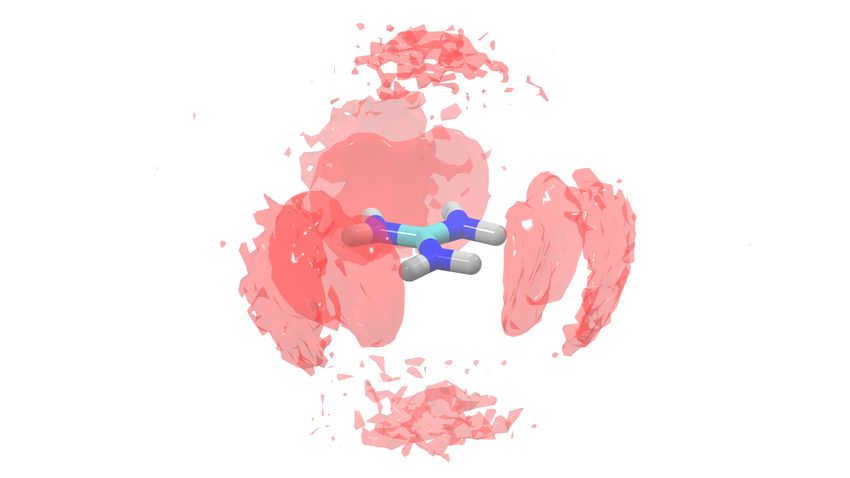
Additional experimental details

Isotopic composition of the solutions We prepared four chemically identical but iso-
topically different solutions with high precision. The isotopic composition of the four solu-
tions is summarized in Table S1
          Table S1: Isotopic composition of the four guadinium acetate solutions.

             Solution index Concentration Acetate Guanidinium            Water
                                                   nat
                    a           3m        h3 -OAc      N-Gdm             D2 O
                                                   15
                    b           3m        h3 -OAc     N-Gdm              D2 O
                                                   nat
                    c           3m        d3 -OAc      N-Gdm             D2 O
                                                   15
                    d           3m        d3 -OAc     N-Gdm              D2 O

First order differences The first order differences, ∆SN                 N
                                                       h3 -OAc (Q) and ∆Sd3 -OAc (Q), can be

expressed as a sum of pairwise structure factors, with the prefactors (in mbarns) obtained
from the concentration and coherent scattering length of each nucleus:

 ∆ShN3 -OAc (Q) = 9.56SNHex (Q) + 3.96SNO (Q) + 0.66SNC (Q) + 0.78SNN (Q)

                                                               − 0.37SNHsubs (Q) − 14.6 (1)

and

 ∆SdN3 -OAc (Q) = 9.56SNHex (Q) + 3.96SNO (Q) + 0.66SNC (Q) + 0.78SNN (Q)

                                                               + 0.67SNHsubs (Q) − 14.6 (2)

Additional computational details

The system was first equilibrated in the NpT ensemble using the Parinello-Rahman baro-
stat 1 with a 1 ps coupling constant and the velocity rescaling 2 thermostat with a 0.5 ps

                                             S2
coupling time. The average box size was then used for the following 50 ns equilibration and
20 ns production runs in the NVT ensemble using the same thermostat. Periodic boundary
conditions were used with a Particle Mesh Ewald 3 treatment of long-range electrostatic in-
teractions with a 12 Å cutoff. A 2 fs time step was employed and hydrogen-containing bonds
were constrained using the LINCS algorithm. 4
The detailed guanidinium force fields are provided in Table S2.
Table S2: Guanidinium force field details.
Full charge force field Scaled charge (ECC) force field
Atom type Charge (e) Charge (e)
CA 0.9013 0.675
N2 -0.8627 -0.647
H 0.4478 -0.647
Additional analyses
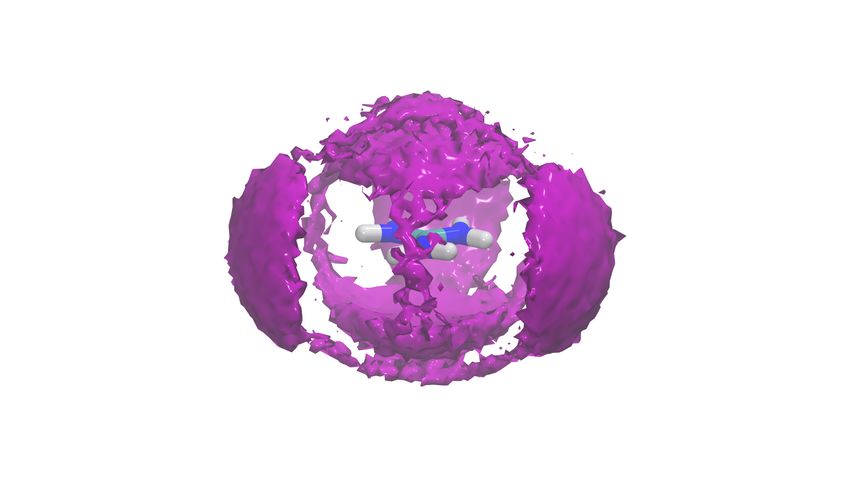
Density maps The density maps of acetate oxygen and hydrogen atoms around guani-
dinium obtained from simulations performed with the full charge force field are presented in
Fig. S1. The features are qualitatively the same as in Fig 4 (main text) obtained with the
ECC force field. The bigger density clouds reflect the stronger ion-ion interaction observed
with the full charge force field.
Molecular origin of the peaks The molecular origin of the shoulder at 4.6 Å (Fig. 5)
proved difficult to identify, because the density maps for acetate hydrogens around guani-
dinium (Fig. 4, at 18 and 2.2 times bulk density) do not reveal any density cloud corre-
sponding to such a N–HAc distance. However, the density map plotted for an even lower
density reveals two shallow additionnal density clouds on top and below the guanidinium
plane (circled in green in Fig.S2), which are located precisely at a ' 4.6 Å distance from
the guanidinium nitrogen atoms. This assignement is further supported by test simulations
S3
a

                    b

Figure S1: a) Density maps of the acetate oxygen atoms around guanidinium for high (18
times bulk density, left-hand panel) and low (2.2 times bulk density, right-hand panel) cutoff
density values. b) Density maps of the acetate hydrogen atoms around guanidinium for high
(left, 18 times bulk density) and low (right, 2.2 times bulk density) cutoff values.

where the van der waals radius of the acetate CH3 group is increased. While both peaks
attributed to the direct H-bond interaction do not move, it causes the shift of the two peaks
at 3.2 and 4.6 Å, thus confirming that they are both related to the second out-of-the-plane
interaction mode.

Figure S2: Density maps of the acetate hydrogen atoms around guanidinium for a 2.0 times
bulk density cutoff value.

                                             S4
Comparison of the interaction strength with earlier measurements. Early poten-
tiometric measurements, 5 that monitored ion pairing through the induced pKa shift, found
a binding constant for the ion pair of KA = 0.37, which corresponds, in the condition of the
experiment, to a fraction Pbound = 0.27 of acetate molecules bound to guanidinium.
In order to compare the performance of our force field with these results, we set up
a simulation box to reproduce the experimental conditions (1 M guanidinium and 0.02 M
acetate), i.e. 1 acetate, 50 guanidinium, 49 chloride ions, and 2600 waters. The bound state
was defined using a criterion, based on examination of the radial distribution functions, on
the distance between acetate oxygen atoms and guanidinium nitrogen atoms: dON < 3.2 Å.
This tight criterion defines the bound state as directly H-bonded ion pairs, which are the
conformation that should mostly affect the pKa. Using this definition, the fraction of bound
state in our simulations is only 0.34 with the ECC force field, corresponding to a KA = 0.53
association constant. This value is in much better agreement with the experimental data
than that obtained with the full charge force field (Pbound = 0.79, KA = 3.9). Note that
the estimate of Pbound is strongly sensitive to the definition of the bound state. Since the
experiment 5 probes the ion association through pKa measurements, the bound state should
include all the pair geometries that induce a significant pKa shift, which is not easy to
determine. In our case, we chose to include only direct H-bonded ion pairs, because they
should have the most pronounced effect on the acetate pKa. However, previous studies have
employed different definitions, 6 together with different force fields and a different procedure
to estimate Pbound , thus leading to larger association constants, which cannot be directly
compared to ours.
Analysis of hydrohpbic interactions in the Protein Data Bank A subensemble of
2265 PDBs of monomeric proteins with less than 30 % sequence identity and a resolution
higher than 1.5 Å were selected on March 20th 2019 from the Protein Data Bank, using the
following search criteria:
S5Resolution is between 0.0 and 1.5 and XrayRefinementQuery: refine.ls_R_factor_obs.
comparator=between refine.ls_R_factor_all.comparator=between refine.ls_R_factor_ R_
work.comparator=between refine.ls_R_ factor_ R_free.comparator=between refine.ls_R
_factor _R_free.min=0 refine.ls_R_factor_ R_free.max=0.25 and Ligand Search : Has
modified polymeric residues=no and Stoichiometry in biological assembly: Stoichiometry is
monomer and Representative Structures at 30% Sequence Identity.
The list of PDB structures thus selected is provided in the separate file listpdb.txt. In order
to study the occurence of the hydrophobic out-of-the-plane interaction, we examined the
distance d between the CZ central atom of the guanidinium moiety of arginine residues and
the CB (for aspartate residues) or CB and CG (for glutamate residues) hydrophobic side
chain atoms. We tried both a strict criterion (d < 4.0 Å) that ensures the hydrophobic side
chain to be right in contact on top or below the guanidinium plane, or a looser criterion
(d < 4.5 Å) that allows more varied geometries. Using the tight criteria, 613 protein struc-
tures (27 % of the total) exhibit at least one such interaction. With the looser criteria, this
numbers raises to 1262 structures (55 % of the total). For comparison, similar analysis for
salt bridge interactions, defined using strict (dN O < 3.2 Å) or loose (dN O < 4.0 Å) criteria,
shows that salt bridge interactions are found in respectively 1753 (77 %) or 1839 (81 %) of
the examined structures.
References
(1) Parrinello, M.; Rahman, A. Polymorphic transitions in single crystals: A new molecular dy-
namics method. J. Appl. Phys. 1981, 52, 7182–7190.
(2) Bussi, G.; Donadio, D.; Parrinello, M. Canonical sampling through velocity rescaling. J. Chem.
Phys. 2007, 126, 014101.
(3) Darden, T.; York, D.; Pedersen, L. Particle mesh Ewald: An Nlog(N) method for Ewald sums
in large systems. J. Chem. Phys. 1993, 98, 10089–10092.
S6(4) Hess, B.; Bekker, H.; Berendsen, H. J. C.; Fraaije, J. G. E. M. LINCS: A linear constraint solver
for molecular simulations. J. Comput. Chem. 1997, 18, 1463–1472.
(5) Springs, B.; Haake, P. Equilibrium constants for association of guanidinium and ammonium
ions with oxyanions. The effect of changing basicity of the oxyanion. Bioorg. Chem. 1977, 6,
181–190.
(6) Debiec, K. T.; Gronenborn, A. M.; Chong, L. T. Evaluating the strength of salt bridges: A
comparison of current biomolecular force fields. J. Phys. Chem. B 2014, 118, 6561–6569.
S7You can also read