Synthesis of fluorescent composite films PVA/CDots from orange concentrate with microwave technique - IOPscience
←
→
Page content transcription
If your browser does not render page correctly, please read the page content below

Journal of Physics: Conference Series

PAPER • OPEN ACCESS

Synthesis of fluorescent composite films PVA/CDots from orange
concentrate with microwave technique
To cite this article: R Jannah et al 2021 J. Phys.: Conf. Ser. 1825 012062

View the article online for updates and enhancements.

                                This content was downloaded from IP address 46.4.80.155 on 06/07/2021 at 20:57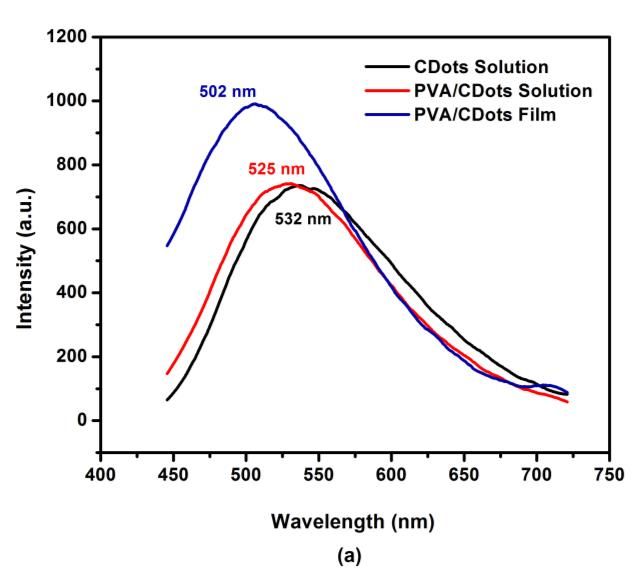
10th International Conference on Physics and Its Applications (ICOPIA 2020)                IOP Publishing
Journal of Physics: Conference Series             1825 (2021) 012062 doi:10.1088/1742-6596/1825/1/012062

Synthesis of fluorescent composite films PVA/CDots from
orange concentrate with microwave technique

                     R Jannah1, Isnaeni2, I W L Lewa2 and Y Iriani1,*
                     1
                       Department of Physics, Faculty of Mathematics and Natural Sciences, Universitas
                     Sebelas Maret (UNS), Sutami Street 36A Surakarta 57126, Indonesia
                     2
                       Research Center of Physics, Indonesian Institute of Sciences (LIPI), Puspitek
                     Serpong, Banten 15314, Indonesia
                     *
                      Email : yofent_iriani@staff.uns.ac.id, rihlatuljannah@student.uns.ac.id

                     Abstract. Carbon dots (CDots) is one of the fluorescent materials that can be made of organic
                     materials. CDots materials can be obtained easily using organic materials that have carbon
                     chain. Synthesis of CDots with orange concentrate as a PVA/CDots composite film using
                     microwave was carried out and the optical properties of synthesized CDots with various
                     concentrations of orange concentrate were observed using excitation wavelength variations by
                     observing emissions of CDots. The successful synthesis of CDots could be recognized by
                     simply irradiating a 405 nm UV laser into a sample and then further characterization using a
                     UV-Vis spectrophotometer and photoluminescence were conducted. The results of UV-Vis
                     characterization showed the effect of concentration variation on the the absorbance peak
                     wavelength. For high concentration, the absorbance peak wavelength is longer than that of low
                     concentration. This is due to the surface state CDots. The characterization of
                     photoluminescence shows CDots emissions. Excitation using a blue laser (λ=420 nm) produces
                     emission peaks that is in the range of green wavelengths, whereas excitation using green laser
                     (λ=532 nm) produces emission peaks that are in the range of yellow-red wavelengths. The
                     results of the synthesized PVA/CDots films from orange concentrates have good potential to be
                     applied as glowing packaging.

1. Introduction
Fluorescent materials have great influence on applications in the fields of bio imaging, LED, and
photocatalysis [1]. Fluorescent materials can be made of inorganic or organic materials. Carbon Dots
(CDots) is a fluorescent material that can be synthesized from various carbon sources and can be made
of organic ingredients [2]. Example of the organic materials, which are often made into CDots, are
from plants, such as ipomoea aquatica [3], ocimum sanctum [4], ginkgo fruits [5], dragon fruit and
pear [6], orange fruit [7] and many other organic materials.
   CDots synthesis is mostly done easily using organic materials to replace Quantum Dots which are
usually made using inorganic material because they have some advantages. The advantages of CDots
are cheap, non-toxic [8], low toxicity, good biocompatibility [9], easy synthesis, production of
fluorescence on UV exposure [10], and several other advantages. These advantages make CDots can
be widely applied in various fields, including anti-counterfeiting applications printed on a banknote
and a merchandise tag [11], amino acid sensors [12], fluorescent plastics manufacturing and

              Content from this work may be used under the terms of the Creative Commons Attribution 3.0 licence. Any further distribution
              of this work must maintain attribution to the author(s) and the title of the work, journal citation and DOI.
Published under licence by IOP Publishing Ltd                          1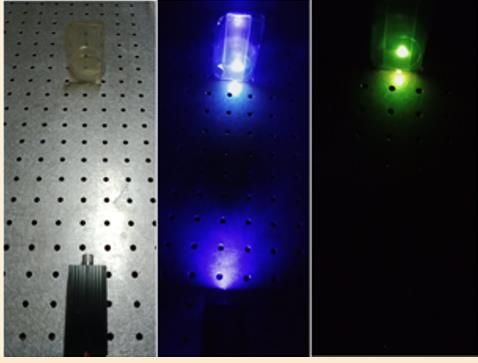
10th International Conference on Physics and Its Applications (ICOPIA 2020)                IOP Publishing
Journal of Physics: Conference Series             1825 (2021) 012062 doi:10.1088/1742-6596/1825/1/012062

fingerprint imaging [13], detection of Hg2 + ions [14], and has potential in various biomedical
applications [15].
    CDots synthesis method can be done with top-down or bottom-up techniques, method selection
CDots synthesis will affect the process conditions, quantum yield, and uniformity of the CDots [16].
The microwave method is one of the bottom-up methods that have been chosen in CDots synthesis
because it has advantages like cheap, simple, easy [17], lower instances side reactions and fewer by-
product formation, and quicker reaction [18]. The quicker reaction using the microwave method can
reduce heating time compared to the method conventional [19]. Also, carbon-based materials have a
strong tendency to interact with microwaves, which makes it possible to achieve efficient and
localized heating thus supporting the carbonization processes and facilitate the emergence of distinct
morphology of the nanostructures [20].
    Nanoparticles that are currently developing can be used as composite materials on polymers, one of
which is Carbon Dots [21]. Polymer nanocomposites have attracted the attention of many research
groups because of their unique physicochemical properties and wide applications [22]. In fact, among
all the polymeric materials, PVA (Polyvinyl acetate, PVA or PVAc) is recently rated as one of the
most important polymers because it’s a simple fabrication, stability against atmospheric conditions,
affordability, visibility, and others [23]. In previous research, synthesized PVA/CDots composite films
have been successfully done. Jiang et al [24] synthesized PVA/CDots composite film, in which m-
phenylenediamine citric acid was used as carbon sources for advanced anti-counterfeiting. Also, Kwan
et al [25] synthesized PVA/CDots composite film from citric acid and synthesized using microwave-
assisted method. Therefore, considering the result of the research [24,25], it provokes the idea for
synthesized PVA/CDots composite film with CDots produced from orange concentrate can be used for
the advanced glowing packaging. The uses of PVA for composites in the synthesis of CDots for
research are to minimize hindrances to the excitation and CDots emissions [25]. The synthesis of
CDots in this study was carried out by the microwave method which aims to determine the optical
properties of CDots with variations in the concentration of orange concentrates and variations of
excitation wavelength to determine the emission CDots.

2. Experimental
In this study three types of samples were made, the CDots solution, PVA/CDots solution, and
PVA/CDots film. The synthesis of the CDots solution was done by the microwave method. Orange
concentrate as a basic ingredient in making CDots obtained from pulpy orange beverage. Orange
concentrate as much as 20 ml for each high concentration samples and low concentration samples are
heated in microwave 450 W for 10 minutes. Then the samples are dissolved in purified water with hot
stirrer 300 rpm for 10 minutes and centrifuged to separate the CDots solution with the precipitate. The
manufacture of PVA/CDots solution was done by mixing the PVA solution with CDots solution. 28
ml PVA solution and 2 ml CDots solution was stirred using an ultrasonic bath for 15 minutes.
PVA/CDots coating is made with 5 ml of PVA/CDots solution which is oven-shaped (baking pan) for
1 hour 45 minutes at a temperature of around 54°C so that the PVA/CDots film is obtained in the form
of a brownish yellow transparent plastic. To find out the success of CDots synthesis, the samples were
simply confirmed by irradiating a 405 nm UV laser into samples. Furthermore, we characterized
samples using UV-Vis spectrophotometer and Photoluminescence (PL). UV-Vis spectrophotometer
characterization was performed to determine the CDots absorbance, while PL characterization was
performed to determine the wavelength of CDots emissions seen from the formation of the CDots
luminescence spectrum. PL characterization is done by irradiating a green laser (λ = 532 nm) and a
blue laser (λ = 420 nm) to the sample.

3. Result and discussion
The results of the synthesis of CDots based on orange concentrate is brown for CDots solution
samples, yellowish for PVA/CDots solution samples, and transparent brownish-yellow for PVA/CDots
film samples. The test results by irradiation of a 405 nm UV laser into the samples are shown in figure

                                                    2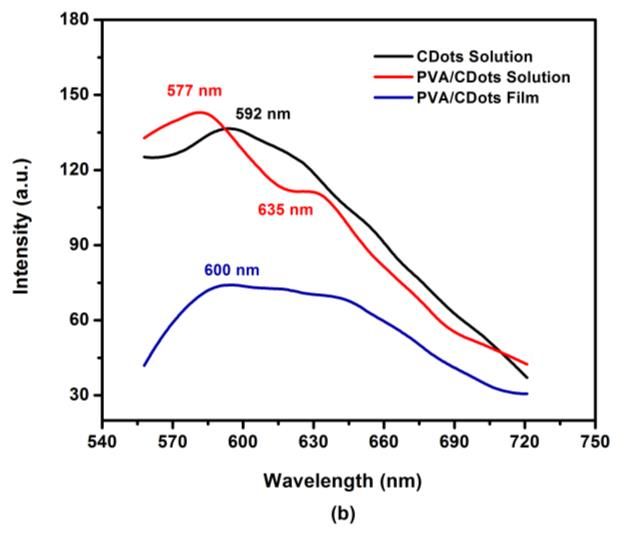
10th International Conference on Physics and Its Applications (ICOPIA 2020)                IOP Publishing
Journal of Physics: Conference Series             1825 (2021) 012062 doi:10.1088/1742-6596/1825/1/012062

1. The successful synthesis of CDots with orange concentrates shows green glow (figure 1 (c)). This
indicates that the results of the synthesis of CDots are based orange concentrate has good fluorescence
properties.

                                      (a)          (b)          (c)
                                Figure 1. The test results by
                                irradiation of a 405 nm UV laser into
                                the sample (a) light without a laser (b)
                                dark with laser without filter (c) dark
                                with laser and 500 nm long-pass filter.

  UV-Vis characterization was performed to determine absorbance patterns at certain wavelengths
which are displayed as curve between absorbance (x axis) and wavelength (nm) in y-axis. Results of
UV-Vis characterization for high concentrations and low concentrations is shown in figure 2.

           Figure 2. (a) UV-Vis spectra at high concentration, and (b) low concentration of samples.

    The results of characterization for high concentrations in CDots solution showed 3 absorbance
peaks, which are at 265 nm, 302 nm, and 399 nm. While the PVA/CDots solution showed 2 peaks the
absorbance at 256 nm, and 308 nm. Then, the characterization results for low concentrations at CDots
solution showed 3 peaks of absorbance, at 253 nm, 304 nm, and 404 nm. While the PVA/CDots
solution showed 2 peaks of absorbance at 252 nm and 292 nm. The first peak at that wavelength
showed the electron transition π → π * (core) and second, and third peak indicates the electron
transition n → π * (surface state). Transition π (bonding) to π * (antibonding) shows the core transition
of CDots, which is C = C, while the transition of n (nonbonding) to π * (antibonding) shows the
surface transition of CDots to atoms other than atom C. This is following previous reports by Anwar et
al [20].

                                                    3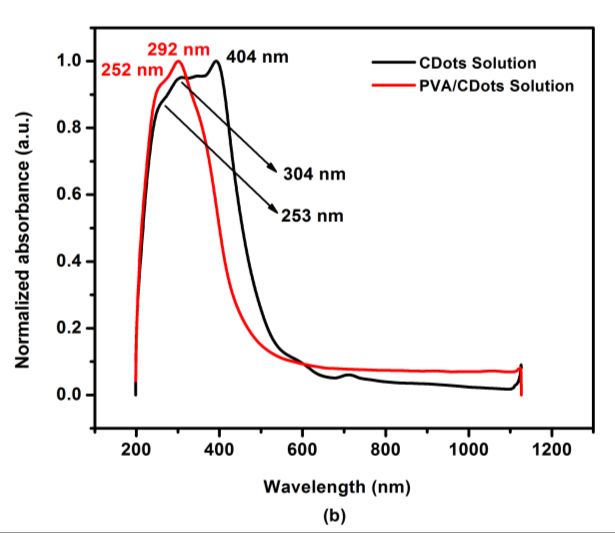
10th International Conference on Physics and Its Applications (ICOPIA 2020)                IOP Publishing
Journal of Physics: Conference Series             1825 (2021) 012062 doi:10.1088/1742-6596/1825/1/012062

                Table 1.The absorbance peak wavelength of UV-Vis characterization.

                                                         Wavelength (nm)

                   Concentration       CDots solution           PVA/CDots solution

                                      Peak 1       Peak 2     Peak 1   Peak 2    Peak 3

                       High             265         308         265        302    399

                       Low              252         292         253        304    404

    Based on the two charts the test results, it can be seen that the microwave method was successfully
used to synthesize CDots. This is indicated by the peak absorbance in the solution CDots, which are in
the wavelength range of 250-310 nm. This is consistent with the results of previous studies, which
showed that CDots had absorbance spectra in the UV region with the tail extending to the visible
region [26]. The addition of PVA in the CDots solution was aimed to form PVA/CDots composite
films. When PVA is added, a long shift occurs to longer wavelength, which is as much as 91 nm (from
308 nm to 399 nm) for high concentration, and as much as 112 nm (from 292 nm to 404 nm) for low
concentrations. Addition PVA in CDots solution with variations in concentration shows that the higher
the concentration, then the absorbance peak of the CDots shifts to the shorter wavelength, wherein the
spectrum, a long shift occurs for 5 nm (from 404 nm to 399 nm), while in CDots solution with
variations in concentration shows that the higher the concentration, then the absorbance peak of the
CDots shifts to the right, wherein the spectrum, a long shift occurs wavelength of 16 nm (from 292 nm
to 308 nm). The most dominant absorbance peak depends due to variations in concentration that is on
the surface state with transitions n → π *.

     Table 2. The emission peak wavelength of PL characterization with a blue laser (λ=420 nm)

                                                         Wavelength (nm)
                  Concentration
                                         CDots            PVA/CDots         PVA/CDots
                                        solution           solution           film
                      High                532                525               502
                      Low                 535                523               504

                                                     4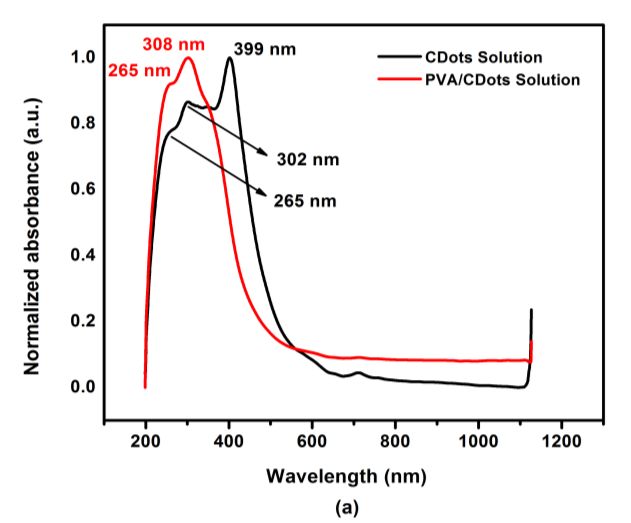
10th International Conference on Physics and Its Applications (ICOPIA 2020)                IOP Publishing
Journal of Physics: Conference Series             1825 (2021) 012062 doi:10.1088/1742-6596/1825/1/012062

     Figure 3. (a) PL spectra with a blue laser (λ=420 nm) at high concentration, and (b) low
     concentration of samples.

    PL characterization was carried out to determine the maximum emission wavelength produced by
CDots. PL characterization is related to the transition from excited to ground state. The results of PL
characterization with blue and green lasers are shown in figures 3 and 4. In this spectrum, the physical
meaning of intensity is the bright dim luminescence of CDots and physical meaning of the
wavelengths is the color of luminescence. The peak emission intensity is the result of PL
characterization strengthen the indication of the formation of CDots in the sample due to oven or
microwave heating. The appearance of luminescence is one of the properties of CDots [27].

     Table 3. The emission peak wavelength of PL characterization with green laser (λ=532 nm).

                                                          Wavelength (nm)
                                                             PVA/CDots       PVA/CDots
                 Concentration       CDots solution
                                                              solution         film
                                    Peak 1    Peak 2       Peak 1   Peak 2     Peak 1
                     High            598         -          623       -         633
                     Low             592         -          577      635        600

    The heating produces more CDots that absorbs more excitation energy. Excited electrons of CDots
is an unstable state, so the electrons return to the ground state. This transition is done by radiating
electromagnetic waves at certain wavelengths. This emission is detected as intensity emissions from
CDots on PL characterization charts [28].
    Figures 3 and 4 show that the intensity of the PL spectrum is also affected by variations in
concentration. The intensity value of the PVA/CDots film tested using a blue laser for high
concentrations was 985.68 a.u. and for low concentrations 406.27 a.u (Figure 3). Then, the intensity
value of the PVA/CDots film tested using a high concentration green laser was 94.75 a.u. and for low
concentrations 73.62 a.u (Figure 4). Based on the intensity value, it can be seen that the greater the
sample concentration, then the higher the intensity value. The higher the intensity value indicates that
the number of CDots produced is increasing [29].

                                                      5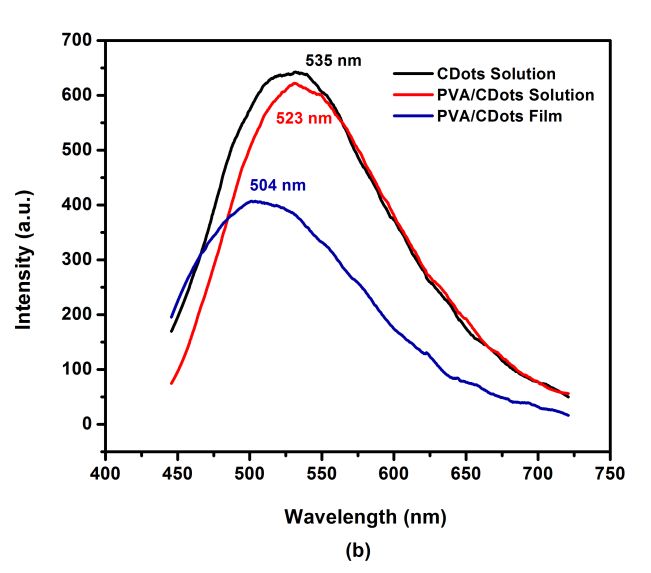
10th International Conference on Physics and Its Applications (ICOPIA 2020)                IOP Publishing
Journal of Physics: Conference Series             1825 (2021) 012062 doi:10.1088/1742-6596/1825/1/012062

      Figure 4. (a) PL spectra with a green laser (λ=532 nm) at high concentration, and (b) low
      concentration of sample.

    The characterization results for blue laser excitation at high concentrations and low concentrations
indicate peak emissions which are in the wavelength range of green color is 495-570 nm so it can be
concluded that the synthesized CDots produced a green glow. This also applies to the results of the test
after being exposed to a UV 405 nm laser that is tinted green (figure 1). Then, for green laser
excitation at high concentrations and low concentrations shows emission peaks are in the range of the
yellow-red wavelength, which is 570-750 nm. The difference of wavelength range of peak emissions
produced by the blue laser and green laser excitation is because there is a difference in the energy
absorbed by electrons in carbon dots due to different exciation lasers.

4. Conclusion
Synthesis of CDots with orange concentrate as a PVA/CDots composite film has been successfully
carried out using the microwave technique. UV-Vis characterization shows that the concentration can
affect the optical properties of the CDots. Higher the concentration of CDots resulted peak shift to
longer wavelength or the spectrum will shift to the right, and vice versa. The PL characterization
showed that the concentration affected the intensity and the wavelength of the excitation affected the
emission of CDots. The greater the sample concentration, then the higher the intensity value.
Excitation wavelength affects the emissions of CDots. Excitation lighting with a blue laser (λ=420
nm) produces luminescence or peak emissions that are at the wavelength range is green, while the
lighting is excited by a green laser (λ=532 nm) produces luminescence or peak emissions that are in
the range of colored wavelength yellow-red. The results of the synthesized PVA/CDots films from
orange concentrates have good potential to be applied as glowing packaging.

Acknowledgments
Thank you to the Indonesian Institute of Sciences (LIPI) Physics Research Center (P2F) for supporting
and permitting us to conduct this research at the P2F-LIPI Laser Laboratory.

References

[1]    Liu J, Ren J, Xie Z, Guan B, Wang J, Ikeda T and Jiang L 2018 Nanoscale10 4642–49
[2]    Xu D, Lin Q and Chang H 2019 Small Methods4 1900387
[3]    Dwandaru W S B, Fauzi F, Sari D S, Sari E K, Santoso I and Suhendar H 2019 Jurnal
          Penelitian Fisika dan Aplikasinya (JPFA)9 123-31

                                                    6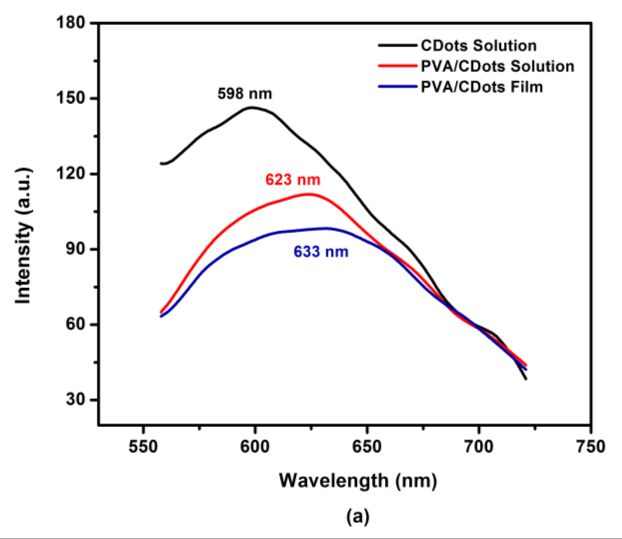
10th International Conference on Physics and Its Applications (ICOPIA 2020)                IOP Publishing
Journal of Physics: Conference Series             1825 (2021) 012062 doi:10.1088/1742-6596/1825/1/012062

[4]    Kumar A, Chowdhuri A R, Laha D, Mahto, T K, Karmakar P and Sahu S K 2016 Sens.
          Actuators B: Chem.242 679–86
[5]    Li L, Li L, Chen C-P, and Cui F 2017 Inorg. Chem.Commun.86 227-31
[6]    Hepriyadi S U and Isnaeni 2018 Omega: Jurnal Fisika dan Pendidikan Fisika4 19-23
[7]    Liu Y and Han S 2017 Food Anal. Methods10 3398–406
[8]    Liu H, Ding J, Zhang K and Ding L 2019 Talanta209 120508
[9]    Doroodmand M M and Askari M 2017 Anal. Chim. Acta968 74–84
[10]   Kandra R, and Bajpai S 2019 Arabian Journal of Chemistry
[11]   Cheng K, Qi R, Lan S, Wang H, Zheng X, Liu C, Jia D, Cao L and Wang D 2019 Tunable
          excitation dependent-fluorescence of carbon dots: fingerprint curves for super anti-
          counterfeiting dyes and pigments174 108106
[12]   Tabaraki R and Abdi O 2019 J. Fluoresc.9 751–6
[13]   Pacquiao M R, de Luna M D G, Thongsai N, Kladsomboon S and Paoprasert P 2018 Appl. Surf.
          Sci.453 192–203
[14]   Li Z, Zhang Y, Niu Q, Mou M, Wu Y, Liu X., Yan Z and Liao S 2017 J. Lumin.187 274–80
[15]   Sahiner N, Suner S S, Sahiner M and Silan C 2019 J. Fluoresc.29 1191-200
[16]   Sjahriza A, Herlambang S and Wati I F 2018 al-Kimiya: Jurnal Ilmu Kimia dan Terapan5 52-6
[17]   Tabaraki R and Abdi O 2019 J. Iran. Chem. Soc.
[18]   De Medeiros T V, Manioudakis J, Noun F, Macairan J.-R, Victoria F and Naccache R 2019 J.
          Mater. Chem. C.7 7175-95
[19]    Hou J, Li H, Wang L, Zhang P, Zhou T, Ding H and Ding L 2016 Talanta146 34-40
[20]   Anwar S et al 2019 ACS Applied Bio Materials 2 2317-38
[21]   Chu K W, Lee S L, Chang C J and Liu L 2019 Polymers11 689
[22]   Aziz S B, Hassan A Q, Mohammed S J, Karin W O, Kadir M F Z, Tajuddin H A and Chan N N
          M Y 2019 Nanomaterial9 216
[23]   El-Shamy A G 2020 Polymer 122565
[24]   Jiang K, Zhang L, Lu J, Xu C, Cai C and Lin H 2016 Angew.Chem. Int. Ed.55 7321-5.
[25]   Kwan M N H, Leo C P, Arosa Senanayake S N M, Lim G K and Tan M K 2019 J. Environ.
          Chem. Eng. 103187
[26]   Dewi A R C, Aji M P and Sulhadi S 2016 Prosiding Seminar Fisika (E-Journal) 5 Pp. Snf2016-
          Mps
[27]   Ghifari A D A, Putra W P and Isnaeni 2017 Prosiding Seminar Nasional Fisika 6 Pp. Snf2017-
          Mps
[28]   Sari E K 2019 Sintesis dan karakterisasi carbon-dots berbasis minyak zaitun berbahan dasar
          limbah tulang ayam Skrispi: Universitas Negeri Yogyakarta
[29]   Agustin M 2019 Pemanfaatan nanomaterial carbon nanodots berbahan dasar limbah kulit
          mangga sebagai absorben CO2 pada pemurnian biogas Skipsi: Universitas Negeri
          Yogyakarta

                                                    7
You can also read